One for The Echo Chamber


We must get better at educating clever kids


GP

May 2014

A Closer Look at Level 6

This post provides a data-driven analysis of Level 6 (L6) performance at Key Stage 2, so as to:

pencil-145970_640

  • Marshall the published information and provide a commentary that properly reflects this bigger picture;
  • Establish which data is not yet published but ought to be in the public domain;
  • Provide a baseline against which to measure L6 performance in the 2014 SATs; and
  • Initiate discussion about the likely impact of new tests for the full attainment span on the assessment and performance of the highest attainers, both before and after those tests are introduced in 2016.

Following an initial section highlighting key performance data across the three L6 tests – reading; grammar, punctuation and spelling (GPS); and maths – the post undertakes a more detailed examination of L6 achievement in English, maths and science, taking in both teacher assessment and test outcomes.

It  concludes with a summary of key findings reflecting the four purposes above.

Those who prefer not to read the substantive text can jump straight to the summary from here

I apologise in advance for any transcription errors and statistical shortcomings in the analysis below.

Background

Relationship with previous posts

This discussion picks up themes explored in several previous posts.

In May 2013 I reviewed an Investigation of Level 6 Key Stage 2 Tests commissioned and published by in February that year by the Department for Education.

My overall assessment of that report?

‘A curate’s egg really. Positive and useful in a small way, not least in reminding us that primary-secondary transition for gifted learners remains problematic, but also a missed opportunity to flag up some other critical issues – and of course heavily overshadowed by the primary assessment consultation on the immediate horizon.’

The performance of the highest primary attainers also featured strongly in an analysis of the outcomes of NAHT’s Commission on Assessment (February 2014) and this parallel piece on the response to the consultation on primary assessment and accountability (April 2014).

The former offered the Commission two particularly pertinent recommendations, namely that it should:

‘shift from its narrow and ‘mildly accelerative’ view of high attainment to accommodate a richer concept that combines enrichment (breadth), extension (depth) and acceleration (faster pace) according to learners’ individual needs.’

Additionally it should:

‘incorporate a fourth ‘far exceeded’ assessment judgement, since the ‘exceeded’ judgement covers too wide a span of attainment.’

The latter discussed plans to discontinue L6 tests by introducing from 2016 single tests for the full attainment span at the end of KS2, from the top of the P-scales to a level the initial consultation document described as ‘at least of the standard of’ the current L6.

It opined:

‘The task of designing an effective test for all levels of prior attainment at the end of key stage 2 is…fraught with difficulty…I have grave difficulty in understanding how such assessments can be optimal for high attainers and fear that this is bad assessment practice.’

Aspects of L6 performance also featured in a relatively brief review of High Attainment in 2013 Primary School Performance Tables (December 2013). This post expands significantly on the relevant data included in that one.

The new material is drawn from three principal sources:

The recent history of L6 tests

Level 6 tests have a rather complex history. The footnotes to SFR 51/2013 simplify this considerably, noting that:

  • L6 tests were initially available from 1995 to 2002
  • In 2010 there was a L6 test for mathematics only
  • Since 2012 there have been tests of reading and mathematics
  • The GPS test was introduced in 2013.

In fact, the 2010 maths test was the culmination of an earlier QCDA pilot of single level tests. In that year the results from the pilot were reported as statutory National Curriculum test results in pilot schools.

In 2011 optional L6 tests were piloted in reading, writing and maths. These were not externally marked and the results were not published.

The June 2011 Bew Report came out in favour:

‘We believe that the Government should continue to provide level 6 National Curriculum Tests for schools to use on an optional basis, whose results should be reported to parents and secondary schools.’

Externally marked L6 tests were offered in reading and maths in 2012, alongside L6 teacher assessment in writing. The GPS test was added to the portfolio in the following year.

In 2012, ministers were talking up the tests describing them as:

‘…a central element in the Coalition’s drive to ensure that high ability children reach their potential. Nick Gibb, the schools minister, said: “Every child should be given the opportunity to achieve to the best of their abilities.

“These tests will ensure that the brightest pupils are stretched and standards are raised for all.”’

In 2012 the Primary Performance Tables used L6 results only in the calculation of ‘level 5+’, APS, value-added and progress measures, but this was not the case in 2013.

The Statement of Intent on the Tables said:

‘…the percentage of the number of children at the end of Key Stage 2 achieving level 6 in a school will also be shown in performance tables. The Department will not publish any information at school level about the numbers of children entered for the level 6 tests, or the percentage achieving level 6 of those entered for level 6.’

The nature of the test is unchanged for 2014: they took place on 12, 13 and 15 May respectively. This post is timed to coincide with their administration.

The KS2 ARA booklet  continues to explain that:

‘Children entered for level 6 tests are required to take the levels 3-5 tests. Headteachers should consider a child’s expected attainment before registering them for the level 6 tests as they should be demonstrating attainment above level 5. Schools may register children for the level 6 tests and subsequently withdraw them.

The child must achieve a level 5 in the levels 3-5 test and pass the corresponding level 6 test in the same year in order to be awarded an overall level 6 result. If the child does not pass the level 6 test they will be awarded the level achieved in the levels 3-5 test.’

Anticipated future developments

At the time of writing the Government has not published a Statement of Intent explaining whether there will be any change in the reporting of L6 results in the December 2014 Primary School Performance Tables.

An accompanying Data Warehouse (aka Portal) is also under development and early iterations are expected to appear before the next set of Tables. The Portal will make available a wider range of performance data, some of it addressing high attainment.

The discussion in this post of material not yet in the public domain is designed in part as a marker to influence consideration of material for inclusion in the Portal.

As noted above, the Government has published its response to the consultation on primary assessment and accountability arrangements, confirming that new single assessments for the full attainment span will be introduced in 2016.

At the time of writing, there is no published information about the number of entries for the 2014 tests. (In 2013 these details were released in the reply to a Parliamentary Question.)

Entries had to be confirmed by March 2014, so it may be that the decision to replace the L6 tests, not confirmed until that same month, has not impacted negatively on demand. The effect on 2015 entries remains to be seen, but there is a real risk that these will be significantly depressed.

L6 tests are scheduled to be taken for the final time in May 2015. The reading and maths tests will have been in place for four consecutive years; the GPS test for three.

Under the new arrangements there will continue to be tests in reading, GSP and maths – plus a sampling test in science – as well as teacher assessment in reading, writing, maths and science.

KS2 test outcomes (but not teacher assessment) will be reported by means of a scaled score for each test, alongside three average scaled scores, for the school, the local area and nationally.

The original consultation document proposed that each scaled score would be built around a ‘secondary readiness standard’ loosely aligned with the current L4B, but converted into a score of 100.

The test development frameworks mention that:

‘at the extremes of the scaled score distribution, as is standard practice, the scores will be truncated such that above and below a certain point, all children will be awarded the same scaled score in order to minimise the effect for children at the ends of the distribution where the test is not measuring optimally.’

A full set of sample materials including tests and mark schemes for every test will be published by September 2015, the beginning of the academic year in which the new tests are first deployed.

The consultation document said these single tests would:

‘include challenging material (at least of the standard of the current level 6 test) which all pupils will have the opportunity to answer, without the need for a separate test’.

The development frameworks published on 31 March made it clear that the new tests should:

‘provide a suitable challenge for all children and give every child the opportunity to achieve as high a standard…as possible.’

Additionally:

‘In order to improve general accessibility for all children, where possible, questions will be placed in order of difficulty.’

These various and potentially conflicting statements informed the opinion I have already repeated.

The question then arises whether the Government’s U turn on separate tests for the highest attainers is in the latter’s best interests. There cannot be a continuation of L6 tests per se, because the system of levels that underpins it will no longer exist, but separate tests could in principle continue.

Even if the new universal tests provide equally valid and reliable judgements of their attainment – which is currently open to question – one might reasonably argue that the U turn itself may undermine continuity of provision and continued improvement in schools’ practice.

The fact that this practice needs substantive improvement is evidenced by Ofsted’s recent decision to strengthen the attention given to the attainment and progress of what they call ‘the most able’ in all school inspection reports.

L6 tests: Key Performance Data

Entry and success rates

As noted above, the information in the public domain about entry rates to L6 tests is incomplete.

The 2013 Investigation provides the number of pupils entered for each test in 2012. We do not have comparable data for 2013, but a PQ reply does supply the number of pupils registered for the tests in both 2012 and 2013. This can be supplemented by material in the 2013 SFR and the corresponding 2012 publication.

The available data is synthesised in this table showing for each year – and where available – the number registered for each test, the number entered, the total number of pupils achieving L6 and, of those, the number attending state-funded schools.

                    2012                   2013
Reg Ent Pass PassSF Reg Ent Pass Pass SF
Reading 47,148 46,810 942 x 73,118 x 2,262 2,137
GPS x x x x 61,883 x 8,606 x
Maths 55,809 55,212 18,953 x 80,925 x 35,137 33,202

One can see that there are relatively small differences between the numbers of pupils registered and the number entered, so the former is a decent enough proxy for the latter. I shall use the former in the calculations immediately below.

It is also evident that the proportions of learners attending independent schools who achieve L6 are small though significant. But, given the incomplete data set for state-funded schools, I shall use the pass rate for all schools in the following calculations.

In sum then, in 2012, the pass rates per registered entry were:

  • Reading – 2.0%
  • Maths – 34.0%

And in 2013 they were:

  • Reading – 3.1%
  • GPS – 13.9%
  • Maths – 43.4%

The pass rates in 2013 have improved significantly in both reading and maths, the former from a very low base. However, the proportion of learners successful in the L6 reading test remains extremely small.

The 2013 Investigation asserted, on the basis of the 2012 results, that:

‘The cost of supporting and administering a test for such a small proportion of the school population appears to outweigh the benefits’

However it did not publish any information about that cost.

It went on to suggest that there is a case for reviewing whether the L6 test is the most appropriate means to  ‘identify a range of higher performing pupils, for example the top 10%’. The Government chose not to act on this suggestion.

Gender, ethnic background and disadvantage

The 2013 results demonstrate some very significant gender disparities, as revealed in Chart 1 below.

Girls account for 62% of successful pupils in GPS and a whopping 74% in reading, while boys account for 61% of successful pupils in maths. These imbalances raise important questions about whether gender differences in high attainment are really this pronounced, or whether there is significant underachievement amongst the under-represented gender in each case.

Chart 1: Number of pupils successful in 2013 L6 tests by gender

L6 chart 1

There are equally significant disparities in performance by ethnic background. Chart 2 below illustrates how the performance of three selected ethnic minority groups – white, Asian and Chinese – varies by test and gender.

It shows that pupils from Chinese backgrounds have a marked ascendancy in all three tests, while Asian pupils are ahead of white pupils in GPS and maths but not reading. Girls are ahead of boys within all three ethnic groups, girls leading in reading and GPS and boys leading in maths. Chinese girls comfortably out-perform white and Asian boys

Chinese pupils are way ahead in maths, with 29% overall achieving L6 and an astonishing 35% of Chinese boys achieving this outcome.

The reasons for this vast disparity are not explained and raise equally awkward questions about the distribution of high attainment and the incidence of underachievement.


Chart 2: Percentages of pupils successful in 2013 L6 tests by gender and selected ethnic background

L6 chart2

There are also significant excellence gaps on each of the tests, though these are hard to visualise when working solely with percentages (pupil numbers have not been published).

The percentage variations are shown in the table below. This sets out the FSM gap and the disadvantaged gap, the latter being based on the ever-6 FSM measure that underpins the Pupil Premium.

These figures suggest that, while learners eligible for the Pupil Premium are demonstrating success on the maths test (and, for girls at least, on the GPS test too), they are over three times less likely to be successful than those from advantaged backgrounds. The impact of the Pupil Premium is therefore limited.

The gap between the two groups reaches as high as 7% for boys in maths. Although this is low by comparison with the corresponding gap at level 4, it is nonetheless significant. There is more about excellence gaps in maths below.


Reading GPS        Maths   
G B G B G B
FSM 0 0 1 0 2 3
Non-FSM 1 0 2 1 6 9
Gap 1 0 1 1 4 6
 
Dis 0 0 1 0 2 3
Non-Dis 1 0 3 2 7 10
Gap 1 0 2 2 5 7

Schools achieving L6 success

Finally in this opening section, a comparison of schools achieving L6 success in the 2013 Primary School Performance Tables reveals different patterns for each test.

The table below shows how many schools secured different percentages of pupils at L6. The number of schools achieving 11-20% at L6 in the GPS test is over 20 times the number that achieved that outcome in reading. But over eight times more schools secured this outcome in maths than managed it in GPS.

No schools made it beyond 20% at L6 in reading and none pushed beyond 40% at L6 in GPS, but the outliers in maths managed well over 60% and even 70% returns.

11-20% 21-30% 31-40% 41-50% 51-60% 61-70% 71-80% Total
Reading 24 24
GPS 298 22 2 322
Maths 2521 531 106 25 0 1 2 3186

There is also some evidence of schools being successful in more than one test.

Amongst the small sample of 28 schools that secured 41% or more L6s in maths,  two also featured amongst the top 24 performers in reading and five amongst the top 24 performers in GSP.

The school with arguably the best record across all three tests is Christ Church Primary School in Hampstead, which secured 13% in reading, 21% in GPS and 46% in maths, from a KS2 cohort of 24. The FSM/Pupil Premium rates at the school are low but, nevertheless, this is an outstanding result.

The following sections look more closely at L6 test and teacher assessment results in each subject. Each section consists of a series of bullet points highlighting significant findings.

English


Reading Test

The evidence on performance on the L6 reading test is compromised to some extent by the tiny proportions of pupils that achieve it. However:

  • 9,605 schools registered pupils for the 2013 L6 reading test, up 48% from 6,469 in 2012, and the number of pupils registered increased from 47,148 in 2012 to 73,118 in 2013, an increase of 55%.
  • Of the 539,473 learners who undertook the 2013 KS2 reading tests, only 2,262 (about 0.42%) achieved L6. This figure includes some in independent schools; the comparable figure for state-funded schools only is 2,137, so 5.5% of L6s were secured in the independent sector.
  • Of this first total – ie including pupils from independent schools – 1,670 were girls (0.63% of all girls who undertook the KS2 reading tests) and 592 were boys (0.21% of all boys who undertook the KS2 reading tests).
  • These are significant improvements on the comparable 2012 figures which showed about 900 learners achieving L6, including 700 girls and 200 boys. (The figures were rounded in the SFR but the 2013 evaluation confirmed the actual number as 942). The overall percentage achieving L6 therefore increased by about 140% in 2013, compared with 2012. If we assume registration for L6 tests as a proxy for entry, this suggests that just over 3% of entrants passed in 2013.
  • In state-funded schools only, the percentage of learners from a Chinese background entered for KS2 reading tests who achieved L6 reaches 2%, compared with 1% for those of mixed background and 0% for learners from white, Asian and black backgrounds.
  • Amongst the defined sub-groups, learners of Irish, any other white, white and Asian and any other Asian backgrounds also make it to 1%. All the remainder are at 0%.
  • The same is true of EAL learners and native English speakers, FSM-eligible and disadvantaged learners, making worthwhile comparisons almost impossible.
  • The 2013 transition matrices show that 12% of learners who had achieved L4 at the end of KS1 went on to achieve L6, while 1% of those who had achieved L3 did so. Hence the vast majority of those at L4 in KS1 did not make two levels of progress.
  • Progression data in the SFR shows that, of the 2,137 learners achieving L6 in state funded schools, 2,047 were at L3 or above at KS1, 77 were at L2A, 10 were at L2B and 3 were at L2C. Of the total population at KS1 L3 or above, 1.8% progressed to L6.
  • Regional and local authority breakdowns are given only as percentages, of limited value for comparative purposes because they are so small. Only London and the South East record 1% at L6 overall, with all the remaining regions at 0%. Only one local authority – Richmond upon Thames – reaches 2%.
  • However 1% of girls reach L6 in all regions apart from Yorkshire and Humberside and a few more authorities record 2% of girls at L6: Camden, Hammersmith and Fulham, Kensington and Chelsea, Kingston, Richmond and Solihull.
  • The 2013 Primary School Performance Tables show that some 12,700 schools recorded no learners achieving L6.
  • At the other end of the spectrum, 36 schools recorded 10% or more of their KS2 cohort achieving L6. Four of these recorded 15% or higher:

Iford and Kingston C of E Primary School, East Sussex (19%; cohort of 21).

Emmanuel C of E Primary School, Camden (17%; cohort of 12).

Goosnargh Whitechapel Primary School, Lancashire (17%; cohort of 6).

High Beech  C of E VC Primary School, Essex (15%; cohort of 13).

Reading TA

There is relatively little data about teacher assessment outcomes.

  • The total number of pupils in all schools achieving L6 in reading TA in 2013 is 15,864 from a cohort of 539,729 (2.94%). This is over seven times as many as achieved L6 in the comparable test (whereas in maths the figures are very similar). It would be useful to know how many pupils achieved L6 in TA, were entered for the test and did not succeed.
  • The number of successful girls is 10,166 (3.85% of females assessed) and the number of boys achieving L6 is 5,698 (2.06% of males assessed). Hence the gap between girls and boys is far narrower on TA than it is on the corresponding test.
  • Within the 2013 Performance Tables, eight schools recorded 50% or more of their pupils at L6, the top performer being Peppard Church of England Primary School, Oxfordshire, which reached 83% (five from a cohort of six).


Writing (including GPS)


GPS Test

The L6 Grammar, Punctuation and Spelling (GPS) test was newly introduced in 2013. This is what we know from the published data:

  • The number of schools that registered for the test was 7,870, almost 2,000 fewer than registered for the reading test. The number of pupil registrations was 61,883, over 12,000 fewer than for reading.
  • The total number of successful learners is 8,606, from a total of 539,438 learners assessed at KS2, including those in independent schools taking the tests, giving an actual percentage of 1.6%. As far as I can establish, a comparable figure for state-funded schools is not available.
  • As with reading, there are significant differences between boys and girls. There were 5,373 successful girls (2.04% of girls entered for KS2 GPS tests) and 3,233 successful boys (1.17% of boys entered for KS2 GPS). This imbalance in favour of girls is significant, but not nearly as pronounced as in the reading test.
  • The proportion of pupil registrations for the L6 GPS test resulting in L6 success is around one in seven (13.9%) well over four times as high as for reading.
  • The ethnic breakdown in state-funded schools shows that Chinese learners are again in the ascendancy. Overall, 7% of pupils from a Chinese background achieved L6, compared with 1% white, 2% mixed, 2% Asian and 1% black.
  • Chart 3 below shows how L6 achievement in GPS varies between ethnic sub-groups. Indian pupils reach 4% while white and Asian pupils score 3%, as do pupils from any other Asian background.

Chart 3: 2013 GPS L6 performance by ethnic sub-groups

L6 chart 3

  • When gender differences are taken into account, Chinese girls are at 8% (compared with boys at 7%), ahead of Indian girls at 5% (boys 3%), white and Asian girls at 4% (boys 3%) and any other Asian girls also at 4% (boys 3%). The ascendancy of Chinese girls over boys from any other ethnic background is particularly noteworthy and replicates the situation in maths (see below).
  • Interestingly, EAL learners and learners with English as a native language both record 2% at L6. Although these figures are rounded, it suggests that exceptional performance in this aspect of English does not correlate with being a native speaker.
  • FSM-eligible learners register 0%, compared with 2% for those not eligible. However, disadvantaged learners are at 1% and non-disadvantaged 2% (Disadvantaged boys are at 0% and non-disadvantaged girls at 3%). Without knowing the numbers involved we can draw few reliable conclusions from this data.
  • Chart 4 below gives illustrates the regional breakdown for boys, girls and both genders. At regional level, London reaches 3% success overall, with both the South East and Eastern regions at 2% and all other regions at 1%. Girls record 2% in every region apart from the North West and Yorkshire and Humberside. Only in London do boys reach 2%.


Chart 4: 2013 L6 GPS outcomes by gender and region

L6 chart 4

  • At local authority level the highest scoring are Richmond (7%); the Isles of Scilly (6%); Kingston and Sutton (5%); and Harrow, Hillingdon and Wokingham (4%).
  • The School Performance Tables reveal that some 10,200 schools posted no L6 results while, at the other extreme, 34 schools recorded 20% or more of their KS2 cohort at L6 and 463 schools managed 10% or above. The best records were achieved by:

St Joseph’s Catholic Primary School, Southwark (38%; cohort of 24).

The Vineyard School, Richmond  (38%; cohort of 56).

Cartmel C of E Primary School,  (29%; cohort of 7) and

Greystoke School, (29%; cohort of 7).

Writing TA

When it comes to teacher assessment:

  • 8,410 learners from both state and independent schools out of a total of 539,732 assessed (1.56%) were judged to be at L6 in writing. The total figure for state-funded schools is 7,877 pupils. This is very close to the number successful in the L6 GPS test, even though the focus is somewhat different.
  • Of these, 5,549 are girls (2.1% of the total cohort) and 2,861 boys (1.04% of the total cohort). Hence the imbalance in favour of girls is more pronounced in writing TA than in the GPS test, whereas the reverse is true for reading. 
  • About 5% of learners from Chinese backgrounds achieve L6, as do 3% of white Asian and 3% of Irish pupils.
  • The 2013 transition matrices record progression in writing TA, rather than in the GSP test. They show that 61% of those assessed at L4 at KS1 go on to achieve L6, so only 6 out of 10 are making the expected minimum two levels of progress. On the other hand, some 9% of those with KS1 L3 go on to achieve L6, as do 2% of those at L2A.
  • The SFR provides further progression data – again based on the TA outcomes – for state-funded schools only. It shows us that one pupil working towards L1 at KS1 went on to achieve L6 at KS2, as did 11 at L1, 54 at L2C, 393 at L2B, 1,724 at L2A and 5,694 at L3 or above. Hence some pupils are making five or more levels of progress.
  • The regional breakdown – this time including independent schools – gives the East Midlands, West Midlands, London and the South West at 2%, with all the rest at 1%. At local authority level, the best performers are: City of London at 10%; Greenwich, Kensington and Chelsea and Richmond at 5% and Windsor and Maidenhead at 4%.

English TA

There is additionally a little information about pupils achieving L6 across the subject:

  • The SFR confirms that 8,087 pupils (1.5%) were assessed at L6 in English, including 5,244 girls (1.99% of all girls entered) and 2,843 boys (1.03% of all boys entered). These figures are for all schools, including independent schools.
  • There is a regional breakdown showing the East and West Midlands, London and the South West at 2%, with all the remainder at 1%. Amongst local authorities, the strongest performers are City of London (10%); and Bristol, Greenwich, Hackney, Richmond, Windsor and Maidenhead (4%). The exceptional performance of Bristol, Greenwich and Hackney is noteworthy.
  • In the Performance Tables, 27 schools record 30% or more pupils at L6 across English, the top performer again being Newton Farm, at 60%.

Maths

L6 performance in maths is more common than in other tests and subjects and the higher percentages generated typically result in more meaningful comparisons.

  • The number of school registrations for L6 maths in 2013 was 11,369, up almost 40% from 8,130 in 2012. The number of pupil registrations was 80,925, up some 45% from 55,809 in 2012.
  • The number of successful pupils – in both independent and state schools – was 35,137 (6.51% of all entrants). The gender imbalance in reading and GPS is reversed, with 21,388 boys at this level (7.75% of males entered for the overall KS2 test) compared with 13,749 girls (5.22% of females entered for the test). The SFR gives a total for state-funded schools of 33,202 pupils, so some 5.5% of Level 6s were achieved in independent schools.
  • Compared with 2012, the numbers of successful pupils has increased from 18,953. This represents an increase of 85%, not as huge as the increase for reading but a very substantial increase nevertheless. 
  • The number of successful girls has risen by some 108% from 6,600 (rounded) and the number of successful boys by about 72%, from 12,400 (rounded), so the improvement in girls’ success is markedly larger than the corresponding improvement for boys.  
  • Assuming L6 test registration as a proxy for entry, the success rate in 2013 is around 43.4%, massively better than for reading (3%) and GPS (13.9%). The corresponding success rate in 2012 was around 34%. (Slightly different results would be obtained if one used actual entry rates and passes for state schools only, but we do not have these figures for both years.)
  • The breakdown in state-funded schools for the main ethnic groups by gender is illustrated by Chart 5 below. This shows how performance by boys and girls varies according to whether they are white ( W), mixed (M), Asian (A), black (B) or Chinese (C). It also compares the outcomes in 2012 and 2013. The superior performance of Chinese learners is evident, with Chinese boys reaching a staggering 35% success rate in 2013. As things stand, Chinese boys are almost nine times more likely to achieve L6 than black girls.
  • Chart 5 also shows that none of the gender or ethnic patterns has changed between 2012 and 2013, but some groups are making faster progress, albeit from a low base. This is especially true of white girls, black boys and, to a slightly lesser extent, Asian girls.
  • Chinese girls and boys have improved at roughly the same rate and black boys have progressed faster than black girls but, in the remaining three groups, girls are improving at a faster rate than boys.

Chart 5: L6 Maths test by main ethnic groups and gender

L6 chart 5

  • Amongst sub-groups, not included on this table, the highest performing are: any other Asian background 15%, Indian 14%, white and Asian 11% and Irish 10%. Figures for Gypsy/Roma and any other white background are suppressed, while travellers of Irish heritage are at 0%, black Caribbean at 2% and any other black background at 3%. In these latter cases, the differential with Chinese performance is huge.
  • EAL learners record a 7% success rate, compared with 6% for native English language speakers, an improvement on the level pegging recorded for GPS. This gap widens to 2% for boys – 9% versus 7% in favour of EAL, whereas for girls it is 1% – 6% versus 5% in favour of EAL. The advantage enjoyed by EAL learners was also evident in 2012.
  • The table below shows the position for FSM and disadvantaged learners by gender, and how this has changed since 2012.
FSM boys Non FSM boys Gap Dis boys Non dis boys Gap
2012 1% 5% 4% 1% 6% 5%
2013 3% 9% 6% 3% 10% 7%
FSM girls Non FSM girls Gap Dis girls Non dis girls Gap
2012 1% 3% 2% 1% 3% 2%
2013 2% 6% 4% 2% 7% 5%
FSM all Non FSM all Gap Dis all Non dis all Gap
2012 1% 4% 3% 1% 4% 3%
2013 2% 7% 5% 2% 8% 6%
  • This shows that the gap between FSM and non-FSM and between disadvantaged and non-disadvantaged has grown – for boys, girls and the groups as a whole – between 2012 and 2013. All the gaps have increased by 2% or 3%, with higher gaps between disadvantaged and advantaged girls and for disadvantaged boys and girls together, compared with their more advantaged peers.
  • The gaps are all between 2% and 7%, so not large compared with those lower down the attainment spectrum, but the fact that they are widening is a significant cause for concern, suggesting that Pupil Premium funding is not having an impact at L6 in maths.
  • The Transition Matrices show that 89% of learners assessed at L4 in KS1 went on to achieve L6, while 26% of those with L3 at KS1 did so, as did 4% of those with L2A and 1% of those with L2B. Hence a noticeable minority is making four levels of progress.
  • The progression data in the SFR, relating to state-funded schools, show that one pupil made it from W at KS1 to L6, while 8 had L1, 82 had 2C, 751 had 2B, 4,983 had 2A and 27,377 had L3. Once again, a small minority of learners is making four or five levels of progress.
  • At regional level, the breakdown is: NE 6%, NW 6%, Y+H 5%, EM 6%, WM 6%, E 6%, London 9%, SE 7% and SW 6%. So London has a clear lead in respect of the proportion of its learners achieving L6.
  • The local authorities leading the rankings are: City of London 24%, Richmond 19%, Isles of Scilly 17%, Harrow and Kingston 15%, Trafford and Sutton 14%. No real surprises there!
  • The Performance Tables show 33 schools achieved 40% or higher on this measure. Eight schools were at 50% or above. The best performing schools were:

St Oswald’s C of E Aided Primary School, Cheshire West and Chester (75%; cohort 8)

St Joseph’s Roman Catholic Primary School, Hurst Green, Lancashire (71%; cohort 7)

Haselor School, Warwickshire (67%; cohort 6).

  • Some of the schools achieving 50% were significantly larger, notably Bowdon C of E Primary School, Trafford, which had a KS2 cohort of 60.

Maths TA

The data available on maths TA is more limited:

  • Including pupils at independent schools, a total of 33,668 were assessed at L6 in maths (6.24% of all KS2 candidates). This included 20,336 boys (7.37% of all male KS2 candidates) and 13,332 girls (5.06% of all female candidates). The number achieving L6 maths TA is slightly lower than the corresponding number achieving L6 in the test.
  • The regional breakdown was as follows: NE 5%; NW 5%; Y+H 5%; EM 5%, WM 6%; E 6%, London 8%; SE 7%, SW 6%, so London’s ascendancy is not as significant as in the test. 
  • The strongest local authority performers are: City of London 24%; Harrow and Richmond 15%; Sutton 14%; Trafford 13%; Solihull and Bromley 12%.
  • In the Performance Tables, 63 schools recorded 40% or higher on this measure, 15 of them at 50% or higher. The top performer was St Oswald’s C of E Aided Primary School (see above) with 88%.

Science

Science data is confined to teacher assessment outcomes.

  • A total of just 1,633 pupils achieved L6 in 2013, equivalent to 0.3% of the KS2 science cohort. Of these, 1,029 were boys (0.37%) and 604 were girls (0.23%), suggesting a gender imbalance broadly similar to that in maths.
  • No regions and only a handful of local authorities recorded a success rate of 1%.
  • In the Performance Tables, 31 schools managed 20% or higher and seven schools were above 30%. The best performing were:

Newton Farm (see above) (50%; cohort 30)

Hunsdon Junior Mixed and Infant School, Hertfordshire (40%; cohort 10)

Etchingham Church of England Primary School, East Sussex (38%; cohort 16)

St Benedict’s Roman Catholic Primary School Ampleforth, North Yorkshire (36%; cohort 14).

Conclusions


Key findings from this data analysis

I will not repeat again all of the significant points highlighted above, but these seem particularly worthy of attention and further analysis:

  • The huge variation in success rates for the three L6 tests. The proportion of learners achieving L6 in the reading test is improving at a faster rate than in maths, but from a very low base. It remains unacceptably low, is significantly out of kilter with the TA results for L6 reading and – unless there has been a major improvement in 2014 – is likely to stay depressed for the limited remaining lifetime of the test.
  • In the tests, 74% of those successful in reading are girls, 62% of those successful in GPS are girls and 61% of those successful in maths are boys. In reading there are also interesting disparities between gender distribution at L6 in the test and in teacher assessment. Can these differences be attributed solely to gender distinctions or is there significant gender-related underachievement at the top of the attainment distribution? If so, how can this be addressed? 
  • There are also big variations in performance by ethnic background. Chinese learners in particular are hugely successful, especially in maths. In 2013, Chinese girls outscored significantly boys from all other backgrounds, while an astonishing 35% of Chinese boys achieved L6. This raises important questions about the distribution of high attainment, the incidence of underachievement and how the interaction between gender and ethnic background impacts on these.
  • There are almost certainly significant excellence gaps in performance on all three tests (ie between advantaged and disadvantaged learners), though in reading and GPS these are masked by the absence of numerical data. In maths we can see that the gaps are not as large as those lower down the attainment spectrum, but they widened significantly in 2013 compared with 2012. This suggests that the impact of the Pupil Premium on the performance of the highest attainers from disadvantaged backgrounds is extremely limited.  What can and should be done to address this issue?
  • EAL learners perform equally as well as their counterparts in the GPS test and even better in maths. This raises interesting questions about the relationship between language acquisition and mathematical performance and, even more intriguingly, the relationship between language acquisition and skill in manipulating language in its written form. Further analysis of why EAL learners are so successful may provide helpful clues that would improve L6 teaching for all learners.
  • Schools are recording very different success rates in each of the tests. Some schools that secure very high L6 success rates in one test fail to do so in the others, but a handful of schools are strong performers across all three tests. We should know more than we do about the characteristics and practices of these highly successful schools.

Significant gaps in the data

A data portal to underpin the School Performance Tables is under construction. There have been indications that it will contain material about high attainers’ performance but, while levels continue to be used in the Tables, this should include comprehensive coverage of L6 performance, as well as addressing the achievement of high attainers as they are defined for Performance Table purposes (a much broader subset of learners).

Subject to the need to suppress small numbers for data protection purposes, the portal might reasonably include, in addition to the data currently available:

  • For each test and TA, numbers of registrations, entries and successful pupils from FSM and disadvantaged backgrounds respectively, including analysis by gender and ethnic background, both separately and combined. All the data below should also be available for these subsets of the population.
  • Registrations and entries for each L6 test, for every year in which the tests have been administered, showing separately rates for state-funded and all schools and rates for different types of state-funded school.
  • Cross-referencing of L6 test and TA performance, to show how many learners are successful in one, the other and both – as well as how many learners achieve L6 on more than one test and/or TA and different combinations of assessments.
  • Numbers of pupils successful in each test and TA by region and LA, as well as regional breakdowns of the data above and below.
  • Trends in this data across all the years in which the tests and TA have been administered.
  • The annual cost of developing and administering each of the L6 tests so we can make a judgement about value for money.

It would also be helpful to produce case studies of schools that are especially successful in maximising L6 performance, especially for under-represented groups.


The impact of the new tests pre- and post-2016

We do not yet know whether the announcement that L6 tests will disappear after 2015 has depressed registration, entry and success rates in 2014. This is more likely in 2015, since the 2014 registration deadline and the response to the primary assessment and accountability consultation were broadly co-terminous.

All the signs are that the accountability regime will continue to focus some attention on the performance of high attainers:

  • Ofsted is placing renewed emphasis on the attainment and progress of the ‘most able’ in school inspection, though they have a broad conceptualisation of that term and may not necessarily highlight L6 achievement.
  • From 2016, schools will be required to publish ‘the percentage of pupils who achieve a high score in all areas at the end of key stage 2.’ But we do not know whether this means publishing separately the percentage of pupils achieving high scores in each area, or only the percentage of pupils achieving high scores across all areas. Nor do we know what will count as a high score for these purposes.
  • There were commitments in the original primary assessment and accountability consultation document to inclusion of measures in the Primary Performance Tables setting out:

‘How many of a school’s pupils are amongst the highest attaining nationally, by showing the percentage of pupils achieving a high scaled score in each subject.’

but these were not repeated in the consultation response.

In short, there are several unanswered questions and some cause to doubt the extent to which Level 6-equivalent performance will continue to be a priority. The removal of L6 tests could therefore reduce significantly the attention primary schools give to their highest attainers.

Moreover, questions remain over the suitability of the new tests for these highest attainers. These may possibly be overcome but there is considerable cause for concern.

It is quite conceivable that the test developers will not be able to accommodate effective assessment of L6 performance within single tests as planned.

If that is the case, the Government faces a choice between perpetuating separate tests, or the effective relegation of the assessment of the highest attainers to teacher assessment alone.

Such a decision would almost certainly need to be taken on this side of a General Election. But of course it need not be binding on the successor administration. Labour has made no commitments about support for high attainers, which suggests they will not be a priority for them should they form the next Government.

The recently published Assessment Principles are intended to underpin effective assessment systems within schools. They state that such systems:

‘Differentiate attainment between pupils of different abilities, giving early recognition of pupils who are falling behind and those who are excelling.’

This lends welcome support to the recommendations I offered to NAHT’s Commission on Assessment

But the national system for assessment and accountability has an equally strong responsibility to differentiate throughout the attainment spectrum and to recognise the achievement of those who excel.

As things stand, there must be some doubt whether it will do so.

Postscript

On 19 May 2014 two newspapers helpfully provided the entry figures for the 2014 L6 tests. These are included in the chart below.

L6 postscript chart

It is clear that entries to all three tests held up well in 2014 and, as predicted, numbers have not yet been depressed as a consequence of the decision to drop L6 tests after 2015.

The corresponding figures for the numbers of schools entering learners for each test have not been released, so we do not know to what extent the increase is driven by new schools signing up, as opposed to schools with previous entries increasing the numbers they enter.

This additional information makes it easier to project approximate trends into 2015, so we shall be able to tell next year whether the change of assessment policy will cause entry rates to tail off.

  • Entries for the L6 reading test were 49% up in 2013 and 36% up in 2014. Assuming the rate of increase in 2015 falls to 23% (ie again 13% down on the previous year), there would be some 117,000 entries in 2015.
  • Entries for the L6 maths test were 41% up in 2013 and 36% up in 2014. Assuming the rate of increase in 2015 falls to 31% (ie again 5% down on the previous year), there would be around 139,000 entries in 2015.
  • GPS is more problematic because we have only two years on which to base the trend. If we assume that the rate of increase in entries will fall somewhere between the rate for maths and the rate for reading in 2014 (their second year of operation) there would be somewhere between 126,000 and 133,000 entries in 2015 – so approximately 130,000 entries.

It is almost certainly a projection too far to estimate the 2014 pass rates on the basis of the 2014 entry rates, so I will resist the temptation. Nevertheless, we ought to expect continued improvement at broadly commensurate rates.

The press stories include a Government ‘line to take’ on the L6 tests.

In the Telegraph, this is:

‘Want to see every school stretching all their pupils and these figures show that primary schools have embraced the opportunity to stretch their brightest 11-year-olds.’

‘This is part of a package of measures – along with toughening up existing primary school tests, raising the bar and introducing higher floor standards – that will raise standards and help ensure all children arrive at secondary school ready to thrive.’

In the Mail it is:

‘We brought back these tests because we wanted to give teachers the chance to set high aspirations for pupils in literacy and numeracy.’

‘We want to see every school stretching all their pupils. These figures show that primary schools have embraced the opportunity to stretch their brightest 11-year-olds by  teaching them more demanding new material, in line with the new curriculum, and by entering them for the Level 6 test.’

There is additionally confirmation in the Telegraph article that ‘challenging material currently seen in the level 6 exams would be incorporated into all SATs tests’ when the new universal assessments are introduced, but nothing about the test development difficulties that this presents.

But each piece attributed this welcome statement to Mr Gove:

‘It is plain wrong to set a ceiling on the talents of the very brightest pupils and let them drift in class.’

‘Letting teachers offer level 6 tests means that the most talented children will be fully stretched and start secondary school razor sharp.’

Can we read into that a commitment to ensure that the new system – including curriculum, assessment, qualifications, accountability and (critically) Pupil Premium support for the disadvantaged – is designed in a joined up fashion to meet the needs of ‘the very brightest pupils’?

I wonder if Mr Hunt feels able to follow suit.

GP

May 2014

Air on the ‘G’ String: Hoagies’ Bloghop, May 2014


medium_17873944As I see it, there are three sets of issues with the ‘G’ word:

  • Terminological – the term carries with it associations that make some advocates uncomfortable and predispose others to resist such advocacy.
  • Definitional – there are many different ways to define the term and the subset of the population to which it can be applied; there is much disagreement about this, even amongst advocates.
  • Labelling – the application of the term to individuals can have unintended negative consequences, for them and for others.


Terminological issues

We need shared terminology to communicate effectively about this topic. A huge range of alternatives is available: able, more able, highly able, most able, talented, asynchronous, high potential, high learning potential… and so on.

These terms – the ‘g’ word in particular – are often qualified by an adjective – profoundly, highly, exceptionally – which adds a further layer of complexity. Then there is the vexed question of dual and multiple exceptionality…

Those of us who are native English speakers conveniently forget that there are also numerous terms available in other languages: surdoue, hochbegabung, hochbegaabte, altas capacidades, superdotados, altas habilidades, evnerik and many, many more!

Each of these terms has its own good and bad points, its positive and negative associations.

The ‘g’ word has a long history, is part of the lingua franca and is still most widely used. But its long ascendancy has garnered a richer mix of associations than some of the alternatives.

The negative associations can be unhelpful to those seeking to persuade others to respond positively and effectively to the needs of these children and young people. Some advocates feel uncomfortable using the term and this hampers effective communication, both within the community and outside it.

Some react negatively to its exclusive, elitist connotations; on the other hand, it can be used in a positive way to boost confidence and self-esteem.

But, ultimately, the term we use is less significant than the way in which we define it. There may be some vague generic distaste for the ‘g’ word, but logic should dictate that most reactions will depend predominantly on the meaning that is applied to the term.


Definitional issues

My very first blog post drew attention to the very different ways in which this topic is approached around the world. I identified three key polarities:

  • Nature versus nurture – the perceived predominance of inherited disposition over effort and practice, or vice versa.
  • Excellence versus equity – whether priority is given to raising absolute standards and meritocracy or narrowing excellence gaps and social mobility.
  • Special needs versus personalisation – whether the condition or state defined by the term should be addressed educationally as a special need, or through mainstream provision via differentiation and tailored support.

These definitional positions may be associated with the perceived pitch or incidence of the ‘g’ condition. When those at the extreme of the distribution are under discussion, or the condition is perceived to be extremely rare, a nature-excellence-special needs perspective is more likely to predominate. A broader conceptualisation pushes one towards the nurture-equity-personalisation nexus.

Those with a more inclusive notion of ‘g’-ness – who do not distinguish between ‘bright’ and ‘g’, include all high attainers amongst the latter and are focused on the belief that ‘g’-ness is evenly distributed in the population by gender, ethnic and socio-economic background – are much more likely to hold the latter perspective, or at least tend towards it.

There are also differences according to whether the focus is the condition itself – ‘g’-ness – or schooling for the learners to whom the term is applied – ‘g’ education. In the first case, nature, excellence and special needs tend to predominate; in the second the reverse is true. This can compromise interaction between parents and educators.

In my experience, if the ‘g’ word is qualified by a careful definition that takes account of these three polarities, a mature discussion about needs and how best to meet them is much more likely to occur.

In the absence of a shared definition, the associations of the term will likely predominate unchecked. Effective communication will be impossible; common ground cannot be established; the needs that the advocate is pressing will remain unfulfilled. That is in no-one’s best interests, least of all those who are ‘g’.


Labelling Issues 

When the ‘g’ word is applied to an individual, it is likely to influence how that individual perceives himself and how others perceive him.

Labelling is normally regarded as negative, because it implies a fixed and immutable state and may subject the bearers of the label to impossibly high expectations, whether of behaviour or achievement, that they cannot always fulfil.

Those who do not carry the label may see themselves as second class citizens, become demotivated and much less likely to succeed.

But, as noted above, it is also possible to use the ‘g’ label to confer much-needed status and attention on those who do not possess the former or receive enough of the latter. This can boost confidence and self-esteem, making the owners of the label more likely to conform to the expectations that it carries.

This is particularly valuable for those who strive to promote equity and narrow excellence gaps between those from advantaged and disadvantaged backgrounds.

Moreover, much depends on whether the label is permanently applied or confers a temporary status.

I recently published a Twitter conversation explaining how the ‘g’ label can be used as a marker to identify those learners who for the time being need additional learning support to maximise their already high achievement.

This approach reflects the fact that children and young people do not develop through a consistent linear process, but experience periods of rapid development and comparative stasis.

The timing and duration of these periods will vary so, at any one time in any group of such individuals, some will be progressing rapidly and others will not. Over the longer term some will prove precocious; others late developers.

This is not to deny that a few learners at the extreme of the distribution will retain the marker throughout their education, because they are consistently far ahead of their peers and so need permanent additional support to maximise their achievement.

But, critically, the label is earned through evidence of high achievement rather than through a test of intelligence or cognitive ability that might have been administered once only and in the distant past. ‘G’-ness depends on educational success. It also forces educators to address underachievement at the top of the attainment spectrum.

If a label is more typically used as a temporary marker it must be deployed sensitively, in a way that is clearly understood by learners and their parents. They must appreciate that the removal of the marker is not a punishment or downgrading that leads to loss of self-esteem.

Because the ‘g’ label typically denotes a non-permanent state that defines need rather than expectation, most if not all of the negative connotations can be avoided.

Nevertheless, this may be anathema to those with a nature-excellence-special needs perspective!


Conclusion 

I have avoided using the ‘g’ word within this post, partly to see if it could be done and partly out of respect for those of you who dislike it so much.

But I have also advanced some provocative arguments using terminology that some of you will find equally disturbing. That is deliberate and designed to make you think!

The ‘g’ word has substantial downside, but this can be minimised through careful definition and the application of the label as a non-permanent marker.

It may be that the residual negative associations are such that an alternative is still preferable. The question then arises whether there is a better term with the same currency and none of the negative connotations.

As noted above there are many contenders – not all of them part of the English language – but none stands head-and-shoulders above its competitors.

And of course it is simply impossible to ban a word. Indeed, any attempt to do so would provoke many of us – me included – to use the ‘g’ word even more frequently and with much stronger conviction.


Hoagies bloghop


This blog is part of the Hoagies’ Gifted Education Page inaugural Blog Hop on The “G” Word (“Gifted”).  To read more blogs in this hop, visit this Blog Hop at www.hoagiesgifted.org/blog_hop_the_g_word.htm


GP

May 2014


photo credit: <a href=”http://www.flickr.com/photos/neurollero/17873944/”>neurollero</a&gt; via <a href=”http://photopin.com”>photopin</a&gt; <a href=”http://creativecommons.org/licenses/by-sa/2.0/”>cc</a&gt;

How well is Ofsted reporting on the most able?


This post considers how Ofsted’s new emphasis on the attainment and progress of the most able learners is reflected in school inspection reports.

My analysis is based on the 87 Section 5 secondary school inspection reports published in the month of March 2014.

keep-calm-and-prepare-for-ofsted-6I shall not repeat here previous coverage of how Ofsted’s emphasis on the most able has been framed. Interested readers may wish to refer to previous posts for details:

The more specific purpose of the post is to explore how consistently Ofsted inspectors are applying their guidance and, in particular, whether there is substance for some of the concerns I expressed in these earlier posts, drawn together in the next section.

The remainder of the post provides an analysis of the sample and a qualitative review of the material about the most able (and analogous terms) included in the sample of 87 inspection reports.

It concludes with a summary of the key points, a set of associated recommendations and an overall inspection grade for inspectors’ performance to date. Here is a link to this final section for those who prefer to skip the substance of the post.


Background

Before embarking on the real substance of this argument I need to restate briefly some of the key issues raised in those earlier posts:

  • Ofsted’s definition of ‘the most able’ in its 2013 survey report is idiosyncratically broad, including around half of all learners on the basis of their KS2 outcomes.
  • The evidence base for this survey report included material suggesting that the most able students are supported well or better in only 20% of lessons – and are not making the progress of which they are capable in about 40% of schools.
  • The survey report’s recommendations included three commitments on Ofsted’s part. It would:

 o   ‘focus more closely in its inspections on the teaching and progress of the most able students, the curriculum available to them, and the information, advice and guidance provided to the most able students’;

o   ‘consider in more detail during inspection how well the pupil premium is used to support the most able students from disadvantaged backgrounds’ and

o   ‘report its inspection findings about this group of students more clearly in school inspection, sixth form and college reports.’

  • Subsequently the school inspection guidance was revised somewhat  haphazardly, resulting in the parallel use of several undefined terms (‘able pupils’, ‘most able’, ‘high attaining’, ‘highest attaining’),  the underplaying of the attainment and progress of the most able learners attracting the Pupil Premium and very limited reference to appropriate curriculum and IAG.
  • Within the inspection guidance, emphasis was placed primarily on learning and progress. I edited together the two relevant sets of level descriptors in the guidance to provide this summary for the four different inspection categories:

In outstanding schools the most able pupils’ learning is consistently good or better and they are making rapid and sustained progress.

In good schools the most able pupils’ learning is generally good, they make good progress and achieve well over time.

In schools requiring improvement the teaching of the most able pupils and their achievement are not good.

In inadequate schools the most able pupils are underachieving and making inadequate progress.

  • No published advice has been made available to inspectors on the interpretation of these amendments to the inspection guidance. In October 2013 I wrote:

‘Unfortunately, there is a real risk that the questionable clarity of the Handbook and Subsidiary Guidance will result in some inconsistency in the application of the Framework, even though the fundamental purpose of such material is surely to achieve the opposite.’

  • Analysis of a very small sample of reports for schools reporting poor results for high attainers in the school performance tables suggested inconsistency both before and after the amendments were introduced into the guidance. I commented:

‘One might expect that, unconsciously or otherwise, inspectors are less ready to single out the performance of the most able when a school is inadequate across the board, but the small sample above does not support this hypothesis. Some of the most substantive comments relate to inadequate schools.

It therefore seems more likely that the variance is attributable to the differing capacity of inspection teams to respond to the new emphases in their inspection guidance. This would support the case made in my previous post for inspectors to receive additional guidance on how they should interpret the new requirement.’

The material below considers the impact of these revisions on a more substantial sample of reports and whether this justifies some of the concerns expressed above.

It is important to add that, in January 2014, Ofsted revised its guidance document ‘Writing the report for school inspections’ to include the statement that:

Inspectors must always report in detail on the progress of the most able pupils and how effectively teaching engages them with work that is challenging enough.’ (p8)

This serves to reinforce the changes to the inspection guidance and clearly indicates that coverage of this issue – at least in these terms – is a non-negotiable: we should expect to see appropriate reference in every single section 5 report.


The Sample

The sample comprises 87 secondary schools whose Section 5 inspection reports were published by Ofsted in the month of March 2014.

The inspections were conducted between 26 November 2013 and 11 March 2014, so the inspectors will have had time to become familiar with the revised guidance.

However up to 20 of the inspections took place before Ofsted felt it necessary to emphasise that coverage of the progress and teaching of the most able is compulsory.

The sample happens to include several institutions inspected as part of wider-ranging reviews of schools in Birmingham and schools operated by the E-ACT academy chain. It also incorporates several middle-deemed secondary schools.

Chart 1 shows the regional breakdown of the sample, adopting the regions Ofsted uses to categorise reports, as opposed to its own regional structure (ie with the North East identified separately from Yorkshire and Humberside).

It contains a disproportionately large number of schools from the West Midlands while the South-West is significantly under-represented. All the remaining regions supply between 5 and 13 schools. A total of 57 local authority areas are represented.


Chart 1: Schools within the sample by region

Ofsted chart 1


Chart 2 shows the different statuses of schools within the sample. Over 40% are community schools, while almost 30% are sponsored academies. There are no academy converters but sponsored academies, free schools and studio schools together account for some 37% of the sample.


Chart 2: Schools within the sample by status

Ofsted chart 2


The vast majority of schools in the sample are 11-16 or 11-18 institutions, but four are all-through schools, five provide for learners aged 13 or 14 upwards and 10 are middle schools. There are four single sex schools.

Chart 3 shows the variation in school size. Some of the studio schools, free schools and middle schools are very small by secondary standards, while the largest secondary school in the sample has some 1,600 pupils. A significant proportion of schools have between 600 and 1,000 pupils.


Chart 3: Schools within the sample by number on roll

Ofsted chart 3

The distribution of overall inspection grades between the sample schools is illustrated by Chart 4 below. Eight of the sample were rated outstanding, 28 good, 35 as requiring improvement and 16 inadequate.

Of those rated inadequate, 12 were subject to special measures and four had serious weaknesses.


Chart 4: Schools within the sample by overall inspection grade

 Ofsted chart 4

The eight schools rated outstanding include:

  • A mixed 11-18 sponsored academy
  • A mixed 14-19 studio school
  • A mixed 11-18 free school
  • A mixed 11-16 VA comprehensive;
  • A girls’ 11-18  VA comprehensive
  • A boys’ 11-18 VA selective school
  • A girls’ 11-18 community comprehensive and
  • A mixed 11-18 community comprehensive

The sixteen schools rated inadequate include:

  • Eight mixed 11-18 sponsored academies
  • Two mixed 11-16 sponsored academies
  • An mixed all-through sponsored academy
  • A mixed 11-16 free school
  • Two mixed 11-16 community comprehensives
  • A mixed 11-18 community comprehensive and
  • A mixed 13-19 community comprehensive


Coverage of the most able in main findings and recommendations


Terminology 

Where they were mentioned, such learners were most often described as ‘most able’ but a wide range of other terminology is deployed included ‘most-able’, ‘the more able’, ‘more-able’, ‘higher attaining’, ‘high-ability’, ‘higher-ability’ and ‘able students’.

The idiosyncratic adoption of redundant hyphenation is an unresolved mystery.

It is not unusual for two or more of these terms to be used in the same report. Because there is no glossary in existence, this makes some reports rather less straightforward to interpret accurately.

It is also more difficult to compare and contrast reports. Helpful services like Watchsted’s word search facility become less useful.


Incidence of commentary in the main findings and recommendations

Thirty of the 87 inspection reports (34%) addressed the school’s most able learners explicitly (or applied a similar term) in the sections setting out the report’s main findings and the recommendations respectively.

The analysis showed that 28% of reports on academies (including studios and free schools) met this criterion, whereas 38% of reports on non-academy schools did so.

Chart 5 shows how the incidence of reference in both main findings and recommendations varies according to the overall inspection grade awarded.

One can see that this level of attention is most prevalent in schools requiring improvement, followed by those with inadequate grades. It was less common in schools rated good and less common still in outstanding schools. The gap between these two categories is perhaps smaller than expected.

The slight lead for schools requiring improvement over inadequate schools may be attributable to a view that more of the latter face more pressing priorities, or it may have something to do with the varying proportions of high attainers in such schools, or both of these factors could be in play, amongst others.


Chart 5: Most able covered in both main findings and recommendations by overall inspection rating (percentage)

Ofsted chart 5

A further eleven reports (13%) addressed the most able learners in the recommendations but not the main findings.

Only one report managed to feature the most able in the main findings but not in the recommendations and this was because the former recorded that ‘the most able students do well’.

Consequently, a total of 45 reports (52%) did not mention the most able in either the main findings or the recommendations.

This applied to some 56% of reports on academies (including free schools and studio schools) and 49% of reports on other state-funded schools.

So, according to these proxy measures, the most able in academies appear to receive comparatively less attention from inspectors than those in non-academy schools. It is not clear why. (The samples are almost certainly too small to support reliable comparison of academies and non-academies with different inspection ratings.)

Chart 6 below shows the inspection ratings for this subset of reports.


Chart 6: Most able covered in neither main findings nor recommendations by overall inspection rating (percentage)

Ofsted chart 6

Here is further evidence that the significant majority of outstanding schools are regarded as having no significant problems in respect of provision for the most able.

On the other hand, this is far from being universally true, since it is an issue for one in four of them. This ratio of 3:1 does not lend complete support to the oft-encountered truism that outstanding schools invariably provide outstandingly for the most able – and vice versa.

At the other end of the spectrum, and perhaps even more surprisingly, over 30% of inadequate schools are assumed not to have issues significant enough to warrant reference in these sections. Sometimes this may be because they are equally poor at providing for all their learners, so the most able are not separately singled out.

Chart 7 below shows differences by school size, giving the percentage of reports mentioning the most able in both main findings and recommendations and in neither.

It divides schools into three categories: small (24 schools with a NOR of 599 or lower), medium (35 schools with a NOR of 600-999) and large (28 schools with a NOR of 1000 or higher.


Chart 7: Reports mentioning the most able in main findings and recommendations by school size 

 Ofsted chart 7

It is evident that ‘neither’ exceeds ‘both’ in the case of all three categories. The percentages are not too dissimilar in the case of small and large schools, which record a very similar profile.

But there is a much more significant difference for medium-sized schools. They demonstrate a much smaller percentage of ‘both’ reports and comfortably the largest percentage of ‘neither’ reports.

This pattern – suggesting that inspectors are markedly less likely to emphasise provision for the most able in medium-sized schools – is worthy of further investigation.

It would be particularly interesting to explore further the relationship between school size, the proportion of high attainers in a school and their achievement.


Typical references in the main findings and recommendations

I could detect no obvious and consistent variations in these references by school status or size, but it was possible to detect a noticeably different emphasis between schools rated outstanding and those rated inadequate.

Where the most able featured in reports on outstanding schools, these included recommendations such as:

‘Further increase the proportion of outstanding teaching in order to raise attainment even higher, especially for the most able students.’ (11-16 VA comprehensive).

‘Ensure an even higher proportion of students, including the most able, make outstanding progress across all subjects’ (11-18 sponsored academy).

These statements suggest that such schools have made good progress in eradicating underachievement amongst the most able but still have further room for improvement.

But where the most able featured in recommendations for inadequate schools, they were typically of this nature:

‘Improve teaching so that it is consistently good or better across all subjects, but especially in mathematics, by: raising teachers’ expectations of the quality and amount of work students of all abilities can do, especially the most and least able.’  (11-16 sponsored academy).

‘Improve the quality of teaching in order to speed up the progress students make by setting tasks that are at the right level to get the best out of students, especially the most able.’ (11-18 sponsored academy).

‘Rapidly improve the quality of teaching, especially in mathematics, by ensuring that teachers: have much higher expectations of what students can achieve, especially the most able…’ (11-16 community school).

These make clear that poor and inconsistent teaching quality is causing significant underachievement at the top end (and ‘especially’ suggests that this top end underachievement is particularly pronounced compared with other sections of the attainment spectrum in such schools).

Recommendations for schools requiring improvement are akin to those for inadequate schools but typically more specific, pinpointing particular dimensions of good quality teaching that are absent, so limiting effective provision for the most able. It is as if these schools have some of the pieces in place but not yet the whole jigsaw.

By comparison, recommendations for good schools can seem rather more impressionistic and/or formulaic, focusing more generally on ‘increasing the proportion of outstanding teaching’. In such cases the assessment is less about missing elements and more about the consistent application of all of them across the school.

One gets the distinct impression that inspectors have a clearer grasp of the ‘fit’ between provision for the most able and the other three inspection outcomes, at least as far as the distinction between ‘good’ and ‘outstanding’ is concerned.

But it would be misleading to suggest that these lines of demarcation are invariably clear. The boundary between ‘good’ and ‘requires improvement’ seems comparatively distinct, but there was more evidence of overlap at the intersections between the other grades.


Coverage of the most able in the main body of reports 

References to the most able rarely turn up in the sections dealing with behaviour and safety and leadership and management. I counted no examples of the former and no more than one or two of the latter.

I could find no examples where information, advice and guidance available to the most able are separately and explicitly discussed and little specific reference to the appropriateness of the curriculum for the most able. Both are less prominent than the recommendations in the June 2013 survey report led us to expect.

Within this sample, the vast majority of reports include some description of the attainment and/or progress of the most able in the section about pupils’ achievement, while roughly half pick up the issue in relation to the quality of teaching.

The extent of the coverage of most able learners varied enormously. Some devoted a single sentence to the topic while others referred to it separately in main findings, recommendations, pupils’ achievement and quality of teaching. In a handful of cases reports seemed to give disproportionate attention to the topic.


Attainment and progress

Analyses of attainment and progress are sometimes entirely generic, as in:

‘The most able students make good progress’ (inadequate 11-18 community school).

‘The school has correctly identified a small number of the most able who could make even more progress’ (outstanding 11-16 RC VA school).

‘The most able students do not always secure the highest grades’ (11-16 community school requiring improvement).

‘The most able students make largely expected rates of progress. Not enough yet go on to attain the highest GCSE grades in all subjects.’ (Good 11-18 sponsored academy).

Sometimes such statements can be damning:

‘The most-able students in the academy are underachieving in almost every subject. This is even the case in most of those subjects where other students are doing well. It is an academy-wide issue.’ (Inadequate 11-18 sponsored academy).

These do not in my view constitute reporting ‘in detail on the progress of the most able pupils’ and so probably fall foul of Ofsted’s guidance to inspectors on writing reports.

More specific comments on attainment typically refer explicitly to the achievement of A*/A grades at GCSE and ideally to specific subjects, for example:

‘In 2013, standards in science, design and technology, religious studies, French and Spanish were also below average. Very few students achieved the highest A* and A grades.’ (Inadequate 11-18 sponsored academy)

‘Higher-ability students do particularly well in a range of subjects, including mathematics, religious education, drama, art and graphics. They do as well as other students nationally in history and geography.’ (13-18 community school  requiring improvement)

More specific comments on progress include:

‘The progress of the most able students in English is significantly better than that in other schools nationally, and above national figures in mathematics. However, the progress of this group is less secure in science and humanities.’  (Outstanding 11-18 sponsored academy)

‘In 2013, when compared to similar students nationally, more-able students made less progress than less-able students in English. In mathematics, where progress is less than in English, students of all abilities made similar progress.’ (11-18 sponsored academy requiring improvement).

Statements about progress rarely extend beyond English and maths (the first example above is exceptional) but, when attainment is the focus, some reports take a narrow view based exclusively on the core subjects, while others are far wider-ranging.

Despite the reference in Ofsted’s survey report, and subsequently the revised subsidiary guidance, to coverage of high attaining learners in receipt of the Pupil Premium, this is hardly ever addressed.

I could find only two examples amongst the 87 reports:

‘The gap between the achievement in English and mathematics of students for whom the school receives additional pupil premium funding and that of their classmates widened in 2013… During the inspection, it was clear that the performance of this group is a focus in all lessons and those of highest ability were observed to be achieving equally as well as their peers.’ (11-16 foundation school requiring improvement)

‘Students eligible for the pupil premium make less progress than others do and are consequently behind their peers by approximately one GCSE grade in English and mathematics. These gaps reduced from 2012 to 2013, although narrowing of the gaps in progress has not been consistent over time. More-able students in this group make relatively less progress.’ (11-16 sponsored academy requiring improvement)

More often than not it seems that the most able and those in receipt of the Pupil Premium are assumed to be mutually exclusive groups.


Quality of teaching 

There was little variation in the issues raised under teaching quality. Most inspectors select two or three options from a standard menu:

‘Where teaching is best, teachers provide suitably challenging materials and through highly effective questioning enable the most able students to be appropriately challenged and stretched…. Where teaching is less effective, teachers are not planning work at the right level of difficulty. Some work is too easy for the more able students in the class. (Good 11-16 community school)

 ‘In teaching observed during the inspection, the pace of learning for the most able students was too slow because the activities they were given were too easy. Although planning identified different activities for the most able students, this was often vague and not reflected in practice.  Work lacks challenge for the most able students.’ (Inadequate 11-16 community school)

‘In lessons where teaching requires improvement, teachers do not plan work at the right level to ensure that students of differing abilities build on what they already know. As a result, there is a lack of challenge in these lessons, particularly for the more able students, and the pace of learning is slow. In these lessons teachers do not have high enough expectations of what students can achieve.’ (11-18 community school requiring improvement)

‘Tasks set by teachers are sometimes too easy and repetitive for pupils, particularly the most able. In mathematics, pupils are sometimes not moved on quickly enough to new and more challenging tasks when they have mastered their current work.’ (9-13 community middle school requiring improvement)

‘Targets which are set for students are not demanding enough, and this particularly affects the progress of the most able because teachers across the year groups and subjects do not always set them work which is challenging. As a result, the most able students are not stretched in lessons and do not achieve as well as they should.’ (11-16 sponsored academy rated inadequate)

All the familiar themes are present – assessment informing planning, careful differentiation, pace and challenge, appropriate questioning, the application of subject knowledge, the quality of homework, high expectations and extending effective practice between subject departments.


Negligible coverage of the most able

Only one of the 87 reports failed to make any mention of the most able whatsoever. This is the report on North Birmingham Academy, an 11-19 mixed school requiring improvement.

This clearly does not meet the injunction to:

‘…report in detail on the progress of the most able pupils and how effectively teaching engages them with work that is challenging enough’.

It ought not to have passed through Ofsted’s quality assurance processes unscathed. The inspection was conducted in February 2014, after this guidance issued, so there is no excuse.

Several other inspections make only cursory references to the most able in the main body of the report, for example:

‘Where teaching is not so good, it was often because teachers failed to check students’ understanding or else to anticipate when to intervene to support students’ learning, especially higher attaining students in the class.’ (Good 11-18 VA comprehensive).

‘… the teachers’ judgements matched those of the examiners for a small group of more-able students who entered early for GCSE in November 2013.’ (Inadequate 11-18 sponsored academy).

‘More-able students are increasingly well catered for as part of the academy’s focus on raising levels of challenge.’ (Good 11-18 sponsored academy).

‘The most able students do not always pursue their work to the best of their capability.’ (11-16 free school requiring improvement).

These would also fall well short of the report writing guidance. At least 6% of my sample falls into this category.

Some reports note explicitly that the most able learners are not making sufficient progress, but fail to capture this in the main findings or recommendations, for example:

‘The achievement of more able students is uneven across subjects. More able students said to inspectors that they did not feel they were challenged or stretched in many of their lessons. Inspectors agreed with this view through evidence gathered in lesson observations…lessons do not fully challenge all students, especially the more able, to achieve the grades of which they are capable.’ (11-19 sponsored academy requiring improvement).

‘The 2013 results of more-able students show they made slower progress than is typical nationally, especially in mathematics.  Progress is improving this year, but they are still not always sufficiently challenged in lessons.’ (11-18 VC CofE school requiring improvement).

‘There is only a small proportion of more-able students in the academy. In 2013 they made less progress in English and mathematics than similar students nationally. Across all of their subjects, teaching is not sufficiently challenging for more-able students and they leave the academy with standards below where they should be.’ (Inadequate 11-18 sponsored academy).

‘The proportion of students achieving grades A* and A was well below average, demonstrating that the achievement of the most able also requires improvement.’  (11-18 sponsored academy requiring improvement).

Something approaching 10% of the sample fell into this category. It was not always clear why this issue was not deemed significant enough to feature amongst schools’ priorities for improvement. This state of affairs was more typical of schools requiring improvement than inadequate schools, so one could not so readily argue that the schools concerned were overwhelmed with the need to rectify more basic shortcomings.

That said, the example from an inadequate academy above may be significant. It is almost as if the small number of more able students is the reason why this shortcoming is not taken more seriously.

Inspectors must carry in their heads a somewhat subjective hierarchy of issues that schools are expected to tackle. Some inspectors appear to feature the most able at a relatively high position in this hierarchy; others push it further down the list. Some appear more flexible in the application of this hierarchy to different settings than others.


Formulaic and idiosyncratic references 

There is clear evidence of formulaic responses, especially in the recommendations for how schools can improve their practice.

Many reports adopt the strategy of recommending a series of actions featuring the most able, either in the target group:

‘Improve the quality of teaching to at least good so that students, including the most able, achieve higher standards, by ensuring that: [followed by a list of actions] (9-13 community middle school requiring improvement)

Or in the list of actions:

‘Improve the quality of teaching in order to raise the achievement of students by ensuring that teachers:…use assessment information to plan their work so that all groups of students, including those supported by the pupil premium and the most-able students, make good progress.’ (11-16 community school requiring improvement)

It was rare indeed to come across a report that referred explicitly to interesting or different practice in the school, or approached the topic in a more individualistic manner, but here are a few examples:

‘More-able pupils are catered for well and make good progress. Pupils enjoy the regular, extra challenges set for them in many lessons and, where this happens, it enhances their progress. They enjoy that extra element which often tests them and gets them thinking about their work in more depth. Most pupils are keen to explore problems which will take them to the next level or extend their skills.’  (Good 9-13 community middle school)

‘Although the vast majority of groups of students make excellent progress, the school has correctly identified a small number of the most able who could make even more progress. It has already started an impressive programme of support targeting the 50 most able students called ‘Students Targeted A grade Results’ (STAR). This programme offers individualised mentoring using high-quality teachers to give direct intervention and support. This is coupled with the involvement of local universities. The school believes this will give further aspiration to these students to do their very best and attend prestigious universities.’  (Outstanding 11-16 VA school)

I particularly liked:

‘Policies to promote equality of opportunity are ineffective because of the underachievement of several groups of students, including those eligible for the pupil premium and the more-able students.’ (Inadequate 11-18 academy) 


Conclusion


Main Findings

The principal findings from this survey, admittedly based on a rather small and not entirely representative sample, are that:

  • Inspectors are terminologically challenged in addressing this issue, because there are too many synonyms or near-synonyms in use.
  • Approximately one-third of inspection reports address provision for the most able in both main findings and recommendations. This is less common in academies than in community, controlled and aided schools. It is most prevalent in schools with an overall ‘requires improvement’ rating, followed by those rated inadequate. It is least prevalent in outstanding schools, although one in four outstanding schools is dealt with in this way.
  • Slightly over half of inspection reports address provision for the most able in neither the main findings nor the recommendations. This is relatively more common in the academies sector and in outstanding schools. It is least prevalent in schools rated inadequate, though almost one-third of inadequate schools fall into this category. Sometimes this is the case even though provision for the most able is identified as a significant issue in the main body of the report.
  • There is an unexplained tendency for reports on medium-sized schools to be significantly less likely to feature the most able in both main findings and recommendations and significantly more likely to feature it in neither. This warrants further investigation.
  • Overall coverage of the topic varies excessively between reports. One ignored it entirely, while several provided only cursory coverage and a few covered it to excess. The scope and quality of the coverage does not necessarily correlate with the significance of the issue for the school.
  • Coverage of the attainment and progress of the most able learners is variable. Some reports offer only generic descriptions of attainment and progress combined, some are focused exclusively on attainment in the core subjects while others take a wider curricular perspective. Outside the middle school sector, desirable attainment outcomes for the most able are almost invariably defined exclusively in terms of A* and A grade GCSEs.
  • Hardly any reports consider the attainment and/or progress of the most able learners in receipt of the Pupil Premium.
  • None of these reports make specific and explicit reference to IAG for the most able. It is rarely stated whether the school’s curriculum satisfies the needs of the most able.
  • Too many reports adopt formulaic approaches, especially in the recommendations they offer the school. Too few include reference to interesting or different practice.

In my judgement, too much current inspection reporting falls short of the commitments contained in the original Ofsted survey report and of the more recent requirement to:

‘always report in detail on the progress of the most able pupils and how effectively teaching engages them with work that is challenging enough.’


Recommendations

  • Ofsted should publish a glossary defining clearly all the terms for the most able that it employs, so that both inspectors and schools understand exactly what is intended when a particular term is deployed and which learners should be in scope when the most able are discussed.
  • Ofsted should co-ordinate the development of supplementary guidance clarifying their expectations of schools in respect of provision for the most able. This should set out in more detail what expectations would apply for such provision to be rated outstanding, good, requiring improvement and inadequate respectively. This should include the most able in receipt of the Pupil Premium, the suitability of the curriculum and the provision of IAG.
  • Ofsted should provide supplementary guidance for inspectors outlining and exemplifying the full range of evidence they might interrogate concerning the attainment and progress of the most able learners, including those in receipt of the Pupil Premium.
  • This guidance should specify the essential minimum coverage expected in reports and the ‘triggers’ that would warrant it being referenced in the main findings and/or recommendations for action.
  • This guidance should discourage inspectors from adopting formulaic descriptors and recommendations and specifically encourage them to identify unusual or innovative examples of effective practice.
  • The school inspection handbook and subsidiary guidance should be amended to reflect the supplementary guidance.
  • The School Data Dashboard should be expanded to include key data highlighting the attainment and progress of the most able.
  • These actions should also be undertaken for inspection of the primary and 16-19 sectors respectively.


Overall assessment: Requires Improvement.


GP

May 2014


PISA 2012 Creative Problem Solving: International Comparison of High Achievers’ Performance

This post compares the performance of high achievers from selected jurisdictions on the PISA 2012 creative problem solving test.

It draws principally on the material in the OECD Report ‘PISA 2012 Results: Creative Problem Solving’ published on 1 April 2014.

Pisa ps cover CaptureThe sample of jurisdictions includes England, other English-speaking countries (Australia, Canada, Ireland and the USA) and those that typically top the PISA rankings (Finland, Hong Kong, South Korea, Shanghai, Singapore and Taiwan).

With the exception of New Zealand, which did not take part in the problem solving assessment, this is deliberately identical to the sample I selected for a parallel post reviewing comparable results in the PISA 2012 assessments of reading, mathematics and science: ‘PISA 2012: International Comparisons of High Achievers’ Performance’ (December 2013)

These eleven jurisdictions account for nine of the top twelve performers ranked by mean overall performance in the problem solving assessment. (The USA and Ireland lie outside the top twelve, while Japan, Macao and Estonia are the three jurisdictions that are in the top twelve but outside my sample.)

The post is divided into seven sections:

  • Background to the problem solving assessment: How PISA defines problem solving competence; how it defines performance at each of the six levels of proficiency; how it defines high achievement; the nature of the assessment and who undertook it.
  • Average performance, the performance of high achievers and the performance of low achievers (proficiency level 1) on the problem solving assessment. This comparison includes my own sample and all the other jurisdictions that score above the OECD average on the first of these measures.
  • Gender and socio-economic differences amongst high achievers on the problem solving assessment  in my sample of eleven jurisdictions.
  • The relative strengths and weaknesses of jurisdictions in this sample on different aspects of the problem solving assessment. (This treatment is generic rather than specific to high achievers.)
  • What proportion of high achievers on the problem-solving assessment in my sample of jurisdictions are also high achievers in reading, maths and science respectively.
  • What proportion of students in my sample of jurisdictions achieves highly in one or more of the four PISA 2012 assessments – and against the ‘all-rounder’ measure, which is based on high achievement in all of reading, maths and science (but not problem solving).
  • Implications for education policy makers seeking to improve problem solving performance in each of the sample jurisdictions.

Background to the Problem Solving Assessment

.

Definition of problem solving

PISA’s definition of problem-solving competence is:

‘…an individual’s capacity to engage in cognitive processing to understand and resolve problem situations where a method of solution is not immediately obvious. It includes the willingness to engage with such situations in order to achieve one’s potential as a constructive and reflective citizen.’

The commentary on this definition points out that:

  • Problem solving requires identification of the problem(s) to be solved, planning and applying a solution, and monitoring and evaluating progress.
  • A problem is ‘a situation in which the goal cannot be achieved by merely applying learned procedures’, so the problems encountered must be non-routine for 15 year-olds, although ‘knowledge of general strategies’ may be useful in solving them.
  • Motivational and affective factors are also in play.

The Report is rather coy about the role of creativity in problem solving, and hence the justification for the inclusion of this term in its title.

Perhaps the nearest it gets to an exposition is when commenting on the implications of its findings:

‘In some countries and economies, such as Finland, Shanghai-China and Sweden, students master the skills needed to solve static, analytical problems similar to those that textbooks and exam sheets typically contain as well or better than 15-year-olds, on average, across OECD countries. But the same 15-year-olds are less successful when not all information that is needed to solve the problem is disclosed, and the information provided must be completed by interacting with the problem situation. A specific difficulty with items that require students to be open to novelty, tolerate doubt and uncertainty, and dare to use intuitions (“hunches and feelings”) to initiate a solution suggests that opportunities to develop and exercise these traits, which are related to curiosity, perseverance and creativity, need to be prioritised.’

.

Assessment framework

PISA’s framework for assessing problem solving competence is set out in the following diagram


PISA problem solving framework Capture


In solving a particular problem it may not be necessary to apply all these steps, or to apply them in this order.

Proficiency levels

The proficiency scale was designed to have a mean score across OECD countries of 500. The six levels of proficiency applied in the assessment each have their own profile.

The lowest, level 1 proficiency is described thus:

‘At Level 1, students can explore a problem scenario only in a limited way, but tend to do so only when they have encountered very similar situations before. Based on their observations of familiar scenarios, these students are able only to partially describe the behaviour of a simple, everyday device. In general, students at Level 1 can solve straightforward problems provided there is a simple condition to be satisfied and there are only one or two steps to be performed to reach the goal. Level 1 students tend not to be able to plan ahead or set sub-goals.’

This level equates to a range of scores from 358 to 423. Across the OECD sample, 91.8% of participants are able to perform tasks at this level.

By comparison, level 5 proficiency is described in this manner:

‘At Level 5, students can systematically explore a complex problem scenario to gain an understanding of how relevant information is structured. When faced with unfamiliar, moderately complex devices, such as vending machines or home appliances, they respond quickly to feedback in order to control the device. In order to reach a solution, Level 5 problem solvers think ahead to find the best strategy that addresses all the given constraints. They can immediately adjust their plans or backtrack when they detect unexpected difficulties or when they make mistakes that take them off course.’

The associated range of scores is from 618 to 683 and 11.4% of all OECD students achieve at this level.

Finally, level 6 proficiency is described in this way:

‘At Level 6, students can develop complete, coherent mental models of diverse problem scenarios, enabling them to solve complex problems efficiently. They can explore a scenario in a highly strategic manner to understand all information pertaining to the problem. The information may be presented in different formats, requiring interpretation and integration of related parts. When confronted with very complex devices, such as home appliances that work in an unusual or unexpected manner, they quickly learn how to control the devices to achieve a goal in an optimal way. Level 6 problem solvers can set up general hypotheses about a system and thoroughly test them. They can follow a premise through to a logical conclusion or recognise when there is not enough information available to reach one. In order to reach a solution, these highly proficient problem solvers can create complex, flexible, multi-step plans that they continually monitor during execution. Where necessary, they modify their strategies, taking all constraints into account, both explicit and implicit.’

The range of level 6 scores is from 683 points upwards and 2.5% of all OECD participants score at this level.

PISA defines high achieving students as those securing proficiency level 5 or higher, so proficiency levels 5 and 6 together. The bulk of the analysis it supplies relates to this cohort, while relatively little attention is paid to the more exclusive group achieving proficiency level 6, even though almost 10% of students in Singapore reach this standard in problem solving.

 .

The sample

Sixty-five jurisdictions took part in PISA 2012, including all 34 OECD countries and 31 partners. But only 44 jurisdictions took part in the problem solving assessment, including 28 OECD countries and 16 partners. As noted above, that included all my original sample of twelve jurisdictions, with the exception of New Zealand.

I could find no stated reason why New Zealand chose not to take part. Press reports initially suggested that England would do likewise, but it was subsequently reported that this decision had been reversed.

The assessment was computer-based and comprised 16 units divided into 42 items. The units were organised into four clusters, each designed to take 20 minutes to complete. Participants completed one or two clusters, depending on whether they were also undertaking computer-based assessments of reading and maths.

In each jurisdiction a random sample of those who took part in the paper-based maths assessment was selected to undertake the problem solving assessment. About 85,000 students took part in all. The unweighted sample sizes in my selected jurisdictions are set out in Table 1 below, together with the total population of 15 year-olds in each jurisdiction.


Table 1: Sample sizes undertaking PISA 2012 problem solving assessment in selected jurisdictions

Country Unweighted Sample Total 15 year-olds
Australia 5,612 291,976
Canada 4,601 417,873
Finland 3,531 62,523
Hong Kong 1,325 84,200
Ireland 1,190 59,296
Shanghai 1,203 108,056
Singapore 1,394 53,637
South Korea 1,336 687,104
Taiwan 1,484 328,356
UK (England) 1,458 738,066
USA 1,273 3,985,714

Those taking the assessment were aged between 15 years and three months and 16 years and two months at the time of the assessment. All were enrolled at school and had completed at least six years of formal schooling.

Average performance compared with the performance of high and low achievers

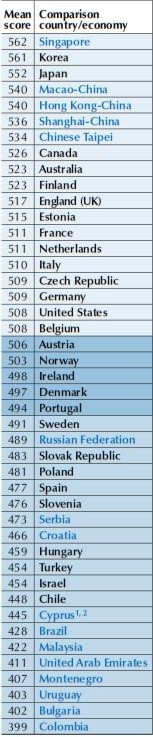
The overall table of mean scores on the problem solving assessment is shown below

PISA problem solving raw scores Capture

 .

There are some familiar names at the top of the table, especially Singapore and South Korea, the two countries that comfortably lead the rankings. Japan is some ten points behind in third place but it in turn has a lead of twelve points over a cluster of four other Asian competitors: Macao, Hong Kong, Shanghai and Taiwan.

A slightly different picture emerges if we compare average performance with the proportion of learners who achieve the bottom proficiency level and the top two proficiency levels. Table 2 below compares these groups.

This table includes all the jurisdictions that exceeded the OECD average score. I have marked out in bold the countries in my sample of eleven which includes Ireland, the only one of them that did not exceed the OECD average.

Table 2: PISA Problem Solving 2012: Comparing Average Performance with Performance at Key Proficiency Levels


Jurisdiction Mean score Level 1 (%) Level 5 (%) Level 6 (%) Levels 5+6 (%)
Singapore 562 6.0 19.7 9.6 29.3
South Korea 561 4.8 20.0 7.6 27.6
Japan 552 5.3 16.9 5.3 22.2
Macao 540 6.0 13.8 2.8 16.6
Hong Kong 540 7.1 14.2 5.1 19.3
Shanghai 536 7.5 14.1 4.1 18.2
Taiwan 534 8.2 14.6 3.8 18.4
Canada 526 9.6 12.4 5.1 17.5
Australia 523 10.5 12.3 4.4 16.7
Finland 523 9.9 11.4 3.6 15.0
England (UK) 517 10.8 10.9 3.3 14.2
Estonia 515 11.1 9.5 2.2 11.7
France 511 9.8 9.9 2.1 12.0
Netherlands 511 11.2 10.9 2.7 13.6
Italy 510 11.2 8.9 1.8 10.7
Czech Republic 509 11.9 9.5 2.4 11.9
Germany 509 11.8 10.1 2.7 12.8
USA 508 12.5 8.9 2.7 11.6
Belgium 508 11.6 11.4 3.0 14.4
Austria 506 11.9 9.0 2.0 11.0
Norway 503 13.2 9.7 3.4 13.1
Ireland 498 13.3 7.3 2.1 9.4
OECD Ave. 500 13.2 8.9 2.5 11.4

 .

The jurisdictions at the top of the table also have a familiar profile, with a small ‘tail’ of low performance combined with high levels of performance at the top end.

Nine of the top ten have fewer than 10% of learners at proficiency level 1, though only South Korea pushes below 5%.

Five of the top ten have 5% or more of their learners at proficiency level 6, but only Singapore and South Korea have a higher percentage at level 6 than level 1 (with Japan managing the same percentage at both levels).

The top three performers – Singapore, South Korea and Japan – are the only three jurisdictions that have over 20% of their learners at proficiency levels 5 and 6 together.

South Korea slightly outscores Singapore at level 5 (20.0% against 19.7%). Japan is in third place, followed by Taiwan, Hong Kong and Shanghai.

But at level 6, Singapore has a clear lead, followed by South Korea, Japan, Hong Kong and Canada respectively.

England’s overall place in the table is relatively consistent on each of these measures, but the gaps between England and the top performers vary considerably.

The best have fewer than half England’s proportion of learners at proficiency level 1, almost twice as many learners at proficiency level 5 and more than twice as many at proficiency levels 5 and 6 together. But at proficiency level 6 they have almost three times as many learners as England.

Chart 1 below compares performance on these four measures across my sample of eleven jurisdictions.

All but Ireland are comfortably below the OECD average for the percentage of learners at proficiency level 1. The USA and Ireland are atypical in having a bigger tail (proficiency level 1) than their cadres of high achievers (levels 5 and 6 together).

At level 5 all but Ireland and the USA are above the OECD average, but USA leapfrogs the OECD average at level 6.

There is a fairly strong correlation between the proportions of learners achieving the highest proficiency thresholds and average performance in each jurisdiction. However, Canada stands out by having an atypically high proportion of students at level 6.

.

Chart 1: PISA 2012 Problem-solving: Comparing performance at specified proficiency levels

Problem solving chart 1

.

PISA’s Report discusses the variation in problem-solving performance within different jurisdictions. However it does so without reference to the proficiency levels, so we do not know to what extent these findings apply equally to high achievers.

Amongst those above the OECD average, those with least variation are Macao, Japan, Estonia, Shanghai, Taiwan, Korea, Hong Kong, USA, Finland, Ireland, Austria, Singapore and the Czech Republic respectively.

Perhaps surprisingly, the degree of variation in Finland is identical to that in the USA and Ireland, while Estonia has less variation than many of the Asian jurisdictions. Singapore, while top of the performance table, is only just above the OECD average in terms of variation.

The countries below the OECD average on this measure – listed in order of increasing variation – include England, Australia and Canada, though all three are relatively close to the OECD average. So these three countries and Singapore are all relatively close together.

Gender and socio-economic differences amongst high achievers

 .

Gender differences

On average across OECD jurisdictions, boys score seven points higher than girls on the problem solving assessment. There is also more variation amongst boys than girls.

Across the OECD participants, 3.1% of boys achieved proficiency level 6 but only 1.8% of girls did so. This imbalance was repeated at proficiency level 5, achieved by 10% of boys and 7.7% of girls.

The table and chart below show the variations within my sample of eleven countries. The performance of boys exceeds that of girls in all cases, except in Finland at proficiency level 5, and in that instance the gap in favour of girls is relatively small (0.4%).

 .

Table 3: PISA Problem-solving: Gender variation at top proficiency levels

Jurisdiction Level 5 (%) Level 6 (%) Levels 5+6 (%)
  Boys Girls Diff Boys Girls Diff Boys Girls Diff
Singapore 20.4 19.0 +1.4 12.0 7.1 +4.9 32.4 26.1 +6.3
South Korea 21.5 18.3 +3.2 9.4 5.5 +3.9 30.9 23.8 +7.1
Hong Kong 15.7 12.4 +3.3 6.1 3.9 +2.2 21.8 16.3 +5.5
Shanghai 17.0 11.4 +5.6 5.7 2.6 +3.1 22.7 14.0 +8.7
Taiwan 17.3 12.0 +5.3 5.0 2.5 +2.5 22.3 14.5 +7.8
Canada 13.1 11.8 +1.3 5.9 4.3 +1.6 19.0 16.1 +2.9
Australia 12.6 12.0 +0.6 5.1 3.7 +1.4 17.7 15.7 +2.0
Finland 11.2 11.6 -0.4 4.1 3.0 +1.1 15.3 14.6 +0.7
England (UK) 12.1 9.9 +2.2 3.6 3.0 +0.6 15.7 12.9 +2.8
USA 9.8 7.9 +1.9 3.2 2.3 +0.9 13.0 10.2 +2.8
Ireland 8.0 6.6 +1.4 3.0 1.1 +1.9 11.0 7.7 +3.3
OECD Average 10.0 7.7 +2.3 3.1 1.8 +1.3 13.1 9.5 +3.6

There is no consistent pattern in whether boys are more heavily over-represented at proficiency level 5 than proficiency level 6, or vice versa.

There is a bigger difference at level 6 than at level 5 in Singapore, South Korea, Canada, Australia, Finland and Ireland, but the reverse is true in the five remaining jurisdictions.

At level 5, boys are in the greatest ascendancy in Shanghai and Taiwan while, at level 6, this is true of Singapore and South Korea.

When proficiency levels 5 and 6 are combined, all five of the Asian tigers show a difference in favour of males of 5.5% or higher, significantly in advance of the six ‘Western’ countries in the sample and significantly ahead of the OECD average.

Amongst the six ‘Western’ representatives, boys have the biggest advantage at proficiency level 5 in England, while at level 6 boys in Ireland have the biggest advantage.

Within this group of jurisdictions, the gap between boys and girls at level 6 is comfortably the smallest in England. But, in terms of performance at proficiency levels 5 and 6 together, Finland is ahead.

 .

Chart 2: PISA Problem-solving: Gender variation at top proficiency levels

Problem solving chart 2

The Report includes a generic analysis of gender differences in performance for boys and girls with similar levels of performance in English, maths and science.

It concludes that girls perform significantly above their expected level in both England and Australia (though the difference is only statistically significant in the latter).

The Report comments:

‘It is not clear whether one should expect there to be a gender gap in problem solving. On the one hand, the questions posed in the PISA problem-solving assessment were not grounded in content knowledge, so boys’ or girls’ advantage in having mastered a particular subject area should not have influenced results. On the other hand… performance in problem solving is more closely related to performance in mathematics than to performance in reading. One could therefore expect the gender difference in performance to be closer to that observed in mathematics – a modest advantage for boys, in most countries – than to that observed in reading – a large advantage for girls.’

 .

Socio-economic differences

The Report considers variations in performance against PISA’s Index of Economic, Social and Cultural status (IESC), finding them weaker overall than for reading, maths and science.

It calculates that the overall percentage variation in performance attributable to these factors is about 10.6% (compared with 14.9% in maths, 14.0% in science and 13.2% in reading).

Amongst the eleven jurisdictions in my sample, the weakest correlations were found in Canada (4%), followed by Hong Kong (4.9%), South Korea (5.4%), Finland (6.5%), England (7.8%), Australia (8.5%), Taiwan (9.4%), the USA (10.1%) and Ireland (10.2%) in that order. All those jurisdictions had correlations below the OECD average.

Perhaps surprisingly, there were above average correlations in Shanghai (14.1%) and, to a lesser extent (and less surprisingly) in Singapore (11.1%).

The report suggests that students with parents working in semi-skilled and elementary occupations tend to perform above their expected level in problem-solving in Taiwan, England, Canada, the USA, Finland and Australia (in that order – with Australia closest to the OECD average).

The jurisdictions where these students tend to underperform their expected level are – in order of severity – Ireland, Shanghai, Singapore, Hong Kong and South Korea.

A parallel presentation on the Report provides some additional data about the performance in different countries of what the OECD calls ‘resilient’ students – those in the bottom quartile of the IESC but in the top quartile by perfromance, after accounting for socio-economic status.

It supplies the graph below, which shows all the Asian countries in my sample clustered at the top, but also with significant gaps between them. Canada is the highest-performing of the remainder in my sample, followed by Finland, Australia, England and the USA respectively. Ireland is some way below the OECD average.

.

PISA problem resolving resilience Capture

.

Unfortunately, I can find no analysis of how performance varies according to socio-economic variables at each proficiency level. It would be useful to see which jurisdictions have the smallest ‘excellence gaps’ at levels 5 and 6 respectively.

 .

How different jurisdictions perform on different aspects of problem-solving

The Report’s analysis of comparative strengths and weaknesses in different elements of problem-solving does not take account of variations at different proficiency levels

It explains that aspects of the assessment were found easier by students in different jurisdictions, employing a four-part distinction between:

‘Exploring and understanding. The objective is to build mental representations of each of the pieces of information presented in the problem. This involves:

  • exploring the problem situation: observing it, interacting with it, searching for information and finding limitations or obstacles; and
  • understanding given information and, in interactive problems, information discovered while interacting with the problem situation; and demonstrating understanding of relevant concepts.

Representing and formulating. The objective is to build a coherent mental representation of the problem situation (i.e. a situation model or a problem model). To do this, relevant information must be selected, mentally organised and integrated with relevant prior knowledge. This may involve:

  • representing the problem by constructing tabular, graphic, symbolic or verbal representations, and shifting between representational formats; and
  • formulating hypotheses by identifying the relevant factors in the problem and their inter-relationships; and organising and critically evaluating information.

Planning and executing. The objective is to use one’s knowledge about the problem situation to devise a plan and execute it. Tasks where “planning and executing” is the main cognitive demand do not require any substantial prior understanding or representation of the problem situation, either because the situation is straightforward or because these aspects were previously solved. “Planning and executing” includes:

  • planning, which consists of goal setting, including clarifying the overall goal, and setting subgoals, where necessary; and devising a plan or strategy to reach the goal state, including the steps to be undertaken; and
  • executing, which consists of carrying out a plan.

Monitoring and reflecting.The objective is to regulate the distinct processes involved in problem solving, and to critically evaluate the solution, the information provided with the problem, or the strategy adopted. This includes:

  • monitoring progress towards the goal at each stage, including checking intermediate and final results, detecting unexpected events, and taking remedial action when required; and
  • reflecting on solutions from different perspectives, critically evaluating assumptions and alternative solutions, identifying the need for additional information or clarification and communicating progress in a suitable manner.’

Amongst my sample of eleven jurisdictions:

  • ‘Exploring and understanding’ items were found easier by students in Singapore, Hong Kong, South Korea, Australia, Taiwan and Finland. 
  • ‘Representing and formulating’ items were found easier in Taiwan, Shanghai, South Korea, Singapore, Hong Kong, Canada and Australia. 
  • ‘Planning and executing’ items were found easier in Finland only. 
  • ‘Monitoring and reflecting’ items were found easier in Ireland, Singapore, the USA and England.

The Report concludes:

‘This analysis shows that, in general, what differentiates high-performing systems, and particularly East Asian education systems, such as those in Hong Kong-China, Japan, Korea [South Korea], Macao-China, Shanghai -China, Singapore and Chinese Taipei [Taiwan], from lower-performing ones, is their students’ high level of proficiency on “exploring and understanding” and “representing and formulating” tasks.’

It also distinguishes those jurisdictions that perform best on interactive problems, requiring students to discover some of the information required to solve the problem, rather than being presented with all the necessary information. This seems to be the nearest equivalent to a measure of creativity in problem solving

Comparative strengths and weaknesses in respect of interactive tasks are captured in the following diagram.

.

PISA problem solving strengths in different countries

.

One can see that several of my sample – Ireland, the USA, Canada, Australia, South Korea and Singapore – are placed in the top right-hand quarter of the diagram, indicating stronger than expected performance on both interactive and knowledge acquisition tasks.

England is stronger than expected on the former but not on the latter.

Jurisdictions that are weaker than inspected on interactive tasks only include Hong Kong, Taiwan and Shanghai, while Finland is weaker than expected on both.

We have no information about whether these distinctions were maintained at different proficiency levels.

.

Comparing jurisdictions’ performance at higher proficiency levels

Table 4 and Charts 3 and 4 below show variations in the performance of countries in my sample across the four different assessments at level 6, the highest proficiency level.

The charts in particular emphasise how far ahead the Asian Tigers are in maths at this level, compared with the cross-jurisdictional variation in the other three assessments.

In all five cases, each ‘Asian Tiger’s’ level 6 performance in maths also vastly exceeds its level 6 performance in the other three assessments. The proportion of students achieving level 6 proficiency in problem solving lags far behind, even though there is a fairly strong correlation between these two assessments (see below).

In contrast, all the ‘Western’ jurisdictions in the sample – with the sole exception of Ireland – achieve a higher percentage at proficiency level 6 in problem solving than they do in maths, although the difference is always less than a full percentage point. (Even in Ireland the difference is only 0.1 of a percentage point in favour of maths.)

Shanghai is the only jurisdiction in the sample which has more students achieving proficiency level 6 in science than in problem solving. It also has the narrowest gap between level 6 performance in problem solving and in reading.

Meanwhile, England, the USA, Finland and Australia all have broadly similar profiles across the four assessments, with the largest percentage of level 6 performers in problem solving, followed by maths, science and reading respectively.

The proximity of the lines marking level 6 performance in reading and science is also particularly evident in the second chart below.

.

Table 4: Percentage achieving proficiency Level 6 in each domain

  PS L6  Ma L6 Sci L6 Re L6
Singapore 9.6 19.0 5.8 5.0
South Korea 7.6 12.1 1.1 1.6
Hong Kong 5.1 12.3 1.8 1.9
Shanghai 4.1 30.8 4.2 3.8
Taiwan 3.8 18.0 0.6 1.4
Canada 5.1 4.3 1.8 2.1
Australia 4.4 4.3 2.6 1.9
Finland 3.6 3.5 3.2 2.2
England (UK) 3.3 3.1 1.9 1.3
USA 2.7 2.2 1.1 1.0
Ireland 2.1 2.2 1.5 1.3
OECD Average 2.5 3.3 1.2 1.1

 Charts 3 and 4: Percentage achieving proficiency level 6 in each domain

Problem solving chart 3

Problem solving chart 4

The pattern is materially different at proficiency levels 5 and above, as the table and chart below illustrate. These also include the proportion of all-rounders, who achieved proficiency level 5 or above in each of maths, science and reading (but not in problem-solving).

The lead enjoyed by the ‘Asian Tigers’ in maths is somewhat less pronounced. The gap between performance within these jurisdictions on the different assessments also tends to be less marked, although maths accounts for comfortably the largest proportion of level 5+ performance in all five cases.

Conversely, level 5+ performance on the different assessments is typically much closer in the ‘Western’ countries. Problem solving leads the way in Australia, Canada, England and the USA, but in Finland science is in the ascendant and reading is strongest in Ireland.

Some jurisdictions have a far ‘spikier’ profile than others. Ireland is closest to achieving equilibrium across all four assessments. Australia and England share very similar profiles, though Australia outscores England in each assessment.

The second chart in particular shows how Shanghai’s ‘spike’ applies in all the other three assessments but not in problem solving.

Table 5: Percentage achieving Proficiency level 5 and above in each domain

  PS L5+  Ma L5+ Sci L5+ Re L5+ Ma + Sci + Re L5+
Singapore 29.3 40.0 22.7 21.2 16.4
South Korea 27.6 30.9 11.7 14.2 8.1
Hong Kong 19.3 33.4 16.7 16.8 10.9
Shanghai 18.2 55.4 27.2 25.1 19.6
Taiwan 18.4 37.2 8.4 11.8 6.1
Canada 17.5 16.4 11.3 12.9 6.5
Australia 16.7 14.8 13.5 11.7 7.6
Finland 15.0 15.2 17.1 13.5 7.4
England (UK) 14.2 12.4 11.7 9.1 5.7* all UK
USA 11.6 9.0 7.4 7.9 4.7
Ireland 9.4 10.7 10.8 11.4 5.7
OECD Average 11.4 12.6 8.4 8.4 4.4

 .

Charts 5 and 6: Percentage Achieving Proficiency Level 5 and above in each domain

Problem solving chart 5Problem solving chart 6.

How high-achieving problem solvers perform in other assessments

.

Correlations between performance in different assessments

The Report provides an analysis of the proportion of students achieving proficiency levels 5 and 6 on problem solving who also achieved that outcome on one of the other three assessments: reading, maths and science.

It argues that problem solving is a distinct and separate domain. However:

‘On average, about 68% of the problem-solving score reflects skills that are also measured in one of the three regular assessment domains. The remaining 32% reflects skills that are uniquely captured by the assessment of problem solving. Of the 68% of variation that problem-solving performance shares with other domains, the overwhelming part is shared with all three regular assessment domains (62% of the total variation); about 5% is uniquely shared between problem solving and mathematics only; and about 1% of the variation in problem solving performance hinges on skills that are specifically measured in the assessments of reading or science.’

It discusses the correlation between these different assessments:

‘A key distinction between the PISA 2012 assessment of problem solving and the regular assessments of mathematics, reading and science is that the problem-solving assessment does not measure domain-specific knowledge; rather, it focuses as much as possible on the cognitive processes fundamental to problem solving. However, these processes can also be used and taught in the other subjects assessed. For this reason, problem-solving tasks are also included among the test units for mathematics, reading and science, where their solution requires expert knowledge specific to these domains, in addition to general problem-solving skills.

It is therefore expected that student performance in problem solving is positively correlated with student performance in mathematics, reading and science. This correlation hinges mostly on generic skills, and should thus be about the same magnitude as between any two regular assessment subjects.’

These overall correlations are set out in the table below, which shows that maths has a higher correlation with problem solving than either science or reading, but that this correlation is lower than those between the three subject-related assessments.

The correlation between maths and science (0.90) is comfortably the strongest (despite the relationship between reading and science at the top end of the distribution noted above).

PISA problem solving correlations capture

Correlations are broadly similar across jurisdictions, but the Report notes that the association is comparatively weak in some of these, including Hong Kong. Students here are more likely to perform poorly on problem solving and well on other assessments, or vice versa.

There is also broad consistency at different performance levels, but the Report identifies those jurisdictions where students with the same level of performance exceed expectations in relation to problem-solving performance. These include South Korea, the USA, England, Australia, Singapore and – to a lesser extent – Canada.

Those with lower than expected performance include Shanghai, Ireland, Hong Kong, Taiwan and Finland.

The Report notes:

‘In Shanghai-China, 86% of students perform below the expected level in problem solving, given their performance in mathematics, reading and science. Students in these countries/economies struggle to use all the skills that they demonstrate in the other domains when asked to perform problem-solving tasks.’

However, there is variation according to students’ maths proficiency:

  • Jurisdictions whose high scores on problem solving are mainly attributable to strong performers in maths include Australia, England and the USA. 
  • Jurisdictions whose high scores on problem solving are more attributable to weaker performers in maths include Ireland. 
  • Jurisdictions whose lower scores in problem solving are more attributable to weakness among strong performers in maths include Korea. 
  • Jurisdictions whose lower scores in problem solving are more attributable to weakness among weak performers in maths include Hong Kong and Taiwan. 
  • Jurisdictions whose weakness in problem solving is fairly consistent regardless of performance in maths include Shanghai and Singapore.

The Report adds:

‘In Italy, Japan and Korea, the good performance in problem solving is, to a large extent, due to the fact that lower performing students score beyond expectations in the problem-solving assessment….This may indicate that some of these students perform below their potential in mathematics; it may also indicate, more positively, that students at the bottom of the class who struggle with some subjects in school are remarkably resilient when it comes to confronting real-life challenges in non-curricular contexts…

In contrast, in Australia, England (United Kingdom) and the United States, the best students in mathematics also have excellent problem-solving skills. These countries’ good performance in problem solving is mainly due to strong performers in mathematics. This may suggest that in these countries, high performers in mathematics have access to – and take advantage of – the kinds of learning opportunities that are also useful for improving their problem-solving skills.’

What proportion of high performers in problem solving are also high performers in one of the other assessments?

The percentages of high achieving students (proficiency level 5 and above) in my sample of eleven jurisdictions who perform equally highly in each of the three domain-specific assessments are shown in Table 6 and Chart 7 below.

These show that Shanghai leads the way in each case, with 98.0% of all students who achieve proficiency level 5+ in problem solving also achieving the same outcome in maths. For science and reading the comparable figures are 75.1% and 71.7% respectively.

Taiwan is the nearest competitor in respect of problem solving plus maths, Finland in the case of problem solving plus science and Ireland in the case of problem solving plus reading.

South Korea, Taiwan and Canada are atypical of the rest in recording a higher proportion of problem solving plus reading at this level than problem solving plus science.

Singapore, Shanghai and Ireland are the only three jurisdictions that score above 50% on all three of these combinations. However, the only jurisdictions that exceed the OECD averages in all three cases are Singapore, Hong Kong, Shanghai and Finland.

Table 6: PISA problem-solving: Percentage of students achieving proficiency level 5+ in domain-specific assessments

  PS + Ma PS + Sci PS + Re
Singapore 84.1 57.0 50.2
South Korea 73.5 34.1 40.3
Hong Kong 79.8 49.4 48.9
Shanghai 98.0 75.1 71.7
Taiwan 93.0 35.3 43.7
Canada 57.7 43.9 44.5
Australia 61.3 54.9 47.1
Finland 66.1 65.4 49.5
England (UK) 59.0 52.8 41.7
USA 54.6 46.9 45.1
Ireland 59.0 57.2 52.0
OECD Average 63.5 45.7 41.0

Chart 7: PISA Problem-solving: Percentage of students achieving proficiency level 5+ in domain-specific assessments

Problem solving chart 7.

What proportion of students achieve highly in one or more assessments?

Table 7 and Chart 8 below show how many students in each of my sample achieved proficiency level 5 or higher in problem-solving only, in problem solving and one or more assessments, in one or more assessments but not problem solving and in at least one assessment (ie the total of the three preceding columns).

I have also repeated in the final column the percentage achieving this proficiency level in each of maths, science and reading. (PISA has not released information about the proportion of students who achieved this feat across all four assessments.)

These reveal that the percentages of students who achieve proficiency level 5+ only in problem solving are very small, ranging from 0.3% in Shanghai to 6.7% in South Korea.

Conversely, the percentages of students achieving proficiency level 5+ in any one of the other assessments but not in problem solving are typically significantly higher, ranging from 4.5% in the USA to 38.1% in Shanghai.

There is quite a bit of variation in terms of whether jurisdictions score more highly on ‘problem solving and at least one other’ (second column) and ‘at least one other excluding problem solving (third column).

More importantly, the fourth column shows that the jurisdiction with the most students achieving proficiency level 5 or higher in at least one assessment is clearly Shanghai, followed by Singapore, Hong Kong, South Korea and Taiwan in that order.

The proportion of students achieving this outcome in Shanghai is close to three times the OECD average, comfortably more than twice the rate achieved in any of the ‘Western’ countries and three times the rate achieved in the USA.

The same is true of the proportion of students achieving this level in the three domain-specific assessments.

On this measure, South Korea and Taiwan fall significantly behind their Asian competitors, and the latter is overtaken by Australia, Finland and Canada.

 .

Table 7: Percentage achieving proficiency level 5+ in different combinations of PISA assessments

  PS only% PS + 1 or more% 1+ butNot PS% L5+ in at least one % L5+ in Ma + Sci + Re %
Singapore 4.3 25.0 16.5 45.8 16.4
South Korea 6.7 20.9 11.3 38.9 8.1
Hong Kong 3.4 15.9 20.5 39.8 10.9
Shanghai 0.3 17.9 38.1 56.3 19.6
Taiwan 1.2 17.1 20.4 38.7 6.1
Canada 5.5 12.0 9.9 27.4 6.5
Australia 4.7 12.0 7.7 24.4 7.6
Finland 3.0 12.0 11.9 26.9 7.4
England (UK) 4.4 9.8 6.8 21.0 5.7* all UK
USA 4.1 7.5 4.5 16.1 4.7
Ireland 2.6 6.8 10.1 19.5 5.7
OECD Average 3.1 8.2 8.5 19.8 4.4

Chart 8: Percentage achieving proficiency level 5+ in different combinations of PISA assessments

Problem solving chart 8

The Report comments:

The proportion of students who reach the highest levels of proficiency in at least one domain (problem solving, mathematics, reading or science) can be considered a measure of the breadth of a country’s/economy’s pool of top performers. By this measure, the largest pool of top performers is found in Shanghai-China, where more than half of all students (56%) perform at the highest levels in at least one domain, followed by Singapore (46%), Hong  Kong-China (40%), Korea and Chinese  Taipei (39%)…Only one OECD country, Korea, is found among the five countries/economies with the largest proportion of top performers. On average across OECD countries, 20% of students are top performers in at least one assessment domain.

The proportion of students performing at the top in problem solving and in either mathematics, reading or science, too can be considered a measure of the depth of this pool. These are top performers who combine the mastery of a specific domain of knowledge with the ability to apply their unique skills flexibly, in a variety of contexts. By this measure, the deepest pools of top performers can be found in Singapore (25% of students), Korea (21%), Shanghai-China (18%) and Chinese Taipei (17%). On average across OECD countries, only 8% of students are top performers in both a core subject and in problem solving.’

There is no explanation of why proficiency level 5 should be equated by PISA with the breadth of a jurisdiction’s ‘pool of top performers’. The distinction between proficiency levels 5 and 6 in this respect requires further discussion.

In addition to updated ‘all-rounder’ data showing what proportion of students achieved this outcome across all four assessments, it would be really interesting to see the proportion of students achieving at proficiency level 6 across different combinations of these four assessments – and to see what proportion of students achieving that outcome in different jurisdictions are direct beneficiaries of targeted support, such as a gifted education programme.

In the light of this analysis, what are jurisdictions’ priorities for improving  problem solving performance?

Leaving aside strengths and weaknesses in different elements of problem solving discussed above, this analysis suggests that the eleven jurisdictions in my sample should address the following priorities:

Singapore has a clear lead at proficiency level 6, but falls behind South Korea at level 5 (though Singapore re-establishes its ascendancy when levels 5 and 6 are considered together). It also has more level 1 performers than South Korea. It should perhaps focus on reducing the size of this tail and pushing through more of its mid-range performers to level 5. There is a pronounced imbalance in favour of boys at level 6, so enabling more girls to achieve the highest level of performance is a clear priority. There may also be a case for prioritising the children of semi-skilled workers.

South Korea needs to focus on getting a larger proportion of its level 5 performers to level 6. This effort should be focused disproportionately on girls, who are significantly under-represented at both levels 5 and 6. South Korea has a very small tail to worry about – and may even be getting close to minimising this. It needs to concentrate on improving the problem solving skills of its stronger performers in maths.

Hong Kong has a slightly bigger tail than Singapore’s but is significantly behind at both proficiency levels 5 and 6. In the case of level 6 it is equalled by Canada. Hong Kong needs to focus simultaneously on reducing the tail and lifting performance across the top end, where girls and weaker performers in maths are a clear priority.

Shanghai has a similar profile to Hong Kong’s in all respects, though with somewhat fewer level 6 performers. It also needs to focus effort simultaneously at the top and the bottom of the distribution. Amongst this sample, Shanghai has the worst under-representation of girls at level 5 and levels 5 and 6 together, so addressing that imbalance is an obvious priority. It also demonstrated the largest variation in performance against PISA’s IESC index, which suggests that it should target young people from disadvantaged backgrounds, as well as the children of semi-skilled workers.

Taiwan is rather similar to Hong Kong and Shanghai, but its tail is slightly bigger and its level 6 cadre slightly smaller, while it does somewhat better at level 5. It may need to focus more at the very bottom, but also at the very top. Taiwan also has a problem with high-performing girls, second only to Shanghai as far as level 5 and levels 5 and 6 together are concerned. However, like Shanghai, it does comparatively better than the other ‘Asian Tigers’ in terms of girls at level 6. It also needs to consider the problem solving performance of its weaker performers in maths.

Canada is the closest western competitor to the ‘Asian Tigers’ in terms of the proportions of students at levels 1 and 5 – and it already outscores Shanghai and Taiwan at level 6. It needs to continue cutting down the tail without compromising achievement at the top end. Canada also has small but significant gender imbalances in favour of boys at the top end.

Australia by comparison is significantly worse than Canada at level 1, broadly comparable at level 5 and somewhat worse at level 6. It too needs to improve scores at the very bottom and the very top. Australia’s gender imbalance is more pronounced at level 6 than level 5.

Finland has the same mean score as Australia’s but a smaller tail (though not quite as small as Canada’s). It needs to improve across the piece but might benefit from concentrating rather more heavily at the top end. Finland has a slight gender imbalance in favour of girls at level 5, but boys are more in the ascendancy at level 6 than in either England or the USA. As in Australia, this latter point needs addressing.

England has a profile similar to Australia’s, but less effective at all three selected proficiency levels. It is further behind at the top than at the bottom of the distribution, but needs to work hard at both ends to catch up the strongest western performers and maintain its advantage over the USA and Ireland. Gender imbalances are small but nonetheless significant.

USA has a comparatively long tail of low achievement at proficiency level 1 and, with the exception of Ireland, the fewest high achievers. This profile is very close to the OECD average. As in England, the relatively small size of gender imbalances in favour of boys does not mean that these can be ignored.

Ireland has the longest tail of low achievement and the smallest proportion of students at proficiency levels 5, 6 and 5 and 6 combined. It needs to raise the bar at both ends of the achievement distribution. Ireland has a larger preponderance of boys at level 6 than its Western competitors and this needs addressing. The limited socio-economic evidence suggests that Ireland should also be targeting the offspring of parents with semi-skilled and elementary occupations.

So there is further scope for improvement in all eleven jurisdictions. Meanwhile the OECD could usefully provide a more in-depth analysis of high achievers on its assessments that features:

  • Proficiency level 6 performance across the board.
  • Socio-economic disparities in performance at proficiency levels 5 and 6.
  • ‘All-rounder’ achievement at these levels across all four assessments and
  • Correlations between success at these levels and specific educational provision for high achievers including gifted education programmes.

.

GP

April 2014

Unpacking the Primary Assessment and Accountability Reforms

This post examines the Government response to consultation on primary assessment and accountability.

pencil-145970_640It sets out exactly what is planned, what further steps will be necessary to make these plans viable and the implementation timetable.

It is part of a sequence of posts I have devoted to this topic, most recently:

Earlier posts in the series include The Removal of National Curriculum Levels and the Implications for Able Pupils’ Progression (June 2012) and Whither National Curriculum Assessment Without Levels? (February 2013).

The consultation response contrives to be both minimal and dense. It is necessary to unpick each element carefully, to consider its implications for the package as a whole and to reflect on how that package fits in the context of wider education reform.

I have organised the post so that it considers sequentially:

  • The case for change, including the aims and core principles, to establish the policy frame for the planned reforms.
  • The impact on the assessment experience of children aged 2-11 and how that is likely to change.
  • The introduction of baseline assessment in Year R.
  • The future shape of end of KS1 and end of KS2 assessment respectively.
  • How the new assessment outcomes will be derived, reported and published.
  • The impact on floor standards.

Towards the end of the post I have also provided a composite ‘to do’ list containing all the declared further steps necessary to make the plan viable, with a suggested deadline for each.

And the post concludes with an overall judgement on the plans, in the form of a summary of key issues and unanswered questions arising from the earlier commentary. Impatient readers may wish to jump straight to that section.

I am indebted to Warwick Mansell for his previous post on this topic. I shall try hard not to parrot the important points he has already made, though there is inevitably some overlap.

Readers should also look to Michael Tidd for more information about the shape and content of the new tests.

What has been published?

The original consultation document ‘Primary assessment and accountability under the new national curriculum’ was published on 17 July 2013 with a deadline for response of 17 October 2013. At that stage the Government’s response was due ‘in autumn 2013’.

The response was finally published on 27 March, some four months later than planned and only five months prior to the introduction of the revised national curriculum which these arrangements are designed to support.

It is likely that the Government will have decided that 31 March was the latest feasible date to issue the response, so they were right up against the wire.

It was accompanied by:

  • A press release which focused on the full range of assessment reforms – for primary, secondary and post-16.

Shortly before the response was published, the reply to a Parliamentary question asked on 17 March explained that test frameworks were expected to be included within it:

‘Guidance on the nature of the revised key stage 1 and key stage 2 tests, including mathematics, will be published by the Standards and Testing Agency in the form of test framework documents. The frameworks are due to be released as part of the Government’s response to the primary assessment and accountability consultation. In addition, some example test questions will be made available to schools this summer and a full sample test will be made available in the summer of 2015.’ (Col 383W)

.

.

In the event, these documents – seven in all – did not appear until 31 March and there was no reference to any of the three commitments above in what appeared on 27 March.

Finally, the Standards and Testing Agency published on 3 April a guidance page on national curriculum tests from 2016. At present it contains very little information but further material will be added as and when it is published.

Partly because the initial consultation document was extremely ‘drafty’, the reaction of many key external respondents to the consultation was largely negative. One imagines that much of the period since 17 October has been devoted to finding the common ground.

Policy makers will have had to do most of their work after the consultation document issued because they were not ready beforehand.

But the length of the delay in issuing the response would suggest that they also encountered significant dissent amongst internal stakeholders – and that the eventual outcome is likely to be a compromise of sorts between these competing interests.

Such compromises tend to have observable weaknesses and/or put off problematic issues for another day.

A brief summary of consultation responses is included within the Government’s response. I will refer to this at relevant points during the discussion below.

 .

The Case for Change

 .

Aims

The consultation response begins – as did the original consultation document – with a section setting out the case for reform.

It provides a framework of aims and principles intended to underpin the changes that are being set in place.

The aims are:

  • The most important outcome of primary education is to ‘give as many pupils as possible the knowledge and skills to flourish in the later phases of education’. This is a broader restatement of the ‘secondary ready’ concept adopted in the original consultation document.
  • The primary national curriculum and accountability reforms ‘set high expectations so that all children can reach their potential and are well prepared for secondary school’. Here the ‘secondary ready’ hurdle is more baldly stated. The parallel notion is that all children should do as well as they can – and that they may well achieve different levels of performance. (‘Reach their potential’ is disliked by some because it is considered to imply a fixed ceiling for each child and fixed mindset thinking.)
  • To raise current threshold expectations. These are set too low, since too few learners (47%) with KS2 level 4C in both English and maths go on to achieve five or more GCSE grades A*-C including English and maths, while 72% of those with KS2 level 4B do so. So the new KS2 bar will be set at this higher level, but with the expectation that 85% of learners per school will jump it, 13% more than the current national figure. Meanwhile the KS4 outcome will also change, to achievement across eight GCSEs rather than five, quite probably at a more demanding level than the present C grade. In the true sense, this is a moving target.
  • No child should be allowed to fall behind’. This is a reference to the notion of ‘mastery’ in its crudest sense, though the model proposed will not deliver this outcome. We have noted already a reference to ‘as many children as possible’ and the school-level target – initially at least – will be set at 85%. In reality, a significant minority of learners will progress more slowly and will fall short of the threshold at the end of KS2.
  • The new system ‘will set a higher bar’ but ‘almost all pupils should leave primary school well-placed to succeed in the next phase of their education’. Another nuanced version of ‘secondary ready’ is introduced. This marks a recognition that some learners will not jump over the higher bar. In the light of subsequent references to 85%, ‘almost all’ is rather over-optimistic.
  • We also want to celebrate the progress that pupils make in schools with more challenging intakes’. Getting ‘nearly all pupils to meet this standard…’ (the standard of secondary readiness?) ‘…is very demanding, at least in the short term’. There will therefore be recognition of progress ‘from a low starting point’ – even though these learners have, by definition, been allowed to fall behind and will continue to do so.

So there is something of a muddle here, no doubt engendered by a spirit of compromise.

The black and white distinction of ‘secondary-readiness’ has been replaced by various verbal approximations, but the bottom line is that there will be a defined threshold denoting preparedness that is pitched higher than the current threshold.

And the proportion likely to fall short is downplayed – there is apparent unwillingness at this stage to acknowledge the norm that up to 15% of learners in each school will undershoot the threshold – substantially more in schools with ‘challenging intakes’.

What this boils down to is a desire that all will achieve the new higher hurdle – and that all will be encouraged to exceed it if they can – tempered by recognition that this is presently impossible. No child should be allowed to fall behind but many inevitably will do so.

It might have been better to express these aims in the form of future aspirations – and our collective efforts to bridge the gap between present reality and those ambitious aspirations.

Principles

The section concludes with a new set of principles governing pedagogy, assessment and accountability:

  • ‘Ongoing, teacher-led assessment is a crucial part of effective teaching;
  • Schools should have the freedom to decide how to teach their curriculum and how to track the progress that pupils make;
  • Both summative teacher assessment and external testing are important;
  • Accountability is key to a successful school system, and therefore must be fair and transparent;
  • Measures of both progress and attainment are important for understanding school performance; and
  • A broad range of information should be published to help parents and the wider public know how well schools are performing.’

These are generic ‘motherhood and apple pie’ statements and so largely uncontroversial. I might have added a seventh – that schools’ in-house assessment and reporting systems must complement summative assessment and testing, including by predicting for parents the anticipated outcomes of the latter.

Perhaps interestingly, there is no repetition of the defence for the removal of national curriculum levels. Instead, the response concentrates on the support available to schools.

It mentions discussion with an ‘expert group on assessment’ about ‘how to support schools to make best use of the new assessment freedoms’. We are not told the membership of this group (which, as far as I know, has not been made public) or the nature of its remit.

There is also a link to information about the Assessment Innovation Fund, which will provide up to 10 grants of up to £10,000 which schools and organisations can use to develop packages that share their innovative practice with others.


Children’s experience of assessment up to the end of KS2

The response mentions the full range of national assessments that will impact on children between the ages of two and 11:

  • The statutory progress check at two years of age.
  • A new baseline assessment undertaken within a few weeks of the start of Year R, introduced from September 2015.
  • An Early Years Foundation Stage Profile undertaken in the final term of the year in which children reach the age of five. A revised profile was introduced from September 2012. It is currently compulsory but will be optional from September 2016. The original consultation document said that the profile would no longer be moderated and data would no longer be collected. Neither of those commitments is repeated here.
  • The Phonics Screening Check, normally undertaken in Year 1. The possibility of making these assessments non-statutory for all-through primary schools, suggested in the consultation document, has not been pursued: 53% of respondents opposed this idea, whereas 32% supported it.
  • End of KS1 assessment and
  • End of KS2 assessment.

So a total of six assessments are in place between the ages of two and 11. At least four – and possibly five – will be undertaken between ages two and seven.

It is likely that early years’ professionals will baulk at this amount of assessment, no matter how sensitively it is designed. But the cost and inefficiency of the model is also open to criticism.

The Reception Baseline

Approach

The original consultation document asked whether:

  • KS1 assessment should be retained as a baseline – 45% supported this and 41% were opposed.
  • A baseline check should be introduced at the start of Reception – 51% supported this and 34% were opposed.
  • Such a baseline check should be optional – 68% agreed and 19% disagreed.
  • Schools should be allowed to choose from a range of commercially available materials for this baseline check – 73% said no and only 15% said yes.

So, whereas views were mixed on where the baseline should be set, there were substantial majorities in favour of any Year R baseline check being optional and following a single, standard national format.

The response argues that Year R is the most sensible point at which to position the baseline since that is:

‘…the earliest point that nearly all children are in school’.

What happens in respect of children who are not in school at this point is not discussed.

There is no explanation of why the Government has disregarded the clear majority of respondents by choosing to permit a range of assessment approaches, so this decision must be ideologically motivated.

The response says ‘most’ are likely to be administered by teaching staff, leaving open the possibility that some options will be administered externally.

Design

Such assessments will need to be:

‘…strong predictors of key stage 1 and key stage 2 attainment, whilst reflecting the age and abilities of children in Reception’.

Presumably this means predictors of attainment in each of the three core subjects – English, maths and science – rather than any broader notion of attainment. The challenge inherent in securing a reasonable predictor of attainment across these domains seven years further on in a child’s development should not be under-estimated.

The response points out that such assessment tools are already available for use in Year R, some are used widely and some schools have long experience of using them. But there is no information about how many of these are deemed to meet already the description above.

In any case, new criteria need to be devised which all such assessments must meet. Some degree of modification will be necessary for all existing products and new products will be launched to compete in the market.

There is an opportunity to use this process to ratchet up the Year R Baseline beyond current expectations, so matching the corresponding process at the end of KS2. The consultation response says nothing about whether this is on the cards.

Interestingly, in his subsequent ‘Unsure start’ speech about early years inspection, HMCI refers to:

‘…the government’s announcement last week that they will be introducing a readiness-for-school test at age four. This is an ideal opportunity to improve accountability. But I think it should go further.

I hope that the published outcomes of these tests will be detailed enough to show parents how their own child has performed. I fear that an overall school grade will fail to illuminate the progress of poor children. I ask government to think again about this issue.’

The terminology – ‘readiness for school’ is markedly blunter than the references to a reception baseline in the consultation response. There is nothing in the response about the outcomes of these tests being published, nor anything about ‘an overall school grade’.

Does this suggest that decisions have already been made that were not communicated in the consultation response?

.

Timeline, options, questions

Several pieces of further work are required in short order to inform schools and providers about what will be required – and to enable both to prepare for introduction of the assessments from September 2015. All these should feature in the ‘to do’ list below.

One might reasonably have hoped that – especially given the long delay – some attempt might have been made to publish suggested draft criteria for the baseline alongside the consultation response. The fact that even preliminary research into existing practice has not been undertaken is a cause for concern.

Although the baseline will be introduced from September 2015, there is a one-year interim measure which can only apply to all-through primary schools:

  • They can opt out of the Year R baseline measure entirely, relying instead on KS1 outcomes as their baseline; or
  • They can use an approved Year R baseline assessment and have this cohort’s progress measured at the end of KS2 (which will be in 2022) by either the Year R or the KS1 baseline, whichever demonstrates the most progress.

In the period up to and including 2021, progress will continue to be measured from the end of KS1. So learners who complete KS2 in 2021 for example will be assessed on progress since their KS1 tests in 2017.

Junior and middle schools will also continue to use a KS1 baseline.

Arrangements for infant and first schools are still to be determined, another rather worrying omission at this stage in proceedings.

It is also clear that all-through primary schools (and infant/first schools?) will continue to be able to opt out from the Year R baseline from September 2016 onwards, since the response says:

‘Schools that choose not to use an approved baseline assessment from 2016 will be judged on an attainment floor standard alone’.

Hence the Year R baseline check is entirely optional and a majority of schools could choose not to undertake it.

However, they would need to be confident of meeting the demanding 85% attainment threshold in the floor standard.

They might be wise to postpone that decision until the pitch of the progress expectation is determined. For neither the Year R baseline nor the amount of progress that learners are expected to make from their starting point in Year R is yet defined.

This latter point applies at the average school level (for the purposes of the floor standard) and in respect of the individual learner. For example, if a four year-old is particularly precocious in, say, maths, what scaled scores must they register seven years later to be judged to have made sufficient progress?

There are several associated questions that follow on from this.

Will it be in schools’ interests to acknowledge that they have precocious four year-olds at all? Will the Year R baseline reinforce the tendency to use Reception to bring all children to the same starting point in readiness for Year 1, regardless of their precocity?

Will the moderation arrangements be hard-edged enough to stop all-through primary schools gaming the system by artificially depressing their baseline outcomes?

Who will undertake this moderation and how much will it cost? Will not the decision to permit schools to choose from a range of measures unnecessarily complicate the moderation process and add to the expense?

The consultation response neither poses these questions nor supplies answers.

The future shape of end KS1 and end KS2 assessment

.

What assessment will take place?

At KS1 learners will be assessed in:

  • Reading – test plus teacher assessment
  • Writing – test (of grammar, punctuation and spelling) plus teacher assessment
  • Speaking and listening – teacher assessment
  • Maths – test plus teacher assessment
  • Science  – teacher assessment

The new test of grammar, punctuation and spelling did not feature in the original consultation and has presumably been introduced to strengthen the marker of progress to which four year-olds should aspire at age seven.

The draft test specifications for the KS1 tests in reading, GPS and maths outline the requirements placed on the test developers, so it is straightforward to compare the specifications for reading and maths with the current tests.

The GPS test will include a 20 minute written grammar and punctuation task; a 20 minute test comprising short grammar, punctuation and vocabulary questions; and a 15 minute spelling task.

There is a passing reference to further work on KS1 moderation which is included in the ‘to do’ list below.

At KS2 learners will be assessed in

  • Reading – test plus teacher assessment
  • Writing – test (of grammar spelling and punctuation) plus teacher assessment
  • Maths – test plus teacher assessment
  • Science  – teacher assessment plus a science sampling test.

Once again, the draft test specifications – reading, GPS, maths and science sampling – describe the shape of each test and the content they are expected to assess.

I will leave it to experts to comment on the content of the tests.

 .

Academies and free schools

It is important to note that the framing of this content – by means of detailed ‘performance descriptors’ – means that the freedom academies and free schools enjoy in departing from the national curriculum will be largely illusory.

I raised this issue back in February 2013:

  • ‘We know that there will be a new grading system in the core subjects at the end of KS2. If this were to be based on the ATs as drafted, it could only reflect whether or not learners can demonstrate that they know, can apply and understand ‘the matters, skills and processes specified’ in the PoS as a whole. Since there is no provision for ATs that reflect sub-elements of the PoS – such as reading, writing, spelling – grades will have to be awarded on the basis of separate syllabuses for end of KS2 tests associated with these sub-elements.
  • This grading system must anyway be applied universally if it is to inform the publication of performance tables. Since some schools are exempt from National Curriculum requirements, it follows that grading cannot be derived directly from the ATs and/or the PoS, but must be independent of them. So this once more points to end of KS2 tests based on entirely separate syllabuses which nevertheless reflect the relevant part of the draft PoS. The KS2 arrangements are therefore very similar to those planned at KS4.’

I have more to say about the ‘performance descriptors’ below.

 .

Single tests for all learners

A critical point I want to emphasise at this juncture – not mentioned at all in the consultation document or the response – is the test development challenge inherent in producing single papers suitable for all learners, regardless of their attainment.

We know from the response that the P-scales will be retained for those who are unable to access the end of key stage tests. (Incidentally, the content of the P-scales will remain unchanged so they will not be aligned with the revised national curriculum, as suggested in the consultation document.)

There will also be provision for pupils who are working ‘above the P-scales but below the level of the test’.

Now the P-scales are for learners working below level 1 (in old currency). This is the first indication I have seen that the tests may not cater for the full range from Level 1-equivalent to Level 6-equivalent and above. But no further information is provided.

It may be that this is a reference to learners who are working towards level 1 (in old currency) but do not have SEN.

The 2014 KS2 ARA booklet notes:

‘Children working towards level 1 of the national curriculum who do not have a special educational need should be reported to STA as ‘W’ (Working below the level). This includes children who are working towards level 1 solely because they have English as an additional language. Schools should use the code ‘NOTSEN’ to explain why a child working towards level 1 does not have P scales reported. ‘NOTSEN’ replaces the code ‘EAL’ that was used in previous years.’

The consultation document said:

‘We do not propose to develop an equivalent to the current level 6 tests, which are used to challenge the highest-attaining pupils. Key stage 2 national curriculum tests will include challenging material (at least of the standard of the current level 6 test) which all pupils will have the opportunity to answer, without the need for a separate test’.

The draft test specifications make it clear that the tests should:

‘provide a suitable challenge for all children and give every child the opportunity to achieve as high a standard…as possible.’

Moreover:

‘In order to improve general accessibility for all children, where possible, questions will be placed in order of difficulty.’

The development of single tests covering this span of attainment – from level 1 to above level 6 – tests in which the questions are posed in order of difficulty and even the highest attainers must answer all questions – seem to me to be a very tall order, especially in maths.

More than that, I urgently need persuading that this is not a waste of high attainers’ time and poor assessment practice.

 .

How assessment outcomes will be derived, reported and published

Deriving assessment outcomes

One of the reasons cited for replacing national curriculum levels was the complexity of the system and the difficulty parents experienced in understanding it.

The Ministerial response to the original report from the National Curriculum Expert Panel said:

‘As you rightly identified, the current system is confusing for parents and restrictive for teachers. I agree with your recommendation that there should be a direct relationship between what children are taught and what is assessed. We will therefore describe subject content in a way which makes clear both what should be taught and what pupils should know and be able to do as a result.’

The consultation document glossed the same point thus:

‘Schools will be able to focus their teaching, assessment and reporting not on a set of opaque level descriptions, but on the essential knowledge that all pupils should learn.’

However, the consultation response introduces for the first time the concept of a ‘performance descriptor’.

This term is defined in the glossaries at the end of each draft test specification:

Description of the typical characteristics of children working at a particular standard. For these tests, the performance descriptor will characterise the minimum performance required to be working at the appropriate standard for the end of the key stage.’

Essentially this is a collective term for something very similar to old-style level descriptions.

Except that, in the case of the tests, they are all describing the same level of performance.

They have been rendered necessary by the odd decision to provide only a single generic attainment target for each programme of study. But, as noted back in February 2013, the test developers need a more sophisticated framework on which to base their assessments.

According to the draft test specifications they will also be used

‘By a panel of teachers to set the standards on the new tests following their first administration in May 2016’.

When it comes to teacher assessment, the consultation response says:

‘New performance descriptors will be introduced to inform the statutory teacher assessments at the end of key stage one [and]…key stage two.’

But there are two models in play simultaneously.

In four cases – science at KS1 and reading, maths and science at KS2 – there will be ‘a single performance descriptor of the new expected standard’, in the same way as there are in the test specifications.

But in five cases – reading, writing, speaking and listening and maths at KS1; and writing at KS2 :

‘teachers will assess pupils as meeting one of several performance descriptors’.

These are old-style level descriptors by another name. They perform exactly the same function.

The response says that the KS1 teacher assessment performance descriptors will be drafted by an expert group for introduction in autumn 2014. It does not mention whether KS2 teacher assessment performance descriptors will be devised in the same way and to the same timetable.

 .

Reporting assessment outcomes to parents

When it comes to reporting to parents, there will be three different arrangements in play at both KS1 and KS2:

  • Test results will be reported by means of scaled scores (of which more in a moment).
  • One set of teacher assessments will be reported by selecting from a set of differentiated performance descriptors.
  • A second set of teacher assessments will be reported according to whether learners have achieved a single threshold performance descriptor.

This is already significantly more complex than the previous system, which applied the same framework of national curriculum levels across the piece.

It seems that KS1 test outcomes will be reported as straightforward scaled scores (though this is only mentioned on page 8 of the main text of the response and not in Annex B, which compares the new arrangements with those currently in place).

But, in the case of KS2:

‘Parents will be provided with their child’s score alongside the average for their school, the local area and nationally. In the light of the consultation responses, we will not give parents a decile ranking for their child due to concerns about whether decile rankings are meaningful and their reliability at individual pupil level.’

The consultation document proposed a tripartite reporting system comprising:

  • A scaled score for each KS2 test, derived from raw test marks and built around a ‘secondary readiness standard’. This standard would be set at a scaled score of 100, which would remain unchanged. It was suggested for illustrative purposes that a scale based on the current national curriculum tests might run from 80 to 130.
  • An average scaled score in each test for other pupils nationally with the same prior attainment at the baseline. Comparison of a learner’s scaled score with the average scaled score would show whether they had made more or less progress than the national average.
  • A national ranking in each test – expressed in terms of deciles – showing how a learner’s scaled score compared with the range of performance nationally.

The latter has been dispensed with, given that 35% of consultation respondents disagreed with it, but there were clearly technical reservations too.

In its place, the ‘value added’ progress measure has been expanded so that there is a comparison with other pupils in the learner’s own school and the ‘local area’ (which presumably means local authority). This beefs up the progression element in reporting at the expense of information about the attainment level achieved.

So at the end of KS2 parents will receive scaled scores and three average scaled scores for each of reading, writing and maths – twelve scores in all – plus four performance descriptors, of which three will be singleton threshold descriptors (reading, maths and science) and one will be selected from a differentiated series (writing). That makes sixteen assessment outcomes altogether, provided in four different formats.

The consultation response tells us nothing more about the range of the scale that will be used to provide scaled scores. We do not even know if it will be the same for each test.

The draft test specifications say that:

‘The exact scale for the scaled scores will be determined following further analysis of trialling data. This will include a full review of the reporting of confidence intervals for scaled scores.’

But they also contain this worrying statement:

‘The provision of a scaled score will aid in the interpretation of children’s performance over time as the scaled score which represents the expected standard will be the same year on year. However, at the extremes of the scaled score distribution, as is standard practice, the scores will be truncated such that above and below a certain point, all children will be awarded the same scaled score in order to minimise the effect for children at the ends of the distribution where the test is not measuring optimally.’

This appears to suggest that scaled scores will not accurately describe performance at the extremes of the distribution, because the tests will not accurately measure such performance. This might be describing a statistical truism, but it again begs the question whether the highest attainers are being short-changed by the selected approach.

.

Publication of assessment outcomes

The response introduces the idea that ‘a suite of indicators’ will be published on each school’s own website in a standard format. These are:

  • The average progress made by pupils in reading, writing and maths. (This is presumably relevant to both KS1 and KS2 and to both tests and teacher assessment.)
  • The percentage of pupils reaching the expected standard in reading, writing and mathematics at the end of key stage 2. (This is presumably relevant to both tests and teacher assessment.)
  • The average score of pupils in their end of key stage 2 assessments. (The final word suggests teacher assessment as well as tests, even though there will not be a score from the former.)
  • The percentage of pupils who achieve a high score in all areas at the end of key stage 2. (Does ‘all areas’ imply something more than statutory tests and teacher assessments? Does it mean treating each area separately, or providing details only of those who have achieved high scores across all areas?)

The latter is the only reference to high attainers in the entire response. It does not give any indication of what will count as a high score for these purposes. Will it be designed to catch the top-third of attainers or something more demanding, perhaps equivalent to the top decile?

A decision has been taken not to report the outcomes of assessment against the P-scales because the need to contextualise such information is perceived to be relatively greater.

And, as noted above, HMCI let slip the fact that the outcomes of reception baselines would also be published, but apparently in the form of a single overall grade.

We are not told when these requirements will be introduced, but presumably they must be in place to report the outcomes of assessments undertaken in spring 2016.

Additionally:

‘So that parents can make comparisons between schools, we would like to show each school’s position in the country on these measures and present these results in a manner that is clear for all audiences to understand. We will discuss how best to do so with stakeholders, to ensure that the presentation of the data is clear, fair and statistically robust.’

This suggests inclusion in the 2016 School Performance Tables, but this is not stated explicitly.

Indeed, apart from references to the publication of progress measures in the 2022 Performance Tables, there is no explicit coverage of their contribution in the response, nor any reference to the planned supporting data portal, or how data will be distributed between the Tables and the portal.

The original consultation document gave several commitments on the future content of performance tables. They included:

  • How many of a school’s pupils are amongst the highest attaining nationally, by showing the percentage of pupils achieving a high scaled score in each subject.
  • Measures to show the attainment and progress of learners attracting the Pupil Premium.
  • Comparison of each school’s performance with that of schools with similar intakes.

None are mentioned here, nor are any of the suggestions advanced by respondents taken up.

Floor standards

Changes are proposed to the floor standards with effect from September 2016.

This section of the response begins by committing to:

‘…a new floor standard that holds schools to account both on the progress that they make and on how well their pupils achieve.’

But the plans set out subsequently do not meet this description.

The progress element of the current floor standard relates to any of reading, writing or mathematics but, under the new floor standard, it will relate to all three of these together.

An all-though primary school must demonstrate that:

‘…pupils make sufficient progress at key stage 2 from their starting point…’

As we have noted above, all-through primaries can opt to use the KS1 baseline or the Year R baseline in 2015. Moreover, from 2016 they can choose not to use the Year R baseline and be assessed solely on the attainment measure in the floor standards (see below).

Junior and middle schools obviously apply the KS1 baseline, while arrangements for infant and first schools have yet to be finalised.

What constitutes ‘sufficient progress’ is not defined. Annex C of the response says:

‘For 2016 we will set the precise extent of progress required once key stage 2 tests have been sat for the first time.’

Presumably this will be progress from KS1 to KS2, since progress from the Year R baseline will not be introduced until 2023.

The attainment element of the new floor standards is for schools to have 85% or more of pupils meeting the new, higher threshold standard at the end of KS2 in all of reading, writing and maths. The text says explicitly that this threshold is ‘similar to a level 4b under the current system’.

Annex C clarifies that this will be judged by the achievement of a scaled score of 100 or more in each of the reading and maths tests, plus teacher assessment that learners have reached the expected standard in writing (so the GPS test does not count in the same way, simply informing the teacher assessment).

As noted above, this a far bigger ask than the current reference to 65% of learners meeting the expected (and lower 4c) standard. The summary at the beginning of the response refers to it as ‘a challenging aspiration’:

‘Over time we expect more and more schools to achieve this standard.’

The statement in the first paragraph of this section of the response led us to believe that these two requirements – for progress and attainment respectively – would be combined, so that schools would be held account for both (unless, presumably, they exercised their right to opt out of the Year R baseline assessment).

But this is not the case. Schools need only achieve one or the other.

It follows that schools with a very high performing intake may exceed the floor standards on the basis of all-round high attainment alone, regardless of the progress made by their learners.

The reason for this provision is unclear, though one suspects that schools with an extremely high attaining intake, whether at Reception or Year 3, will be harder pressed to achieve sufficient progress, presumably because some ceiling effects come into play at the end of KS2.

This in turn might suggest that the planned tests do not have sufficient headroom for the highest attainers, even though they are supposed to provide similar challenge to level 6 and potentially extend beyond it.

Meanwhile, schools with less than stellar attainment results will be obliged to follow the progress route to jump the floor standard. This too will be demanding because all three domains will be in play.

There will have been some internal modelling undertaken to judge how many schools would be likely to fall short of the floor standards given these arrangements and it would be very useful to know these estimates, however unreliable they prove to be.

In their absence, one suspects that the majority of schools will be below the floor standards, at least initially. That of course materially changes the nature and purpose of the standards.

To Do List

The response and the draft specifications together contain a long list of work to be carried out over the next two years or so. I have included below my best guess as to the latest possible date for each decision to be completed and communicated:

  • Decide how progress will be measured for infants and first schools between the Year R baseline and the end of KS1 (April 2014)
  • Make available to schools a ‘small number’ of sample test questions for each key stage and subject (Summer 2014)
  • Work with experts to establish the criteria for the Year R baseline (September 2014)
  • KS1 [and KS2?] teacher assessment performance descriptors to be drafted by an expert group (September 2014)
  • Complete and report outcomes of a study with schools that already use Year R baseline assessments (December 2014)
  • Decide how Year R baseline assessments will be moderated (December 2014)
  • Publish a list of assessments that meet the Year R baseline criteria (March 2015)
  • Decide how Year R baseline results will be communicated to parents and to Ofsted (March 2015)
  • Make available to schools a full set of sample materials including tests and mark schemes for all KS1 and KS2 tests (September 2015)
  • Complete work with Ofsted and Teachers to improve KS1 moderation (September 2015)
  • Provide further information to enable teachers to assess pupils at the end of KS1 and KS2 who are ‘working above the P-scales but below the level of the test’ (September 2015)
  • Decide whether to move to external moderation of P-scale teacher assessment (September 2015)
  • Agree with stakeholders how to compare schools’ performance on a suite of assessment outcomes published in a standard format (September 2015)
  • Publish all final test frameworks (Autumn 2015)
  • Introduce new requirements for schools to publish a suite of assessment outcomes in a standard format (Spring 2016)
  • Panels of teacher use level descriptors to set the standards on the new tests following their first administration in May 2016 (Summer 2016)
  • Define what counts as sufficient progress from the Year R baseline to end KS1 and end KS2 respectively (Summer 2016)

Conclusion

Overall the response is rather more cogent and coherent than the original consultation document, though there are several inconsistencies and many sins of omission.

Drawing together the key issues emerging from the commentary above, I would highlight twelve key points:

  • The declared aims express the policy direction clumsily and without conviction. The ultimate aspirations are universal ‘secondary readiness’ (though expressed in broader terms), ‘no child left behind’ and ‘every child fulfilling their potential’ but there is no real effort to reconcile these potentially conflicting notions into a consensual vision of what primary education is for. Moreover, an inconvenient truth lurks behind these statements. By raising expectations so significantly – 4b equivalent rather than 4c; 85% over the attainment threshold rather than 65%; ‘sufficient progress’ rather than median progress and across three domains rather than one – there will be much more failure in the short to medium term. More learners will fall behind and fall short of the thresholds; many more schools are likely to undershoot the floor standards. It may also prove harder for some learners to demonstrate their potential. It might have been better to acknowledge this reality and to frame the vision in terms of creating the conditions necessary for subsequent progress towards the ultimate aspirations.
  • Younger children are increasingly caught in the crossbeam from the twin searchlights of assessment and accountability. HMCI’s subsequent intervention has raised the stakes still further. This creates obvious tensions in the sector which can be traced back to disagreements over the respective purposes of early years and primary provision and how they relate to each other. (HMCI’s notion of ‘school readiness’ is no doubt as narrow to early years practitioners as ‘secondary readiness’ is to primary educators.) But this is not just a theoretical point. Additional demands for focused inspection, moderation and publication of outcomes all carry a significant price tag. It must be open to question whether the sheer weight of assessment activity is optimal and delivers value for money. Should a radical future Government – probably with a cost-cutting remit – have rationalisation in mind?
  • Giving schools the freedom to choose from a range of Year R baseline assessment tools also seems inherently inefficient and flies in the face of the clear majority of consultation responses. We are told nothing of the perceived quality of existing services, none of which can – by definition – satisfy these new expectations without significant adjustment. It will not be straightforward to construct a universal and child-friendly instrument that is a sufficiently strong predictor of Level 4b-equivalent performance in KS2 reading, writing and maths assessments undertaken seven years later. Moreover, there will be a strong temptation for the Government to pitch the baseline higher than current expectations, so matching the  realignment at the other end of the process. Making the Reception baseline assessment optional – albeit with strings attached – seems rather half-hearted, almost an insurance against failure. Effective (and expensive) moderation may protect against widespread gaming, but the risk remains that Reception teachers will be even more predisposed to prioritise universal school readiness over stretching their more precocious four year-olds.
  • The task of designing an effective test for all levels of prior attainment at the end of key stage 2 is equally fraught with difficulty. The P-scales will be retained (in their existing format, unaligned with the revised national curriculum) for learners with special needs working below the equivalent of what is currently level 1. There will also be undefined provision ‘for those working above the level of the P-scales but below the level of the test’, even though the draft test development frameworks say:

‘All eligible children who are registered at maintained schools, special schools, or academies (including free schools) in England and are at the end of key stage 2 will be required to take the…test, unless they have taken it in the past.’

And this applies to all learners other than those in the exempted categories set out in the ARA booklets. The draft specifications add that test questions will be placed in order of difficulty. I have grave difficulty in understanding how such assessments can be optimal for high attainers and fear that this is bad assessment practice.

  • On top of this there is the worrying statement in the test development frameworks that scaled scores will be ‘truncated’ at the extremes of the distribution’. This does not fill one with confidence that the highest and lowest attainers will have their test performance properly recognised and reported.
  • The necessary invention of ‘performance descriptors’ removes any lingering illusion that academies and free schools have significant freedom to depart from the national curriculum, at least as far as the core subjects are concerned. It is hard to understand why these descriptors could not have been published alongside the programmes of study within the national curriculum.
  • The ‘performance descriptors’ in the draft test specifications carry all sorts of health warnings that they are inappropriate for teacher assessment because they cover only material that can be assessed in a written test. But there will be significant overlap between the test and teacher assessment versions, particularly in those that describe threshold performance at the equivalent of level 4b. For we know now that there will also be hierarchies of performance descriptors – aka level descriptors – for KS1 teacher assessment in reading, writing, speaking and listening and maths, as well as for KS2 teacher assessment in writing. Levels were so problematic that it has been necessary to reinvent them!
  • What with scaled scores, average scaled scores, threshold performance descriptors and ‘levelled’ performance descriptors, schools face an uphill battle in convincing parents that the reporting of test outcomes under this system will be simpler and more understandable. At the end of KS2 they will receive 16 different assessments in four different formats. (Remember that parents will also need to cope with schools’ approaches to internal assessment, which may or may not align with these arrangements.)
  • We are told about new requirements to be placed on schools to publish assessment outcomes, but the description is infuriatingly vague. We do not know whether certain requirements apply to both KS1 and 2, and/or to both tests and teacher assessment. The reference to ‘the percentage of pupils who achieve a high score in all areas at the end of key stage 2’ is additionally vague because it is unclear whether it applies to performance in each assessment, or across all assessments combined. Nor is the pitch of the high score explained. This is the only reference to high attainers in the entire response and it raises more questions than it answers.
  • We also have negligible information about what will appear in the school performance tables and what will be relegated to the accompanying data portal. We know there is an intention to compare schools’ performance on the measures they are required to publish and that is all. Much of the further detail in the original consultation document may or may not have fallen by the wayside.
  • The new floor standards have all the characteristics of a last-minute compromise hastily stitched together. The consultation document was explicit that floor standards would:

‘…focus on threshold attainment measures and value-added progress measures’

It anticipated that the progress measure would require average scaled scores of between 98.5 and 99.0 adding:

‘Our modelling suggests that a progress measure set at this level, combined with the 85% threshold attainment measure, would result in a similar number of schools falling below the floor as at present.’

But the analysis of responses fails to report at all on the question ‘Do you have any comments about these proposals for the Department’s floor standards?’ It does include the response to a subsequent question about including an average point score attainment measure in the floor standards (39% of respondents were in favour of this against 31% against). But the main text does not discuss this option at all. It begins by stating that both an attainment and a progress dimension are in play, but then describes a system in which schools can choose one or the other. There is no attempt to quantify ‘sufficient progress’ and no revised modelling of the impact of standards set at this level. We are left with the suspicion that a very significant proportion of schools will not exceed the floor. There is also a potential perverse incentive for schools with very high attaining intakes not to bother about progress at all.

  • Finally, the ‘to do’ list is substantial. Several of those with the tightest deadlines ought really to have been completed ahead of the consultation response, especially given the significant delay. There is nothing about the interaction between this work programme and that proposed by NAHT’s Commission on Assessment. Much of this work would need to take place on the other side of a General Election, while the lead time for assessing KS2 progress against a Year R baseline is a full nine years. This makes the project as a whole particularly vulnerable to the whims of future governments.

I’m struggling to find the right description for the overall package. I don’t think it’s quite substantial or messy enough to count as a dog’s breakfast. But, like a poorly airbrushed portrait, it flatters to deceive. Seen from a distance it appears convincing but, on closer inspection, there are too many wrinkles that have not been properly smoothed out

GP

April 2014


What Has Become of the European Talent Network? Part Two

 .

This is the second and concluding part of a post about progress by the European Talent Centre towards a European Talent Network.

EU flag CapturePart One:

  • Provided an updated description of the Hungarian model for talent support and its increasingly complex infrastructure.
  • Described the origins of the European Talent project and how its scope and objectives have changed since its inception and.
  • Outlined the project’s initial advocacy effort within the European Commission.

This second episode describes the evolution of the model for the European Network, continues the history of its advocacy effort and reviews the progress Flag_of_Hungarymade by the European Centre in Budapest towards achieving its aims.

It concludes with an overall assessment of progress that highlights some key fault lines and weaknesses that, if addressed, would significantly improve the chances of overall success.

Initial Efforts to Design the European Network

A Draft Talent Points Plan 

At the 2012 ECHA Conference in Munster, a draft ‘Talent Points Plan’ was circulated which set out proposed criteria for EU Talent Points.

The following entities qualify for inclusion on the EU Talent Map:

  • ‘an already existing at least 2 year-old network connected to talent support
  • organizations/institutions focusing mainly on talent support: research, development, identification (eg schools, university departments, talent centers, excellence centers etc)
  • policy makers on national or international level (ministries, local authorities)
  • NGOs
  • business corporation with talent management programs (talent identification, corporate responsibility programs, creative climates)
  • parent organizations of gifted and talented children.’

But only organisations count as EU Talent Points. Each:

  • ‘has a strategy/action plan connected to talent (identification, support, research, carrier planning, etc…)
  • is willing to share at least one best/good practice, research results, video
  • is willing to share information on talent support (programs, conferences, talent days)
  • is open to be visited by other network members
  • is open to cooperate
  • accepts English as a common language while communicating in the network
  • is willing to update the data of home page 2 times/year.’ [sic]

My feedback on this draft urged a more flexible, inclusive approach – similar to what had been proposed earlier – as well as an online consultation of stakeholders to find out what they wanted from the Centre and the wider network.

Curiously, the ‘Towards a European Talent Support Network’ publication that was also distributed at the Conference took a somewhat different line, suggesting a more distributed network in which each country has its own Talent Support Centre:

‘The Talent Support Centres of the European countries could serve as regional hubs of this network building a contact structure going beyond their own country, while the core elements of our unique network could be the so-called European Talent Points… European Talent Centres are proposed to be registered by the Committee of the European Council of High Ability… A European Talent Centre should be an organization or a distinct part of a larger organization established for this purpose.

This is a pronounced shift from the ‘networked hubs’ proposed previously.

The publication goes on to set out ‘proposed requirements for a European Talent Centre’. Each:

  • ‘has an expertise of at least one year to coordinate the talent support activity of minimum 10 thousand persons 
  • has minimum two full-time employees who are dedicated to the tasks listed below 
  • is able to provide high quality information on theoretical and practical issues of gifted education and talent support
  • is able to keep records on the talent support activity of its region including the registration, help and coordination of European Talent Points and making this information available on the web (in the form of a Talent Support Map of the region)
  • is willing to cooperate with other European Talent Centres and with ECHA
  • is willing and able to coordinate joint actions, international events, Talent Days and other meetings in the field of talent support
  • is open to be visited by representatives, experts, talented young people of other European Talent Centres
  • is able to help and influence decisions on regional, national and/or European policies concerning the gifted and talented.’

The document also offers an alternative version of the criteria for European Talent Points.

Whereas the draft I began with specified that only organisations could be placed on the EU Talent Map, this version offers a more liberal interpretation, saying that Talent Points may be:

  • ‘organizations/institutions focusing mainly on talent support: research, development, identification (e. g: schools, university departments, talent centres, excellence centres, NGOs, etc.)
  • talent-related policy makers on national or international level [sic] (ministries, local authorities)
  • business corporation with talent management programs (talent identification, corporate responsibility programs, creative climate)
  • organizations of gifted and talented people
  • organizations of parents of gifted and talented children, or
  • umbrella organization (network) of organizations of the above types’

Talent points are to be registered (not accredited) by the appropriate European talent centres, but it appears that the centres would not enjoy discretion in such matters because there is a second set of proposed requirements:

  • ‘Has a strategy/action plan connected to talent (identification, support, research, career planning, etc.)
  • Is able and willing to share information on its talent support practices and other talent-related matters with other European Talent Points (programs, conferences, Talent Days) including sending the necessary data to a European Talent Centre and sharing at least one best practice/research result on the web
  • Is open to cooperate with other European Talent Points including the hosting of visiting representatives, talented young people from other European Talent Points.’

 .

Problems with the Talent Points Plan

‘Towards a European Talent Support Network’ stipulates – for no apparent reason – that a European Talent Centre has to be an organisation or part of an organisation established specifically for this purpose. It cannot be subsumed seamlessly into the existing responsibilities of an organisation.

There is no reference to funding to cover the cost of this activity, so that is presumably to be provided, or at least secured, by the organisation in question.

The criteria for European centres seem to be seeking to clone the Budapest Centre. To locate one in every European country – so roughly 50 countries – would be a tall order indeed, requiring a minimum of 100FTE employees.

The impact on the role and responsibilities of the Budapest Centre is not discussed. What would it do in this brave new world, other than to cover Hungary’s contribution to the network?

The only justification for ECHA’s involvement is presumably the reference earlier in ‘Towards a European Talent Support Network’:

‘Stemming from its traditions – and especially due to its consultative status as a non-governmental organization (NGO) at the Council of Europe –ECHA has to stand in the forefront in building a European Talent Support Network; a network of all people involved in talent support.’

ECHA News carries a report of the minutes of an ECHA committee meeting held in April 2013:

‘It was suggested that ECHA should be an accrediting organization for European Talent Centres and Talent Points. In the following discussion it was concluded that (1) it might be possible to establish a special accrediting committee; (2) Talent Centres would decide where Talent Points can be; (3) the proposal for European Talent Centres and European Talent Points criteria would be sent to additional key ECHA members (including National Correspondents) as discussion material. Criteria will be decided later.’

So ECHA would have control of the decision which entities could become European Talent Centres. This is despite the fact that ECHA is an entirely separate membership organisation with no formal responsibility for the EU Talent initiative.

This is not a sensible arrangement.

There is no explanation of why the network itself could not accredit its own members.

Turning back to the proposed requirements for European talent centres, these must be minimum requirements since there would otherwise be no need for an accreditation committee to take decisions.

Presumably the committee might impose its own additional criteria, to distinguish, for example, between two competing proposals for the same region.

The requirement for a year’s experience in relation to ‘co-ordinating’ talent support activity for at least 10,000 people is not explained. What exactly does it mean?

It might have been better to avoid quantitative criteria altogether. Certainly it is questionable whether even the present centre in Budapest meets this description.

And why the attempt to control inputs – the reference to at least two full-time staff – rather than outcomes? Surely the employment of sufficient staff is a matter that should be left to the centre’s discretion entirely.

The broad idea of a distributed network rather than a Budapest-centred network is clearly right, but the reasoning that puts ECHA in a controlling position with regard to the network is out of kilter with that notion, while the criteria themselves are inflexible and unworkable, especially since there is no budget attached to them.

When it comes to the talent points there are clear conflicts between the two versions. The first set of criteria outlined above is the more onerous. They propose an exclusive – rather than illustrative – list of those that can be included on the EU Talent Map.

Additionally they add that existing networks can feature on the map, but only if they are at least two years old! And they stipulate an additional English language requirement and biannual updating of their website homepage.

Only an entity with some serious difficulties could manage to share two sets of different draft criteria – each with its own profound problems – at precisely the same time!

Hungary budapest by night

Budapest by Night

.

The EU Advocacy Effort Continues

.

What Became of the Written Declaration?

Written Declarations are designed to stimulate debate. Once submitted by MEPs they are printed in all official EU languages and entered into a register. There is then a three month window in which other MEPs may sign them.

Those attracting signatures from a majority of MEPs are announced by the President in a plenary session of the European Parliament and forwarded for consideration to the bodies named in the text.

Those that do not attract sufficient signatures officially lapse.

.

The archive of written declarations shows that – despite the revisions outlined above and the best efforts of all those lobbying (including me) – WD 0034/2012 lapsed on 20 February 2013 having attracted 178 signatures. Since there are some 750 MEPs, that represents less than 25% of the total.

 .

A Parliamentary Hearing

As part of this ultimately unsuccessful lobbying effort, the Hungarian MEP who – along with three colleagues – submitted the Written Declaration also hosted a Parliamentary Hearing on the support of talents in the European Union.

The programme lists the speakers as:

  • Anneli Pauli, a Finn, formerly a Deputy Director General of the European Commission’s Research and Innovation Directorate.
  • Laszlo Andor, a Hungarian and EU Commissioner for employment, social affaris and inclusion. (Any contribution he made to the event is not included in the record, so he may or may not have been there.)
  • Peter Csermely. The current ECHA President and the man behind the EU Talent Centre.

There was no-one from the Commission’s Education Directorate involved.

The record of proceedings makes interesting reading, highlighting the Written Declaration, the economic value of talent development to the EU, the contribution it can make to research and innovation, the scope to support the inclusion of immigrants and minorities and the case for developing the European network.

Pauli is reported as saying that:

‘Talents are the heart of the future EU’s research area, thus they will work hard on it that the Horizon 2020 will offer enough support to them.’ [sic]

Horizon 2020 is the EU Framework Programme for Research and Innovation. There is no explicit home for talent support within the framework of the Horizon 2020 programme, so it remains to be seen how this will materialise in practice.

She also says:

‘…that school education on talents and the creative education in school sciences should be strengthened’ [sic]

This presumably carried rather less authority considering her role – and considering that, as we have seen, the Declaration was framed exclusively in terms of ‘non-formal learning’.

There is little explicit reference to the specifics of the European Talent project other than that:

‘…EU-wide talent-support units are needed, Europren [sic] Talent Points Network, a European Talent Day could be organised, or even a Year of Excellence and Talents could be implemented in the future too.’

We are not told how well attended the hearing was, nor do we have any information about its influence.

Only 13 more MEPs signed the WD between the Hearing and the deadline, and that was that.

An EU Thematic Working Group on Talent Support?

The 2013 publication ‘Towards a European Talent Support Network’ puts the best possible spin on the Written Declaration and the associated Hearing.

It then continues:

‘Confirming the importance of WD 34/2012, an EU Thematic Working Group on supporting talent and creativity was initiated by Prof. Péter Csermely. As a starting activity, the EU Thematic Working Group will work out the detailed agenda of discussions and possible EU member state co-operation in the area of talent support. This agenda may include items like:

  • Mutual information on measures to promote curricular and extra-curricular forms of talent support, including training for educational professionals to recognise and help talent;
  • Consideration of the development of an EU member state talent support network bringing together talent support communities, Talent Points and European Talent Centres in order to facilitate co-operation and the development and dissemination of the best talent support practices in Europe;
  • Consideration of celebration of the European Day of Talented;
  • Suggestions to the Commission to include talent support as a priority in future European strategies, such as the strategies guiding the European Research Area and the European Social Fund.’

The proposed status of this group is not discussed, so it is unclear whether it will be an expert group under the aegis of the Commission, or an independent group established with funding from Erasmus Plus or another EU programme.

If it is the latter, we will have to wait some time for it to be established; if it is the former, it does not yet feature in the Commission’s Register.

In either case, we are some nine months on from the publication of the document that brought us this news and there is still no indication of whether this group exists, when it will start work or who its membership is/will be.

 .

A European Economic and Social Committee (EESC) Opinion

At about the same time as a draft Written Declaration was circulated in January 2012, the Bureau of the EU’s European Economic and Social Committee was recommending that the Committee proper should undertake a fresh programme of ‘own initiative opinions’ (so the weakest category of NLA).

These included:

‘Unleashing the potential of young people with high intellectual abilities in the European Union’

Although the development process was undertaken during 2012, the final opinion was not published until January 2013.

The EESC describes itself thus:

‘The European Economic and Social Committee (EESC) is a consultative body that gives representatives of Europe’s socio-occupational interest groups and others, a formal platform to express their points of views on EU issues. Its opinions are forwarded to the Council, the European Commission and the European Parliament.’

Its 353 members are nominated by member governments and belong to an employers’ group, a workers’ group or a ‘various interests’ group. There are six sections, one of which is ‘Employment, Social Affairs and Citizenship’ (SOC).

EESC opinions are prepared by study groups which typically comprise 12 members including a rapporteur. Study groups may make use of up to four experts.

I cannot trace a relationship between the EESC’s opinion and the European Talent initiative.

The latter’s coverage does not mention any involvement and there is no information on the EU side about who prompted the process.

The focus of the opinion – high intellectual ability – is markedly out of kilter with the broader talent focus of the Talent Network, so it is highly likely that this activity originated elsewhere.

If that is the case then we can reasonably conclude that the European Talent initiative has not fulfilled its original commitment to an NLA.

Diligent online researchers can trace the development of this Opinion from its earliest stages through to eventual publication. There is a database of the key documents and also a list of the EESC members engaged in the process.

As far as I can establish the group relied on a single expert – one Jose Carlos Gibaja Velazquez, who is described as Subdirección General de Centros de Educación Infantil, Primaria y Especial Comunidad de Madrid’.

The link between JCBV and the EESC is explained here (translation into English here). I can find no link between Senor Gibaja and the EU Talent Network.

EESC members of the study group were:

  • Beatrice Quin France)
  • Teresa Tsizbierek (Pol)

An Early Draft of the Opinion

The earliest version of the Opinion is included an information memo dated 7 January. This also cites the significance of the Europe 2020 Strategy:

‘One of the top priorities of the Europe 2020 Strategy is to promote smart growth, so that knowledge and innovation become the two key drivers of the European economy. In order to reach this goal, it is essential that the European Union take advantage of the potential of the available human capital, particularly of young people with high intellectual capacities, who make up around 3% of the population.’

But it is clearly coming from a different perspective to the EU Talent Centre, which isn’t mentioned.

The ‘gist of the opinion’ at this early stage is as follows:

‘The EESC recommends that the European Commission and the Member States support further studies and research that would tap the potential of gifted children and young people in a wide variety of fields, aiming to facilitate employment and employability within the framework of the EU and, in a context of economic crisis, enhance specialist knowledge and prevent brain drain;

  • The Committee recommends that, in the future, greater consideration be given to each Member State’s existing models for and experience in working with highly gifted children, particularly those which benefit all of society, facilitate cohesion, reduce school failure and encourage better education in accordance with the objectives of the Europe 2020 strategy;
  • The Committee proposes improving educational care for children and young people with high abilities, in terms of the following aspects:

–          initial and ongoing training of teaching staff regarding the typical characteristics of highly able students, as well as the detection and educational care they need;

–          pooling of procedures for the early detection of high intellectual abilities among students in general and in particular among those from disadvantaged social backgrounds;

–          designing and implementing educational measures aimed at students with high intellectual abilities;

–          incorporating into teacher training the values of humanism, the reality of multiculturalism, the educational use of ICT and, lastly, the encouragement of creativity, innovation and initiative.’

Mount Bel Stone courtesy of Horvabe

Mount Bel Stone courtesy of Horvabe

.

What the Opinion Eventually Recommended

The final version of the Opinion was discussed by the EESC at its meeting on 16 January 2013 and was adopted ‘by 131 votes in favour, none against, with 13 abstentions’.

The analysis contained in the Opinion is by no means uncontentious and a close analysis would generate a long list of reservations. But this would be oblique to the issue under discussion.

The recommendations are as follows (my emboldening):

‘The European Economic and Social Committee is aware that the issue of children and young people with high intellectual abilities has been fairly well researched, as a result of the studies conducted over the last decades and the extensive corpus of specialist scientific literature. However, given the importance of this topic, the EESC recommends that the European Commission and the Member States support further studies and research and adopt suitable measures to cater for diversity among all types of people. These should include programmes that would tap the potential of gifted children and young people in a wide variety of fields. The aims of this action would include facilitating employment and employability within the framework of the EU and, in a context of economic crisis, enhancing specialist knowledge and preventing brain drain to other parts of the world.

The Committee proposes nurturing the development and potential of children and young people with high abilities throughout the various stages and forms of their education, avoiding premature specialisation and encouraging schools to cater for diversity, and exploiting the possibilities of cooperative and non-formal learning.

The Committee recommends fostering education and lifelong learning, bearing in mind that each individual’s intellectual potential is not static but evolves differently throughout the various stages of his or her life.

The Committee recommends that, in the future, greater consideration be given to each Member State’s existing models for and experience in working with highly gifted children, particularly those which benefit all of society, facilitate cohesion, reduce school failure and encourage better education in accordance with the objectives of the Europe 2020 strategy.

The Committee highlights the need to detect, in the workplace, those workers (particularly young workers) who are able and willing to develop their intellectual capabilities and contribute to innovation, and to give them the opportunity to further their education in the field that best matches their ambitions and centres of interest.

The Committee proposes improving educational care for children and young people with high abilities, in terms of the following aspects:

  • initial and ongoing training of teaching staff regarding the typical characteristics of highly able students, as well as the detection and educational care they need;
  • pooling of procedures for the early detection of high intellectual abilities among students in general and in particular among those from disadvantaged social backgrounds;
  • designing and implementing educational measures aimed at students with high intellectual abilities. These measures should include actions inside and outside ordinary educational establishments;
  • incorporating into teacher training the values of humanism, the reality of multiculturalism, the educational use of ICT and, lastly, the encouragement of creativity, innovation and initiative.

Improving the care provided for highly able students should include their emotional education (which is particularly important during adolescence), the acquisition of social skills with a view to facilitating integration and inclusion in society, integration into the labour market, and fostering their teamwork skills.

Schemes and procedures for student exchanges and visits abroad should be tapped into so that gifted students can take part in them, particularly those from disadvantaged backgrounds.

Opportunities for exchanging information and good practices on detecting and caring for gifted students should be harnessed across the EU Member States.

Entrepreneurship should be fostered among children and young people with high abilities, with a view to encouraging responsibility and solidarity towards society overall.

 .

More than One Opinion?

I have devoted significant attention to this apparently unrelated initiative because it shows that the EU lobbying effort in this field is poorly co-ordinated and pursuing substantively different objectives.

The EU Talent project failed to secure the NLA it was pursuing, but someone else has exploited the same route to influence – and for substantially different purposes.

What is worse, the EU Talent lobby seems to have failed entirely to secure any cross-reference to their efforts, despite there being two Hungarians on the study group. Did they try and fail or didn’t they try at all?

Perhaps fortunately, the Opinion seems to have been as influential as the Written Declaration. One wonders whether the enormous energy and time invested in each of these processes was ultimately worthwhile.

 .

What progress has been made by the European Talent Project?

. 

The Mission Has Changed

The website version of the Centre’s mission is subtly different from the original version discussed earlier in this post

The Centre now seeks:

  • ‘to provide talent support an emphasis commensurate with its importance in every European country [same]
  • to provide talented youngsters access to the most adequate forms of education in every Member State [same]
  • to make Europe attractive for the talented youth [same]
  • to create talent-friendly societies in every European country [same]
  • to accelerate the sharing of information on the topic [new]
  • to create a higher number of more efficient forms of talent support for the talented’ [new]
  • to make it easier for social actors interested in talent support to find each other through the European talent support network.’ [new]

The reference to voluntary experts has gone, to be replaced by a call for:

‘…partners – professionals, talents and talent supporters – willing to think and work together.’

Towards a European Talent Support Network’ offers a different version again.

The mission and role of the Centre have changed very slightly, to reflect the new orthodoxy of multiple European talent centres, describing the Budapest body as ‘the first European Talent Centre’.

Four long-term goals are outlined:

  • to give talent support a priority role in the transformation of the sector of education;
  • To reduce talent loss to the minimum in Europe,
  • To accelerate the sharing of information on the topic by integrating talent support initiatives of the Member States of the EU into a network
  • To make it easier for social actors interested in talent support to find each other through the European talent support network.’

It adds some additional short term objectives for good measure:

  • ‘As a hub of a European network, try to trigger mechanisms which bring organizations and individuals together to facilitate collaboration, share best practices and resources
  • Draw the Talent Support Map of Europe
  • Organize conferences for professionals in the region
  • Do research on the field of talent support
  • Collect and share best practices.’

We have now encountered three different versions of a mission statement for an entity that is less than two years old.

It is not clear whether this represents an evolutionary process within the organisation – which might be more understandable if it were better documented – or a certain slipperiness and opportunistic shifting of position that makes it very difficult for outsiders to get a grip on exactly what the Centre is for.

In typical fashion, the document says that:

‘the activities of the Centre fall into four large groups: advocacy, research, organisation (conferences, meetings, Talent Days), contact-keeping (meeting delegations from all over the world) and sharing information.’

Forgive me, but isn’t that five groups?

We have dealt with advocacy already and unfortunately there is negligible information available about the ‘contact-keeping’ activity undertaken – ie the various delegations that have been met by the staff and what the outcomes have been of those meetings.

That leaves research, organisation and sharing information.

.

Esterhazy Castle

Esterhazy Castle

Advisory Board and Partners

Before leaving the Centre’s operations, it is important to note that a three-strong Advisory Board has bee been appointed.

All three are luminaries of ECHA, two of them serving on the current Executive Committee.

There is no explanation of the Board’s role, or how it was chosen, and no published record of its deliberations. It is not clear whether it is intended as a substitute for the advisory group that was originally envisaged, which was to have had much broader membership.

As noted above, there is also a new emphasis on ‘partners’. The full text of the reference on the website says:

‘We are looking for partners – professionals, talents and talent supporters – willing to think and work together. We sincerely hope that the success of the Hungarian example will not stop short at the frontiers of the country, but will soon make its way to European talent support co-operation.’

Four partners are currently listed – ECHA, the Global Centre for Gifted and Talented Children, IGGY and the World Council – but there is no explanation of the status conferred by partnership or the responsibilities expected of partners in return.

Are partners prospective European Talent Centres or do they have a different status? Must partners be talent points or not? We are not told.

Research

This is presumably a reference to the ‘Best Practices’ section of the Budapest Centre’s website, which currently hosts two collections of studies ‘International Horizons of Talent Support Volumes 1 and 2’ and a selection of individual studies (17 at the time of writing).

 .

The quality of this material can best be described as variable. This study of provision in Ireland is relatively unusual, since most of the material is currently devoted to Central and Eastern Europe, but it gives a sense of what to expect.

There has been no effort to date to collect together already-published research and data about provision in different parts of Europe and to make that material openly accessible to readers. That is a major disappointment.

There is nothing in the collection that resembles an independent evaluation of the European Talent Initiative as a whole, or even an evaluation of the Hungarian NTP.

At best one can describe the level and quality of research-related activity as embryonic.

 .

Event Organisation

This Table shows what the Centre has achieved to date and what is planned for 2014:

.

2011 2012 2013 2014
Conference Yes (Budapest) Unofficial (Warsaw) No Yes (Budapest)
EU Talent Day Yes No No Yes

 .

The 2014 Conference is the first official EU-wide event since the 2011 launch conference. The same is true of the 2014 EU Talent Day.

The Polish conference was initially planned for spring 2012, but failed to materialise. By July it was confirmed that there would only be ‘an unofficial follow-up’ in October. My December 2012 post described my personal and ultimately unsuccessful efforts to attend this event and summarised the proceedings.

The 2014 Conference Website insists that it will coincide with the Third EU Talent Day but I can find barely a trace of a Second, except in Estonia, where it was celebrated on 21 March 2012.

.

.

This is not a strikingly positive record.

The 2014 Conference website names an organising ‘international scientific committee’ that is heavily biased towards academics (eight of the eleven), ECHA luminaries (five of the eleven) and Hungarians (four of the eleven).

The programme features four academic keynotes about networks and networking.

The remainder involve Slovenia’s education minister, the EU Commissioner for Employment, Social Affairs and Inclusion (a Hungarian who was advertised to be part of the Parliamentary Hearing on the Written Declaration but, if he did attend, apparently made no contribution) and one devoted to the ‘International Talent Competiveness Index’.

I think this must be INSEAD’s Global Talent Competitiveness Index).

INSEAD’s inaugural 2013 Report ranks Hungary 40th of 103 countries on this Index. (The UK is ranked 7th and the US 9th).

There are eight ‘break-up sessions’ [sic]:

  • The role of governments and the EU in creation a European Network[sic]
  • Digital Networks for Talented Youth
     
  • Social responsibility and organisational climate
  • Practice and Ethics of Networking
  • Multiple disadvanteged children [sic]
  • Parents’ networks in Europe
  • Counselling Centers [sic]
  • Civil networks for Talent Support

The expected outcome of the event is not specified. There is no scheduled opportunity to discuss the progress made to date by the EU Talent initiative, or the policy and implementation issues flagged up in this post. And there is no information about the mediation of the Conference via social media (though there are now Skype links next to the items in the programme).

 .

Talent Map and Resources

The website features a Resource Center [sic] which includes a database of ‘selected resources’. We are not told on what basis the selection has been made.

The database is built into the website and is not particularly accessible, especially if one compares it with the Hungarian equivalent. Indeed, the Talent Centre website is decidedly clunky by comparison.

The Talent Map is now better populated than it was, though inconsistently so. There are only two entries for Hungary, for example, while Romania has 11. There are only three in the UK and none in Ireland. Neither CTYI nor SNAP is mentioned.

It might have been better to pre-populate the map and then to indicate which entries had been ‘authorised’ by their owners.

From a presentational perspective the map is better than the database, though it should have a full page to itself.

Both the database and the map are still works in progress.

Overall Assessment and Key Issues Arising

In the light of this evidence, what are we to make of the progress achieved towards a European Talent Network over the last four years?

In my judgement:

  • The fundamental case for modelling a European Talent Network on the Hungarian National Talent Programme is unproven. The basic design of the NTP may reflect one tradition of consensus on effective practice, but the decision to stop at age 35 is unexplained and idiosyncratic. The full model is extremely costly to implement and relies heavily on EU funding. Even at current levels of funding, it is unlikely to be impacting on more than a relatively small minority of the target population. It is hard to see how it can become financially sustainable in the longer term. 
  • There is no detailed and convincing rationale for, or description of, how the model is being modified (into ‘Hungary-lite’) for European rollout. It is abundantly clear that this rollout will never attract commensurate funding and, compared with the NTP, it is currently being run ‘on a shoestring’. But, as currently envisaged, the rollout will require significant additional funding and the projected sources of this funding are unspecified. The more expensive the rollout becomes, the more unlikely it is to be financially sustainable. In short, the scalability to Europe of the modified Hungarian talent support model is highly questionable.
  • The shape and purpose of the overall European Talent initiative has changed substantively on several occasions during its short lifetime. There is only limited consistency between the goals being pursued now and those originally envisaged. There have been frequent changes to these goals along the way, several of them unexplained. It is not clear whether this is attributable to political opportunism and/or real confusion and disagreement within the initiative over what exactly it is seeking to achieve and how. There are frequently inconsistencies between different sources over exactly how aspects of the rollout are to be implemented. This causes confusion and calls into question the competence of those who are steering the process. Such ‘mission creep’ will radically reduce the chances of success.
  • The relationship with ECHA has always been problematic – and remains so. Fundamentally the European Talent Initiative is aiming to achieve what ECHA itself should have achieved, but failed. The suggestion that ECHA be given control over the accreditation of European Talent Centres is misguided. ECHA is a closed membership organisation rather than an open network and cannot be assumed to be representative of all those engaged in talent support throughout Europe. There is no reason why this process could not be managed by the network itself. In the longer term the continued co-existence of the Network and ECHA as separate entities becomes increasingly problematic. But any merger would demand radical reform of ECHA. Despite the injection of new blood into the ECHA Executive, the forces of conservatism within it remain strong and are unlikely to countenance such a radical step.
  • The progress achieved by the European Talent Centre during its relatively short existence has been less than impressive. That is partly attributable to the limited funding available and the fact that it is being operated on the margins of the Hungarian NTP. The funding it does attract comes with the expectation that it will be used to advertise the successes of the NTP abroad, so raising the status and profile of the domestic effort. There is a tension between this and the Centre’s principal role, which must be to drive the European rollout. 
  • The decision to move to a distributed model in which several European Talent Centres develop the network, rather than a centralised model driven by Budapest, is absolutely correct. (I was saying as much back in 2011.) However, the wider implications of this decision do not appear to have been thought through. I detect a worrying tendency to create bureaucracy for the sake of it, rather than focusing on getting things done.
  • Meanwhile, the Budapest Centre has made some headway with a Talent Map and a database of resources, but not nearly enough given the staffing and resource devoted to the task. The failure to deliver annual EU Conferences and Talent Days is conspicuous and worrying. Conversely, the effort expended on lobbying within the European Commission has clearly been considerable, though the tangible benefits secured from this exercise are, as yet, negligible.
  • For an initiative driven by networking, the quantity and quality of communication is poor. Independent evaluation studies of the Hungarian model do not seem to be available, at least not in English. There should be a fully costed draft specification for the European roll-out which is consulted upon openly and widely. Consultation seems confined currently to ECHA members which is neither inclusive nor representative. No opportunities are provided to challenge the direction of travel pursued by the initiative and its decision-making processes are not transparent. There is no evidence that it is willing to engage with critics or criticism of its preferred approach. The programme for the 2014 Conference does not suggest any marked shift in this respect.

An unkind critic might find sufficient evidence to level an accusation of talent support imperialism, albeit masked by a smokescreen of scientifically justified networkology.

I do not subscribe to that view, at least not yet. But I do conclude that the European Talent effort is faltering badly. It may limp on for several years to come, but it will never achieve its undoubted potential until the issues outlined above are properly and thoroughly addressed.

.

GP

March 2014


What Has Become of the European Talent Network? Part One

This post discusses recent progress by the European Talent Centre towards a European Talent Network.

EU flag CaptureIt is a curtain-raiser for an imminent conference on this topic and poses the critical questions I would like to see addressed at that event.

It should serve as a briefing document for prospective delegates and other interested parties, especially those who want to dig beneath the invariably positive publicity surrounding the initiative.

It continues the narrative strand of posts I have devoted to the Network, concentrating principally on developments since my last contribution in December 2012.


Flag_of_HungaryThe post is organised part thematically and part chronologically and covers the following ground:

  • An updated description of the Hungarian model for talent support and its increasingly complex infrastructure.
  • The origins of the European Talent project and how its scope and objectives have changed since its inception.
  • The project’s advocacy effort within the European Commission and its impact to date.
  • Progress on the European Talent Map and promised annual European Talent Days and conferences.
  • The current scope and effectiveness of the network, its support structures and funding.
  • Key issues and obstacles that need to be addressed.

To improve readability I have divided the text into two sections of broadly equivalent length. Part One is dedicated largely to bullets one to three above, while Part Two deals with bullets three to six.

Previous posts in this series

If I am to do justice to this complex narrative, I must necessarily draw to some extent on material I have already published in earlier posts. I apologise for the repetition, which I have tried to keep to a minimum.

On re-reading those earlier posts and comparing them with this, it is clear that my overall assessment of the EU talent project has shifted markedly since 2010, becoming progressively more troubled and pessimistic.

This seems to me justified by an objective assessment of progress, based exclusively on evidence in the public domain – evidence that I have tried to draw together in these posts.

However, I feel obliged to disclose the influence of personal frustration at this slow progress, as well as an increasing sense of personal exclusion from proceedings – which seems completely at odds with the networking principles on which the project is founded.

I have done my best to control this subjective influence in the assessment below, confining myself as far as possible to an objective interpretation of the facts.

However I refer you to my earlier posts if you wish to understand how I reached this point.

  • In April 2011 I attended the inaugural conference in Budapest, publishing a report on the proceedings and an analysis of the Declaration produced, plus an assessment of the Hungarian approach to talent support as it then was and its potential scalability to Europe as a whole.
  • In December 2012 I described the initial stages of EU lobbying, an ill-fated 2012 conference in Poland, the earliest activities of the European Talent Centre and the evolving relationship between the project and ECHA, the European Council for High Ability.

I will not otherwise comment on my personal involvement, other than to say that I do not expect to attend the upcoming Conference, judging that the cost of attending will not be exceeded by the benefits of doing so.

This post conveys more thoroughly and more accurately the points I would have wanted to make during the proceedings, were suitable opportunities provided to do so.

A brief demographic aside

It is important to provide some elementary information about Hungary’s demographics, to set in context the discussion below of its talent support model and the prospects for Europe-wide scalability.

Hungary is a medium-sized central European country with an area roughly one-third of the UK’s and broadly similar to South Korea or Portugal.

It has a population of around 9.88 million (2013) about a sixth of the size of the UK population and similar in size to Portugal’s or Sweden’s.

Hungary is the 16th most populous European country, accounting for about 1.4% of the total European population and about 2% of the total population of the European Union (EU).

It is divided into 7 regions and 19 counties, plus the capital, Budapest, which has a population of 1.7 million in its own right.

RegionsHungary

Almost 84% of the population are ethnic Hungarians but there is a Roma minority estimated (some say underestimated) at 3.1% of the population.

Approximately 4 million Hungarians are aged below 35 and approximately 3.5m are aged 5-34.

The GDP (purchasing power parity) is $19,497 (source: IMF), slightly over half the comparable UK figure.

The Hungarian Talent Support Model

The Hungarian model has grown bewilderingly complex and there is an array of material describing it, often in slightly different terms.

Some of the English language material is not well translated and there are gaps that can be filled only with recourse to documents in Hungarian (which I can only access through online translation tools).

Much of this documentation is devoted to publicising the model as an example of best practice, so it can be somewhat economical with the truth.

The basic framework is helpfully illustrated by this diagram, which appeared in a presentation dating from October 2012.

EU talent funding Capture

 .

It shows how the overall Hungarian National Talent Programme (NTP) comprises a series of time-limited projects paid for by the EU Social Fund, but also a parallel set of activities supported by a National Talent Fund which is fed mainly by the Hungarian taxpayer.

The following sections begin by outlining the NTP, as described in a Parliamentary Resolution dating from 2008.

Secondly, they describe the supporting infrastructure for the NTP as it exists today.

Thirdly, they outline the key features of the time-limited projects: The Hungarian Genius Programme (HGP) (2009-13) and the Talent Bridges Programme (TBP) (2012-14).

Finally, they try to make sense of the incomplete and sometimes conflicting information about the funding allocated to different elements of the NTP.

Throughout this treatment my principal purpose is to show how the European Talent project fits into the overall Hungarian plan, as precursor to a closer analysis of the former in the second half of the post.

I also want to show how the direction of the NTP has shifted since its inception.

 .

The National Talent Programme (NTP) (2008-2028)

The subsections below describe the NTP as envisaged in the original 2008 Parliamentary Resolution. This remains the most thorough exposition of the broader direction of travel that I could find.

Governing principles

The framework set out in the Resolution is built on ten general principles that I can best summarise as follows:

  • Talent support covers the period from early childhood to age 35, so extends well beyond compulsory education.
  • The NTP must preserve the traditions of existing successful talent support initiatives.
  • Talent is complex and so requires a diversity of provision – standardised support is a false economy.
  • There must be equality of access to talent support by geographical area, ethnic and socio-economic background.
  • Continuity is necessary to support individual talents as they change and develop over time; special attention is required at key transition points.
  • In early childhood one must provide opportunities for talent to emerge, but selection on the basis of commitment and motivation become increasingly significant and older participants increasingly self-select.
  • Differentiated support is needed to support different levels of talent; there must be opportunities to progress and to step off the programme without loss of esteem.
  • In return for talent support, the talented individual has a social responsibility to support talent development in others.
  • Those engaged in talent support – here called talent coaches – need time and support.
  • Wider social support for talent development is essential to success and sustainability.

Hence the Hungarians are focused on a system-wide effort to promote talent development that extends well beyond compulsory education, but only up to the age of 35. As noted above, if 0-4 year-olds are excluded, this represents an eligible population of about 3.5 million people.

The choice of this age 35 cut-off seems rather arbitrary. Having decided to push beyond compulsory education into adult provision, it is not clear why the principle of lifelong learning is then set aside – or exactly what happens when participants reach their 36th birthdays.

Otherwise the principles above seem laudable and broadly reflect one tradition of effective practice in the field.

Goals

The NTP’s goals are illustrated by this diagram

NTP goals Capture

 .

The elements in the lower half of the diagram can be expanded thus:

  • Talent support traditions: support for existing provision; development of new provision to fill gaps; minimum standards and professional development for providers; applying models of best practice; co-operation with ethnic Hungarian programmes outside Hungary (‘cross border programmes’); and ‘systematic exploration and processing of the talent support experiences’ of EU and other countries which excel in this field. 
  • Integrated programmes: compiling and updating a map of the talent support opportunities available in Hungary as well as ‘cross border programmes’; action to support access to the talent map; a ‘detailed survey of the international talent support practice’; networking between providers with cooperation and collaboration managed through a set of talent support councils; monitoring of engagement to secure continuity and minimise drop-out. 
  • Social responsibility: promoting the self-organisation of talented youth;  developing their innovation and management skills; securing counselling; piloting  a ‘Talent Bonus – Talent Coin’ scheme to record in virtual units the monetary value of support received and provided, leading to consideration of a LETS-type scheme; support for ‘exceptionally talented youth’; improved social integration of talented youth and development of a talent-friendly society. 
  • Equal opportunities: providing targeted information about talent support opportunities; targeted programming for disadvantaged, Roma and disabled people and wider emphasis on integration; supporting the development of Roma talent coaches; and action to secure ‘the desirable gender distribution’. 
  • Enhanced recognition: improving financial support for talent coaches; reducing workload and providing counselling for coaches; improving recognition and celebrating the success of coaches and others engaged in talent support. 
  • Talent-friendly society: awareness-raising activity for parents, family and friends of talented youth; periodic talent days to mobilise support and ‘promote the local utilisation of talent’; promoting talent in the media, as well as international communication about the programme and ‘introduction in both the EU and other countries by exploiting the opportunities provided by Hungary’s EU Presidency in 2011’; ‘preparation for the foreign adaptation of the successful talent support initiatives’ and organisation of EU talent days. 

Hence the goals incorporate a process of learning from European and other international experience, but also one of feeding back to the international community information about the Hungarian talent support effort and extending the model into other European countries.

There is an obvious tension in these goals between preserving the traditions of existing successful initiatives and imposing a framework with minimum standards and built-in quality criteria. This applies equally to the European project discussed below.

The reference to a LETS-type scheme is intriguing but I could trace nothing about its subsequent development.

 .

Planned Infrastructure

In 2008 the infrastructure proposed to undertake the NTP comprised:

  • A National Talent Co-ordination Board, chaired at Ministerial level, to oversee the programme and to allocate a National Talent Fund (see below).
  • A National Talent Support Circle [I’m not sure whether this should be ‘Council’] consisting of individuals from Hungary and abroad who would promote talent support through professional opportunities, financial contribution or ‘social capital opportunities’.
  • A National Talent Fund comprising a Government contribution and voluntary contributions from elsewhere. The former would include the proceeds of a 1% voluntary income tax levy (being one of the good causes towards which Hungarian taxpayers could direct this contribution). Additional financial support would come from ‘the talent support-related programmes of the New Hungary Development Plan’.
  • A system of Talent Support Councils to co-ordinate activity at regional and local level.
  • A national network of Talent Points – providers of talent support activity.
  • A biennial review of the programme presented to Parliament, the first being in 2011.

Presumably there have been two of these biennial reviews to date. They would make interesting reading, but I could find no material in English that describes the outcomes.

The NTP Infrastructure Today

The supporting infrastructure as described today has grown considerably more complex and bureaucratic than the basic model above.

  • The National Talent Co-ordination Board continues to oversee the programme as a whole. Its membership is set out here.
  • The National Talent Support Council was established in 2006 and devised the NTP as set out above. Its functions are more substantial than originally described (assuming this is the ‘Circle’ mentioned in the Resolution), although it now seems to be devolving some of these. Until recently at least, the Council: oversaw the national database of talent support initiatives and monitored coverage, matching demand – via an electronic mailing list – with the supply of opportunities; initiated and promoted regional talent days; supported the network of talent points and promoted the development of new ones; invited tenders for niche programmes of various kinds; collected and analysed evidence of best practice and the research literature; and promoted international links paying ‘special attention to the reinforcement of the EU contacts’. The Council has a Chair and six Vice Presidents as well as a Secretary and Secretariat. It operates nine committees: Higher Education, Support for Socially Disadvantaged Gifted People, Innovations, Public Education, Foreign Relations, Public and Media Relations, Theory of Giftedness, Training and Education and Giftedness Network.
  • The National Talent Point has only recently been identified as an entity in its own right, distinct from the National Council. Its role is to maintain the Talent Map and manage the underpinning database. Essentially it seems to have acquired the Council’s responsibilities for delivery, leaving the Council to concentrate on policy. It recently acquired a new website.
  • The Association of Hungarian Talent Support Organizations (MATEHETZ) is also a new addition. Described as ‘a non-profit umbrella organization that legally represents its members and the National Talent Support Council’, it is funded by the National Council and through membership fees. The Articles of Association date from February 2010 and list 10 founding organisations. The Association provides ‘representation’ for the National Council’ (which I take to mean the membership). It manages the time-limited programmes (see below) as well asthe National Talent Point and the European Talent Centre.
  • Talent Support Councils: Different numbers of these are reported. One source says 76; another 65, of which some 25% were newly-established through the programme. Their role seems broadly unchanged, involving local and regional co-ordination, support for professionals, assistance to develop new activities, helping match supply with demand and supporting the tracking of those with talent.
  • Talent Point Network: there were over 1,000 talent points by the end of 2013. (Assuming 3.5 million potential participants, that is a talent point for every 3,500 people.) Talent points are providers of talent support services – whether identification, provision or counselling. They are operated by education providers, the church and a range of other organisations and may have a local, regional or national reach. They join the network voluntarily but are accredited. In 2011 there were reportedly 400 talent points and 200 related initiatives, so there has been strong growth over the past two years.
  • Ambassadors of Talent: Another new addition, introduced by the National Talent Support Council in 2011. There is a separate Ambassador Electing Council which appoints three new ambassadors per year. The current list has thirteen entries and is markedly eclectic.
  • Friends of Talent Club: described in 2011 as ‘a voluntary organisation that holds together those, who are able and willing to support talents voluntarily and serve the issue of talent support…Among them, there are mentors, counsellors and educators, who voluntarily help talented people develop in their professional life. The members of the club can be patrons and/or supporters. “Patrons” are those, who voluntarily support talents with a considerable amount of service. “Supporters” are those, who voluntarily support the movement of talent support with a lesser amount of voluntary work, by mobilizing their contacts or in any other way.’ This sounds similar to the originally envisioned ‘National Talent Support Circle’ [sic]. I could find little more about the activities of this branch of the structure.
  • The European Talent Centre: The National Talent Point says that this:

‘…supports and coordinates European actions in the field of talent support in order to find gifted people and develop their talent in the interest of Europe as a whole and the member states.’

Altogether this is a substantial endeavour requiring large numbers of staff and volunteers and demanding a significant budgetary topslice.

I could find no reliable estimate of the ratio of the running cost to the direct investment in talent support, but there must be cause to question the overall efficiency of the system.

My hunch is that this level of bureaucracy must consume a significant proportion of the overall budget.

Clearly the Hungarian talent support network is a long, long way from being financially self-sustaining, if indeed it ever could be.

 .

Hungary Parliament Building Budapest

Hungarian Parliament Building

.

The Hungarian Genius Programme (HGP) (2009-13)

Launched in June 2009, the HGP had two principal phases lasting from 2009 to 2011 and from 2011 to 2013. The fundamental purpose was to establish the framework and infrastructure set out in the National Talent Plan.

This English language brochure was published in 2011. It explains that the initial focus is on adults who support talents, establishing a professional network and training experts, as well as creating the network and map of providers.

It mentions that training courses lasting 10 to 30 hours have been developed and accredited in over 80 subjects to:

‘…bring concepts and methods of gifted and talented education into the mainstream and reinforce the professional talent support work… These involve the exchange of experience and knowledge expansion training, as well as programs for those who deal with talented people in developing communities, and awareness-raising courses aimed at the families and environment of young pupils, on the educational, emotional and social needs of children showing special interest and aptitude in one or more subject(s). The aims of the courses are not only the exchange of information but to produce and develop the professional methodology required for teaching talents.’

The brochure also describes an extensive talent survey undertaken in 2010, the publication of several good practice studies and the development of a Talent Loan modeled on the Hungarian student loan scheme.

It lists a seven-strong strategic management group including an expert adviser, project manager, programme co-ordinator and a finance manager. There are also five operational teams, each led by a named manager, one of which focused on ‘international relations: collecting and disseminating international best practices; international networking’.

A subsequent list of programme outputs says:

  • 24,000 new talents were identified
  • The Talent Map was drawn and the Talent Network created (including 867 talent points and 76 talent councils).
  • 23,500 young people took part in ‘subsidised talent support programmes’
  • 118 new ‘local educational talent programmes’ were established
  • 25 professional development publications were written and made freely available
  • 13,987 teachers (about 10% of the total in Hungary) took part in professional development.

Evidence in English of rigorous independent evaluation is, however, limited:

‘The efficiency of the Programme has been confirmed by public opinion polls (increased social acceptance of talent support) and impact assessments (training events: expansion of specialised knowledge and of the methodological tool kit).’

 .

The Talent Bridges Project (TBP) (2012-2014)

TBP began in November 2012 and is scheduled to last until ‘mid-2014’.

The initially parallel TBP is mentioned in the 2011 brochure referenced above:

‘In the strategic plan of the Talent Bridges Program to begin in 2012, we have identified three key areas for action: bridging the gaps in the Talent Point network, encouraging talents in taking part in social responsibility issues and increasing media reach. In order to become sustainable, much attention should be payed [sic] to maintaining and expanding the support structure of this system, but the focus will significantly shift towards direct talent care work with the youth.’

Later on it says:

‘Within the framework of the Talent Bridges Program the main objectives are: to further improve the contact system between the different levels of talent support organisations; to develop talent peer communities based on the initiatives coming from young people themselves; to engage talents in taking an active role in social responsibility; to increase media reach in order to enhance the recognition and social support for both high achievers and talent support; and last, but not least, to arrange the preliminary steps of setting up an EU Institute of Talent Support in Budapest.’

A list of objectives published subsequently contains the following items:

  • Creating a national talent registration and tracking system
  • Developing programmes for 3,000 talented young people from  disadvantaged backgrounds and with special educational needs
  • Supporting the development of ‘outstanding talents’ in 500 young people
  • Supporting 500 enrichment programmes
  • Supporting ‘the peer age groups of talented young people’
  • Introducing programmes to strengthen interaction between parents, teachers and  talented youth benefiting  5,000 young people
  • Introducing ‘a Talent Marketplace’ to support ‘the direct social utilisation of talent’ involving ‘150 controlled co-operations’
  • Engaging 2,000 mentors in supporting talented young people and training 5,000 talent support facilitators and mentors
  • Launching a communication campaign to reach 100,000 young people and
  • Realise European-Union-wide communication (in addition to the current 10, to involve 10 more EU Member States into the Hungarian initiatives, in co-operation with the European Talent Centre in Budapest established in the summer of 2012).

Various sources describe how the TBP is carved up into a series of sub-projects. The 2013 Brochure ‘Towards a European Talent Support Network’ lists 14 of these, but none mention the European work.

However, what appears to be the bid for TBP (in Hungarian) calls the final sub-project ‘an EU Communications Programme’ (p29), which appears to involve:

  • Raising international awareness of Hungary’s talent support activities
  • Strengthening Hungary’s position in the EU talent network
  • Providing a foreign exchange experience for talented young Hungarians
  • Influencing policy makers.

Later on (p52) this document refers to an international campaign, undertaken with support from the European Talent Centre, targeting international organisations and the majority of EU states.

Work to be covered includes the preparation of promotional publications in foreign languages, the operation of a ‘multilingual online platform’, participation in international conferences (such as those of ECHA, the World Council, IRATDE and ICIE); and ‘establishing new professional collaborations with at least 10 new EU countries or international organisations’.

Funding

It is not a straightforward matter to reconcile the diverse and sometimes conflicting sources of information about the budgets allocated to the National Talent Fund, HGP and the TBP, but this is my best effort, with all figures converted into pounds sterling.

 .

2009 2010 2011 2012 2013 2014 Total
NTF x £2.34m.or £4.1m  £2.34m.or £4.1m £8.27m tbc tbc tbc
Of which ETC x x x £80,000 £37,500 £21,350 £138,850
HGP £8.0m £4.6m x £12.6m
TBP x x x £5.3m £5.3m
Of which EU comms x x x £182,000 £182,000

Several sources say that the Talent Fund is set to increase in size over the period.

‘This fund has an annual 5 million EUR support from the national budget and an additional amount from tax donations of the citizens of a total sum of 1.5 million EUR in the first year doubled to 3 million EUR and 6 million EUR in the second and third years respectively.’ (Csermely 2012)

That would translate into a budget of £5.4m/£6.7m/£9.2m over the three years in question, but it is not quite clear which three years are included.

Even if we assume that the NTF budget remains the same in 2013 and 2014 as in 2012, the total investment over the period 2009-2014 amounts to approximately £60m.

That works out at about £17 per eligible Hungarian. Unfortunately I could find no reliable estimate of the total number of Hungarians that have benefited directly from the initiative to date.

On the basis of the figures I have seen, my guesstimate is that the total will be below 10% of the total eligible population – so under 350,000. But I must stress that there is no evidence to support this.

Whether or not the intention is to reach 100% of the population, or whether there is an in-built assumption that only a proportion of the population are amenable to talent development, is a moot point. I found occasional references to a 25% assumption, but it was never clear whether this was official policy.

Even if this applies, there is clearly a significant scalability challenge even within Hungary’s national programme.

It is also evident that the Hungarians have received some £18m from the European Social Fund over the past five years and have invested at least twice as much of their own money. That is a very significant budget indeed for a country of this size.

Hungary’s heavy reliance on EU funding is such that they will find it very difficult to sustain the current effort if that largesse disappears.

One imagines that they will be seeking continued support from EU sources over the period 2014-2020. But, equally, one would expect the EU to demand robust evidence that continued heavy dependency on EU funding will not be required.

And of course a budget of this size also begs questions about scalability to Europe in the conspicuous absence of a commensurate figure. There is zero prospect of equivalent funding being available to extend the model across Europe. The total bill would run into billions of pounds!

A ‘Hungarian-lite’ model would not be as expensive, but it would require a considerable budget.

However, it is clear from the table that the present level of expenditure on the European network has been tiny by comparison with the domestic investment – probably not much more than £100,000 per year.

Initially this came from the National Talent Fund budget but it seems as though the bulk is now provided through the ESF, until mid-2014 at least.

This shift seems to have removed a necessity for the European Talent Centre to receive its funding in biannual tranches through a perpetual retendering process.

For the sums expended from the NTF budget are apparently tied to periods of six months or less.

The European Talent Centre website currently bears the legend:

‘Operation of the European Talent Centre – Budapest between 15th December 2012 and 30th June 2013 is realised with the support of Grant Scheme No. NTP-EUT-M-12 announced by the Institute for Educational Research and Development and the Human Resources Support Manager on commission of the Ministry of Human Resources “To support international experience exchange serving the objectives of the National Talent Programme, and to promote the operation and strategic further development of the European Talent Centre – Budapest”.’

But when I wrote my 2012 review it said:

‘The operation of the European Talent Centre — Budapest is supported from 1 July 2012 through 30 November 2012 by the grant of the National Talent Fund. The grant is realised under Grant Scheme No. NTP-EU-M-12 announced by the Hungarian Institute for Educational Research and Development and the SándorWekerle Fund Manager of the Ministry of Administration and Justice on commission of the Ministry of Human Resources, from the Training Fund Segment of the Labour Market Fund.’

A press release confirmed the funding for this period as HUF 30m.

Presumably it will now need to be amended to reflect the arrival of £21.3K under Grant Scheme No. NTP-EU-M-13 – and possibly to reflect income from the ESF-supported TBP too.

A comparison between the Hungarian http://tehetseg.hu/ website and the European Talent Centre website is illustrative of the huge funding imbalance in favour of the former.

Danube Bend at Visegrad courtesy of Phillipp Weigell

Danube Bend at Visegrad courtesy of Phillipp Weigell

.

Origins of the European Talent Project: Evolution to December 2012

Initial plans

Hungary identified talent support as a focus during its EU Presidency, in the first half of 2011, citing four objectives:

  • A talent support conference scheduled for April 2011
  • A first European Talent Day to coincide with the conference, initially ‘a Hungarian state initiative…expanding it into a public initiative by 2014’.
  • Talent support to feature in EU strategies and documents, as well as a Non-Legislative Act (NLA). It is not specified whether this should be a regulation, decision, recommendation or opinion. (Under EU legislation the two latter categories have no binding force.)
  • An OMCexpert group on talent support – ie an international group run under the aegis of the Commission.

The Budapest Declaration

The Conference duly took place, producing a Budapest Declaration on Talent Support in which conference participants:

  • ‘Call the European Commission and the European Parliament to make every effort to officially declare the 25th of March the European Day of the Talented and Gifted.’
  • ‘Stress the importance of…benefits and best practices appearing in documents of the European Commission, the European Council and the European Parliament.’
  • ‘Propose to establish a European Talent Resource and Support Centre in Budapest’ to ‘coordinate joint European actions in the field’.
  • ‘Agree to invite stakeholders from every country of the European Union to convene annually to discuss the developments and current questions in talent support. Upon the invitation of the Government of Poland the next conference will take place in Warsaw.’

The possibility of siting a European Centre anywhere other than Budapest was not seriously debated.

 .

Evolution of a Written Declaration to the EU

Following the Conference an outline Draft Resolution of the European Parliament was circulated for comment.

This proposed that:

 ‘A Europe-wide talent support network should be formed and supported with an on-line and physical presence to support information-sharing, partnership and collaborations. This network should be open for co-operation with all European talent support efforts, use the expertise and networking experiences of existing multinational bodies such as the European Council of High Ability and support both national and multinational efforts to help talents not duplicating existing efforts but providing an added European value.’

Moreover, ‘A European Talent Support Centre should be established…in Budapest’. This:

‘…should have an Advisory Board having the representatives of interested EU member states, all-European talent support-related institutions as well as key figures of European talent support.’

The Centre’s functions are five-fold:

‘Using the minimum bureaucracy and maximising its use of online solutions the European Talent Support Centre should:

  • facilitate the development and dissemination of best curricular and extra-curricular talent support practices;
  • coordinate the trans-national cooperation of Talent Points forming an EU Talent Point network;
  • help  the spread of the know-how of successful organization of Talent Days;
  • organize annual EU talent support conferences in different EU member states overseeing the progress of cooperation in European talent support;
  • provide a continuously updated easy Internet access for all the above information.’

Note the references on the one hand to an inclusive approach, a substantial advisory group (though without the status of an EU-hosted OMC expert group) and a facilitating/co-ordinating role, but also – on the other hand – the direct organisation of annual EU-wide conferences and provision of a sophisticated supporting online environment.

MEPs were lined up to submit the Resolution in Autumn 2011 but, for whatever reason, this did not happen.

Instead a new draft Written Declaration was circulated in January 2012. This called on:

  •  Member States to consider measures helping curricular and extracurricular forms of talent support including the training of educational professionals to recognize and help talent;
  • The Commission to consider talent support as a priority of future European strategies, such as the European Research Area and the European Social Fund;
  • Member States and the Commission to support the development of a Europe-wide talent support network, formed by talent support communities, Talent Points and European Talent Centres facilitating cooperation, development and dissemination of best talent support practices;
  • Member States and the Commission to celebrate the European Day of the Talented and Gifted.’

The focus has shifted from the Budapest-centric network to EU-led activity amongst member states collectively. Indeed, no specific role for Hungary is mentioned.

There is a new emphasis on professional development and – critically – a reference to ‘European talent centres’. All mention of NLAs and OMC expert groups has disappeared.

There followed an unexplained 11-month delay before a Final Written Declaration was submitted by four MEPs in November 2012.

 .

The 2012 Written Declaration 

There are some subtle adjustments in the final version of WD 0034/2012. The second bullet point has become:

  • ‘The Commission to consider talent support as part of ‘non-formal learning’ and a priority in future European strategies, such as the strategies guiding the European Research Area and the European Social Fund’.

While the third now says:

  • ‘Member States and the Commission to support the development of a Europe-wide talent support network bringing together talent support communities, Talent Points and European Talent Centres in order to facilitate cooperation and the development and dissemination of the best talent support practices.’

And the fourth is revised to:

  • ‘Member States and the Commission to celebrate the European Day of Highly Able People.’

The introduction of a phrase that distinguishes between education and talent support is curious.

CEDEFOP – which operates a European Inventory on Validation of Non-formal and Informal Learning – defines the latter as:

‘…learning resulting from daily work-related, family or leisure activities. It is not organised or structured (in terms of objectives, time or learning support). Informal learning is in most cases unintentional from the learner’s perspective. It typically does not lead to certification.’

One assumes that a distinction is being attempted between learning organised by a school or other formal education setting and that which takes place elsewhere – presumably because EU member states are so fiercely protective of their independence when it comes to compulsory education.

But surely talent support encompasses formal and informal learning alike?

Moreover, the adoption of this terminology appears to rule out any provision that is ‘organised or structured’, excluding huge swathes of activity (including much of that featured in the Hungarian programme). Surely this cannot have been intentional.

Such a distinction is increasingly anachronistic, especially in the case of gifted learners, who might be expected to access their learning from a far richer blend of sources than simply in-school classroom teaching.

Their schools are no longer the sole providers of gifted education, but facilitators and co-ordinators of diverse learning streams.

The ‘gifted and talented’ terminology has also disappeared, presumably on the grounds that it would risk frightening the EU horses.

Both of these adjustments seem to have been a temporary aberration. One wonders who exactly they were designed to accommodate and whether they were really necessary.

 .

Establishment and early activity of the EU Talent Centre in Budapest

The Budapest centre was initially scheduled to launch in February 2012, but funding issues delayed this, first until May and then the end of June.

The press release marking the launch described the long-term goal of the Centre as:

‘…to contribute on the basis of the success of the Hungarian co-operation model to organising the European talent support actors into an open and flexible network overarching the countries of Europe.’

Its mission is to:

‘…offer the organisations and individuals active in an isolated, latent form or in a minor network a framework structure and an opportunity to work together to achieve the following:

  • to provide talent support an emphasis commensurate with its importance in every European country
  • to reduce talent loss to the minimum in Europe,
  • to give talent support a priority role in the transformation of the sector of education; to provide talented young persons access to the most adequate forms of education in every Member State,
  • to make Europe attractive for the talented youth,
  • to create talent-friendly societies in every European country.’

The text continues:

‘It is particularly important that network hubs setting targets similar to those of the European Talent Centre in Budapest should proliferate in the longer term.

The first six months represent the first phase of the work: we shall lay the bases [sic] for establishing the European Talent Support Network. The expected key result is to set up a team of voluntary experts from all over Europe who will contribute to that work and help draw the European talent map.

But what exactly are these so-called network hubs? We had to wait some time for an explanation.

There was relatively little material on the website at this stage and this was also slow to change.

My December 2012 post summarised progress thus:

‘The Talent Map includes only a handful of links, none in the UK.

The page of useful links is extensive but basically just a very long list, hard to navigate and not very user-friendly. Conversely, ‘best practices’ contains only three resources, all of them produced in house.

The whole design is rather complex and cluttered, several of the pages are too text-heavy and occasionally the English leaves something to be desired.’


Here ends the first part of this post. Part Twoexplains the subsequent development of the ‘network hubs’ concept, charts the continuation of the advocacy effort  and reviews progress in delivering the services for which the Budapest Centre is  responsible.

It concludes with an overall assessment of the initiative highlighting some of its key weaknesses.

GP

March 2014

How Well Does Gifted Education Use Social Media?

.

This post reviews the scope and quality of gifted education coverage across selected social media.

It uses this evidence base to reflect on progress in the 18 months since I last visited this topic and to establish a benchmark against which to judge future progress.

tree-240470_640More specifically, it:

  • Proposes two sets of quality criteria – one for blogs and other websites, the other for effective use of social media;
  • Reviews gifted education-related social media activity:

By a sample of six key players  – the World Council (WCGTC) and the European Council for High Ability (ECHA), NAGC and SENG in the United States and NACE and Potential Plus UK over here

Across the Blogosphere and five of the most influential English language social media platforms – Facebook, Google+, LinkedIn, Twitter and You Tube and

Utilising four content curation tools particularly favoured by gifted educators, namely PaperLi, Pinterest, ScoopIt and Storify.

  • Considers the gap between current practice and the proposed quality criteria – and whether there has been an improvement in the application of social media across the five dimensions of gifted education identified in my previous post.

I should declare at the outset that I am a Trustee of Potential Plus UK and have been working with them to improve their online and social media presence. This post lies outside that project, but some of the underlying research is the same.

.

I have been this way before

This is my second excursion into this territory.

In September 2012 I published a two-part response to the question ‘Can Social Media Help Overcome the Problems We Face in Gifted Education?’

  • Part One outlined an analytical framework based on five dimensions of gifted education. Each dimension is stereotypically associated with a particular stakeholder group though, in reality, each group operates across more than one area. The dimensions (with their associated stakeholder groups in brackets) are: advocacy (parents); learning (learners); policy-making (policy makers); professional development (educators); and research (academics).
  • Part Two used this framework to review the challenges faced by gifted education, to what extent these were being addressed through social media and how social media could be applied more effectively to tackle them. It also outlined the limitations of a social media-driven approach and highlighted some barriers to progress.

The conclusions I reached might be summarised as follows:

  • Many of the problems associated with gifted education are longstanding and significant, but not insurmountable. Social media will not eradicate these problems but can make a valuable contribution towards that end by virtue of their unrivalled capacity to ‘only connect’.
  • Gifted education needs to adapt if it is to thrive in a globalised environment with an increasingly significant online dimension driven by a proliferation of social media. The transition from early adoption to mainstream practice has not yet been effected, but rapid acceleration is necessary otherwise gifted education will be left behind.
  • Gifted education is potentially well-placed to pioneer new developments in social media but there is limited awareness of this opportunity, or the benefits it could bring.

The post was intended to inform discussion at a Symposium at the ECHA Conference in Munster, Germany in September 2012. I published the participants’ presentations and a report on proceedings (which is embedded within a review of the Conference as a whole).

.

Defining quality

I have not previously attempted to pin down what constitutes a high quality website or blog and effective social media usage, not least because so many have gone before me.

But, on reviewing their efforts, I could find none that embodied every dimension I considered important, while several appeared unduly restrictive.

It seems virtually impossible to reconcile these two conflicting pressures, defining quality with brevity but without compromising flexibility. Any effort to pin down quality risks reductionism while also fettering innovation and wilfully obstructing the pioneering spirit.

I am a strong advocate of quality standards in gifted education but, in this context, it seemed beyond my capacity to find or generate the ideal ‘flexible framework’, offering clear guidance without compromising innovation and capacity to respond to widely varying needs and circumstances.

But the project for Potential Plus UK required us to consult stakeholders on their understanding of quality provision, so that we could reconcile any difference between their perceptions and our own.

And, in order to consult effectively, we needed to make a decent stab at the task ourselves.

So I prepared some draft success criteria, drawing on previous efforts I could find online as well as my own experience over the last four years.

I have reproduced the draft criteria below, with slight amendment to make them more universally applicable. The first set – for a blog or website – are generic, while those relating to wider online and social media presence are made specific to gifted education.

.

Draft Quality Criteria for a Blog or Website

1.    The site is inviting to regular and new readers alike; its purpose is up front and explicit; as much content as possible is accessible to all.

 2.    Readers are encouraged to interact with the content through a variety of routes – and to contribute their own (moderated) content.

3.    The structure is logical and as simple as possible, supported by clear signposting and search.

 4.    The design is contemporary, visually attractive but not obtrusive, incorporating consistent branding and a complementary colour scheme. There is no external advertising.

 5.    The layout makes generous and judicious use of space and images – and employs other media where appropriate.

 6.    Text is presented in small blocks and large fonts to ensure readability on both tablet and PC.

 7.    Content is substantial, diverse and includes material relevant to all the site’s key audiences.

 8.    New content is added weekly; older material is frequently archived (but remains accessible).

 9.    The site links consistently to – and is linked to consistently by – all other online and social media outlets maintained by the authors.

 10. Readers can access site content by multiple routes, including other social media, RSS and email.

.

Draft quality criteria for wider online/social media activity

1.    A body’s online and social media presence should be integral to its wider communications strategy which should, in turn, support its purpose, objectives and priorities.

 2.    It should:

 a.    Support existing users – whether they are learners, parents/carers, educators, policy-makers or academics – and help to attract new users;

 b.    Raise the entity’s profile and build its reputation – both nationally and internationally – as a first-rate provider in one or more of the five areas of gifted education;

 c.    Raise the profile of gifted education as an  issue and support  campaigning for stronger provision;

 d.    Help to generate income to support the pursuit of these objectives and the body’s continued existence.

3.    It should aim to:

 a.    Provide a consistently higher quality and more compelling service than its main competitors, generating maximum benefit for minimum cost.

 b.    Use social media to strengthen interaction with and between users and provide more effective ‘bottom-up’ collaborative support.

 c.    Balance diversity and reach against manageability and effectiveness, prioritising media favoured by users but resisting pressure to diversify without justification and resource.

 d.    Keep the body’s online presence coherent and uncomplicated, with clear and consistent signposting so users can navigate quickly and easily between different online locations.

e.    Integrate all elements of the body’s online presence, ensuring they are mutually supportive.

 4.    It should monitor carefully the preferences of users, as well as the development of online and social media services, adjusting the approach only when there is a proven business case for doing so.

.

P1010262-001

Perth Pelicans by Gifted Phoenix

.

Applying the Criteria

These draft criteria reflect the compromise I outlined above. They are not the final word. I hope that you will help us to refine them as part of the consultation process now underway and I cannot emphasise too much that they are intended as guidelines, to be applied with some discretion.

I continue to maintain my inalienable right – as well as yours – to break any rules imposed by self-appointed arbiters of quality.

To give an example, readers will know that I am particularly exercised by any suggestion that good blog posts are, by definition, brief!

I also maintain your inalienable right to impose your own personal tastes and preferences alongside (or in place of) these criteria. But you might prefer to do so having reflected on the criteria – and having dismissed them for logical reasons.

There are also some fairly obvious limitations to these criteria.

For example, bloggers like me who use hosted platforms are constrained to some extent by the restrictions imposed by the host, as well as by our preparedness to pay for premium features.

Moreover, the elements of effective online and social media practice have been developed with a not-for-profit charity in mind and some in particular may not apply – or may not apply so rigorously – to other kinds of organisations, or to individuals engaged in similar activity.

In short, these are not templates to be followed slavishly, but rather a basis for reviewing existing provision and prompting discussion about how it might be further improved.

It would be forward of me to attempt a rigorous scrutiny against each of the criteria of the six key players mentioned above, or of any of the host of smaller players, including the 36 active gifted education blogs now listed on my blogroll.

I will confine myself instead to reporting factually all that I can find in the public domain about the activity of the six bodies, comparing and contrasting their approaches with broad reference to the criteria and arriving at an overall impressionistic judgement.

As for the blogs, I will be even more tactful, pointing out that my own quick and dirty self-review of this one – allocating a score out of ten for each of the ten items in the first set of criteria – generated a not very impressive 62%.

Of course I am biased. I still think my blog is better than yours, but now I have some useful pointers to how I might make it even better!

.

Comparing six major players

I wanted to compare the social media profile of the most prominent international organisations, the most active national organisations based in the US (which remains the dominant country in gifted education and in supporting gifted education online) and the two major national organisations in the UK.

I could have widened my reach to include many similar organisations around the world but that would have made this post more inaccessible. It also struck me that I could evidence my key messages by analysis of this small sample alone – and that my conclusions would be equally applicable to others in the field, wherever they are located geographically.

My analysis focuses on these organisations’:

  • Principal websites, including any information they contain about their wider online and social media activity;
  • Profile across the five selected social media platforms and use of blogs plus the four featured curational tools.

I have confined myself to universally accessible material, since several of these organisations have additional material available only to their memberships.

I have included only what I understand to be official channels, tied explicitly to the main organisation. I have included accounts that are linked to franchised operations – typically conferences – but have excluded personal accounts that belong to individual employees or trustees of the organisations in question.

Table 1 below shows which of the six organisations are using which social media. The table includes hyperlinks to the principal accounts and I have also repeated these in the commentary that follows.

.

Table 1: The social media used by the sample of six organisations

WCGTC ECHA SENG NAGC PPUK NACE
Blog No No [Yes] No No No
Facebook Yes Yes Yes Yes Yes No
Google+ Yes No Yes No Yes Yes
LinkedIn Yes No Yes No Yes No
Twitter Yes No Yes Yes Yes Yes
You Tube Yes No Yes Yes No Yes
PaperLi Yes No No No No No
Pinterest No No No Yes Yes No
ScoopIt No No No No No No
Storify No No No Yes No No

.

The table gives no information about the level or quality of activity on each account – that will be addressed in the commentary below – but it gives a broadly reliable indication of which organisations are comparatively active in social media and which are less so.

The analysis shows that Facebook and Twitter are somewhat more popular platforms than Google+, LinkedIn and You Tube, while Pinterest leads the way amongst the curational tools. This distribution of activity is broadly representative of the wider gifted education community.

The next section takes a closer look at this wider activity on each of the ten platforms and tools.

.

Comparing gifted-related activity on the ten selected platforms and tools

 .

Blogs

As far as I can establish, none of the six organisations currently maintains a blog. SENG does have what it describes as a Library of Articles, which is a blog to all intents and purposes – and Potential Plus UK is currently planning a blog.

Earlier this year I noticed that my blogroll was extremely out of date and that several of the blogs it contained were no longer active. I reviewed all the blogs I could find in the field and sought recommendations from others.

I imposed a rule to distinguish live blogs from those that are dead or dormant – they had to have published three or more relevant posts in the previous six months.

I also applied a slightly more subjective rule, in an effort to sift out those that had little relevance to anyone beyond the author (being cathartic diaries of sorts) and those that are entirely devoted to servicing a small local advocacy group.

I ended up with a long shortlist of 36 blogs, which now constitutes the revised blogroll in the right hand column.  Most are written in English but I have also included a couple of particularly active blogs in other languages.

The overall number of active blogs is broadly comparable with what I remember in 2010 when I first began, but the number of posts has probably fallen.

I don’t know to what extent this reflects changes in the overall number of active blogs and posts, either generically or in the field of education. In England there has been a marked renaissance in edublogging over the last twelve months, yet only three bloggers venture regularly into the territory of gifted education.

.

Facebook

Alongside Twitter, Facebook has the most active gifted education community.

There are dozens of Facebook Groups focused on giftedness and high ability. At the time of writing, the largest and most active are:

The Facebook Pages with the most ‘likes’ have been established by bodies located in the United States. The most favoured include:

There is a Gifted Phoenix page, which is rigged up to my Twitter account so all my tweets are relayed there. Only those with a relevant hashtag – #gtchat or #gtvoice – will be relevant to gifted education.

.

Google+

To date there is comparatively little activity on Google+, though many have established an initial foothold there.

Part of the problem is lack of familiarity with the platform, but another obstacle is the limited capacity to connect other parts of one’s social media footprint with one’s Google+ presence.

There is only one Google+ Community to speak of: ‘Gifted and Talented’ currently with 134 members.

A search reveals a large number of people and pages ostensibly relevant to gifted education, but few are useful and many are dormant.

Amongst the early adopters are:

My own Google+ page is dormant. It should now be possible to have WordPress.com blogposts appear automatically on a Google+ page, but the service seems unreliable. There is no capacity to link Twitter and Google+ in this fashion. I am waiting on Google to improve the connectivity of their service.

.

LinkedIn

LinkedIn is also comparatively little used by the gifted education community. There are several groups:

But none is particularly active, despite the rather impressive numbers above. Similarly, a handful of organisations have company pages on LinkedIn, but only one or two are active.

The search purports to include a staggering 98,360 people who mention ‘gifted’ in their profiles, but basic account holders can only see 100 results at a time.

My own LinkedIn page is registered under my real name rather than my social media pseudonym and is focused principally on my consultancy activity. I often forget it exists.

 .

Twitter

By comparison, Twitter is much more lively.

My brief January post mentioned my Twitter list containing every user I could find who mentions gifted education (or a similar term, whether in English or a selection of other languages) in their profile.

The list currently contains 1,263 feeds. You are welcome to subscribe to it. If you want to see it in action first, it is embedded in the right-hand column of this Blog, just beneath the blogroll.

The majority of the gifted-related activity on Twitter takes place under the #gtchat hashtag, which tends to be busier than even the most popular Facebook pages.

This hashtag also accommodates an hour long real-time chat every Friday (at around midnight UK time) and at least once a month on Sundays, at a time more conducive to European participants.

Other hashtags carrying information about gifted education include: #gtvoice (UK-relevant), #gtie (Ireland-relevant), #hoogbegaafd (Dutch-speaking); #altascapacidades (Spanish-speaking), #nagc and #gifteded.

Chats also take place on the #gtie and #nagc hashtags, though the latter may now be discontinued.

Several feeds provide gifted-relevant news and updates from around the world. Amongst the most followed are:

  • NAGC (4,240 followers)
  • SENG (2,709 followers)

Not forgetting Gifted Phoenix (5,008 followers) who publishes gifted-relevant material under the #gtchat (globally relevant material) and #gtvoice (UK-relevant material) hashtags.

.

Twitter network 2014 Capture

Map of Gifted Phoenix’s Twitter Followers March 2014

.

You Tube

You Tube is of course primarily an audio-visual channel, so it tends to be used to store public presentations and commercials.

A search on ‘gifted education’ generates some 318,000 results including 167,000 videos and 123,000 channels, but it is hard to see the wood for the trees.

The most viewed videos and the most used channels are an eclectic mix and vary tremendously in quality.

Honourable mention should be made of:

The most viewed video is called ‘Top 10 Myths in Gifted Education’, a dramatised presentation which was uploaded in March 2010 by the Gifted and Talented Association of Montgomery County. This has had almost 70,000 views.

Gifted Phoenix does not have a You Tube presence.

.

Paper.li

Paper.li describes itself as ‘a content curation service’ which ‘enables people to publish newspapers based on topics they like and treat their readers to fresh news, daily.’

It enables curators to draw on material from Facebook, Twitter, Google+, embeddable You Tube videos and websites via RSS feeds.

In September 2013 it reported 3.7m users each month.

I found six gifted-relevant ‘papers’ with over 1,000 subscriptions:

There is, as yet, no Gifted Phoenix presence on paper.li, though I have been minded for some months to give it a try.

.

Pinterest

Pinterest is built around a pinboard concept.  Pins are illustrated bookmarks designating something found online or already on Pinterest, while Boards are used to organise a collection of pins. Users can follow each other and others’ boards.

Pinterest is said to have 70 million users, of which 80% are female.

A search on ‘gifted education’ reveals hundreds of boards dedicated to the topic, but unfortunately there is no obvious way to rank them by number of followers or number of pins.

Since advanced search capability is conspicuous by its absence, the user apparently has little choice but to sift laboriously through each board. I have not undertaken this task so I can bring you no useful information about the most used and most popular boards.

Judging by the names attached to these boards, they are owned almost exclusively by women. It is interesting to hypothesise about what causes this gender imbalance – and whether Pinterest is actively pursuing female users at the expense of males.

There are, however, some organisations in the field making active use of Pinterest. A search of ‘pinners’ suggests that amongst the most popular are:

  • IAGC Gifted which has 26 boards, 734 pins and 400 followers.

Gifted Phoenix is male and does not have a presence on Pinterest…yet!

 .

Scoop.it

Scoop.it stores material on a page somewhere between a paper.li-style newspaper and a Pinterest-style board. It is reported to have almost seven million unique visitors each month.

‘Scoopable’ material is drawn together via URLs, a programmable ‘suggestions engine’ and other social media, including all the ‘big four’. The free version permits a user to link only two social media accounts however, putting significant restrictions on Scoop.it’s curational capacity.

Scoop.it also has limited search engine capability. It is straightforward to conduct an elementary search like this one on ‘gifted’ which reveals 107 users.

There is no quick way of finding those pages that are most used or most followed, but one can hover over the search results for topics to find out which have most views:

Gifted Phoenix has a Scoop.it topic which is still very much a work in progress.

.

Storify

Storify is a slightly different animal to the other three tools. It describes itself as:

‘the leading social storytelling platform, enabling users to easily collect tweets, photos, videos and media from across the web to create stories that can be embedded on any website.  With Storify, anyone can curate stories from the social web to embed on their own site and share on the Storify platform.’

Estimates of user numbers vary but are typically from 850,000 to 1m.

Storify is a flexible tool whose free service permits one to collect material already located on the platform and from a range of other sources including Twitter, Facebook, You Tube, Flickr, Instagram, Google search, Tumblr – or via RSS or URL.

The downside is that there is no way to search within Storify for stories or users, so one cannot provide information about the level of activity or users that it might be helpful to follow.

However, a Google search reveals that users of Storify include:

  • IGGY with 9 followers

These tiny numbers show that Storify has not really taken off as a curational platform in its own right, though it is an excellent supporting tool, particularly for recording transcripts of Twitter chats.

Gifted Phoenix has a Storify profile and uses the service occasionally.

 .

The Cold Shoulder in Perth Zoo by Gifted Phoenix

The Cold Shoulder in Perth Zoo by Gifted Phoenix

.

Comparing the six organisations

So, having reviewed wider gifted education-related activity on these ten social media platforms and tools, it is time to revisit the online and social media profile of the six selected organisations.

.

World Council

The WCGTC website was revised in 2012 and has a clear and contemporary design.

The Council’s Mission Statement has a strong networking feel to it and elsewhere the website emphasises the networking benefits associated with membership:

‘…But while we’re known for our biennial conference the spirit of sharing actually goes on year round among our membership.

By joining the World Council you can become part of this vital network and have access to hundreds of other peers while learning about the latest developments in the field of gifted children.’

The home page includes direct links to the organisation’s Facebook Page and Twitter feed. There is also an RSS feed symbol but it is not active.

Both Twitter and Facebook are of course available to members and non-members alike.

At the time of writing, the Facebook page has 1,616 ‘likes’ and is relatively current, with five posts in the last month, though there is relatively little comment on these.

The Twitter feed typically manages a daily Tweet. Hashtags are infrequently if ever employed. At the time of writing the feed has 1,076 followers.

Almost all the Tweets are links to a daily paper.li production ‘WCGTC Daily’ which was first published in late July 2013, just before the last biennial conference. This has 376 subscribers at the present time, although the gifted education coverage is selective and limited.

However, the Council’s most recent biennial conference was unusual in making extensive use of social media. It placed photographs on Flickr, videos of keynotes on YouTube and podcasts of keynotes on Mixlr.

There was also a Blog – International Year of Giftedness and Creativity – which was busy in the weeks immediately preceding the Conference, but has not been active since.

There are early signs that the 2015 Conference will also make strong use of social media. In addition to its own website, it already has its own presence on Twitter and Facebook.

One of the strands of the 2015 Conference is:

‘Online collaboration

  • Setting the stage for future sharing of information
  • E-networking
  • E-learning options’

And one of the sponsors is a social media company.

As noted above, the World Council website provides links to two of its six strands of social media activity, but not the remaining four. It is not yet serving as an effective hub for the full range of this activity.

Some of the strands link together well – eg Twitter to paper.li – but there is considerable scope to improve the incidence and frequency of cross-referencing.

.

ECHA

Of the six organisations in this sample, ECHA is comfortably the least active in social media with only a Facebook page available to supplement its website.

The site itself is rather old-fashioned and could do with a refresh. It includes a section ‘Introducing ECHA’ which emphasises the organisation’s networking role:

‘The major goal of ECHA is to act as a communications network to promote the exchange of information among people interested in high ability – educators, researchers, psychologists, parents and the highly able themselves. As the ECHA network grows, provision for highly able people improves and these improvements are beneficial to all members of society.’

This is reinforced in a parallel Message from the President.

There is no reference on the website to the Facebook group which is closed, but not confined solely to ECHA members. There are currently 191 members. The group is fairly active, but does not rival those with far more members listed above.

There’s not much evidence of cross-reference between the Facebook group and the website, but that may be because the website is infrequently updated.

As with the World Council, ECHA conferences have their own social media profile.

At the 2012 Conference in In Munster this was left largely to the delegates. Several of us live Tweeted the event.

I blogged about the Conference and my part in it, providing links to transcripts of the Twitter record. The post concluded with a series of learning points for this year’s ECHA Conference in Slovenia.

The Conference website explains that the theme of the 2014 event is ‘Rethinking Giftedness: Giftedness in the Digital Age’.

Six months ahead of the event, there is a Twitter feed with 29 followers that has been dormant for three months at the time of writing and a LinkedIn group with 47 members that has been quiet for five months.

A Forum was also established which has not been used for over a year. There is no information on the website about how the event will be supported by social media.

I sincerely hope that my low expectations will not be fulfilled!

.

SENG

SENG is far more active across social media. Its website carries a 2012 copyright notice and has a more contemporary feel than many of the others in this sample.

The bottom of the home page extends an invitation to ‘connect with the SENG community’ and carries links to Facebook, Twitter and LinkedIn (though not to Google+ or You Tube).

In addition, each page carries a set of buttons to support the sharing of this information across a wide range of social media.

The organisation’s Strategic Plan 2012-2017 makes only fleeting reference to social media, in relation to creating a ‘SENG Liaison Facebook page’ to support inter-state and international support.

It does, however, devote one of its nine goals to the further development of its webinar programme (each costs $40 to access or $40 to purchase a recording for non-participants).

SENG offers online parent support groups but does not state which platform is used to host these. It has a Technology/Social Media Committee but its proceedings are not openly available.

Reference has already been made above to the principal Facebook Page which is popular, featuring posts on most days and a fair amount of interaction from readers.

The parallel group for SENG Liaisons is also in place, but is closed to outsiders, which rather seems to defeat the object.

The SENG Twitter feed is relatively well followed and active on most days. The LinkedIn page is somewhat less active but can boast 142 followers while Google+ is clearly a new addition to the fold.

The You Tube channel has 257 subscribers however and carries 16 videos, most of them featuring presentations by James Webb. Rather strangely, these don’t seem to feature in the media library carried by the website.

SENG is largely a voluntary organisation with little staff resource, but it is successfully using social media to extend its footprint and global influence. There is, however, scope to improve coherence and co-ordination.

.

National Association for Gifted Children

The NAGC’s website is also in some need of refreshment. Its copyright notice dates from 2008, which was probably when it was designed.

There are no links to social media on the home page but ‘NAGC at a glance’ carries a direct link to the Facebook group and a Twitter logo without a link, while the page listing NAGC staff has working links to both Facebook and Twitter.

In the past, NAGC has been more active in this field.

There was for a time a Parenting High Potential Blog but the site is now marked private.

NAGC’s Storify account contains the transcripts of 6 Twitter chats conducted under the hashtag #nagcchat between June and August 2012. These were hosted by NAGC’s Parent Outreach Specialist.

But, by November 2012 I was tweeting:

.

.

And in February 2013:

.

.

This post was filled by July 2013. The postholder seems to have been concentrating primarily on editing the magazine edition of Parenting High Potential, which is confined to members only (but also has a Facebook presence – see below).

NAGC’s website carries a document called ‘NAGC leadership initiatives 2013-14’ which suggests further developments in the next few months.

The initiatives include:

‘Leverage content to intentionally connect NAGC resources, products and programs to targeted audiences through an organization-wide social media strategy.’

and

‘Implement a new website and membership database that integrates with social media and provides a state-of-the-art user interface.’

One might expect NAGC to build on its current social media profile which features:

  • A Facebook Group which currently has 2,420 members and is reasonably active, though not markedly so. Relatively few posts generate significant comments.
  • A Twitter feed boasting an impressive 4,287 followers. Tweets are published on a fairly regular basis

There is additional activity associated with the Annual NAGC Convention. There was extensive live Tweeting from the 2013 Convention under the rival hashtags #NAGC2013 and #NAGC13. #NAGC14 looks the favourite for this year’s Convention which has also established a Facebook presence

NAGC also has its own networks. The website lists 15 of these but hardly any of their pages give details of their social media activity. A cursory review reveals that:

Overall, NAGC has a fairly impressive array of social media activity but demonstrates relatively little evidence of strategic coherence and co-ordination. This may be expected to improve in the next six months, however.

.

NACE

NACE is not quite the poorest performer in our sample but, like ECHA, it has so far made relatively little progress towards effective engagement with social media.

Its website dates from 2010 but looks older. Prominent links to Twitter and Facebook appear on the front page as well as – joy of joys – an RSS feed.

However, the Facebook link is not to a NACE-specific page or group and the RSS feed doesn’t work.

There are references on the website to the networking benefits of NACE membership, but not to any role for the organisation in wider networking activity via social media. Current efforts seem focused primarily on advertising NACE and its services to prospective members and purchasers.

The Twitter feed has a respectable 1,426 followers but Tweets tend to appear in blocks of three or four spaced a few days apart. Quality and relevance are variable.

The Google+ page and You Tube channel contain the same two resources, posted last November.

There is much room for improvement.

.

Potential Plus UK

All of which brings us back to Potential Plus and the work I have been supporting to strengthen its online and social media presence.

.

Current Profile

Potential Plus’s current social media profile is respectably diverse but somewhat lacking in coherence.

The website is old-fashioned. There is a working link to Facebook on the home page, but this takes readers to the old NAGC Britain page which is no longer used, rather than directing them to the new Potential Plus UK page.

Whereas the old Facebook page had reached 1,344 likes, the new one is currently at roughly half that level – 683 – but the level of activity is reasonably impressive.

There is a third Facebook page dedicated to the organisation’s ‘It’s Alright to Be Bright’ campaign, which is not quite dormant.

All website pages carry buttons supporting information-sharing via a wide range of social media outlets. But there is little reference in the website content to its wider social media activity.

The Twitter feed is fairly lively, boasting 1,093 followers. It currently has some 400 fewer followers than NACE but has published about 700 more Tweets. Both are publishing at about the same rate. Quality and relevance are similarly variable.

The LinkedIn page is little more than a marker and does not list the products offered.

The Google+ presence uses the former NAGC Britain name and is also no more than a marker.

But the level of activity on Pinterest is more significant. There are 14 boards each containing a total of 271 pins and attracting 26 followers.  This material has been uploaded during 2014.

There is at present no substantive blog activity, although the stub of an old wordpress.com site still exists and there is also a parallel stub of an old wordpress.com children’s area.

There are no links to any of these services from the website – nor do these services link clearly and prominently with each other.

.

Future Strategy

The new wordpress.com test site sets out our plans for Potential Plus UK, which have been shaped in accordance with the two sets of draft success criteria above.

The purpose of the project is to help the organisation to:

  • improve how it communicates and engage with its different audiences clearly and effectively
  • improve support for members and benefit all its stakeholder groups
  • provide a consistently higher quality and more compelling service than its main competitors that generates maximum benefit for minimum cost

Subject to consultation and if all goes well, the outcome will be:

  • A children’s website on wordpress.org
  • A members’ and stakeholders’ website on wordpress.com (which may transfer to wordpress.org in due course)
  • A new forum and a new ‘bottom-up’ approach to support that marries curation and collaboration and
  • A coherent social media strategy that integrates these elements and meets audiences’ needs while remaining manageable for PPUK staff.

You can help us to develop this strategy by responding to the consultation here by Friday 18 April.

.

La Palma Panorama by Gifted Phoenix

La Palma Panorama by Gifted Phoenix

.

Conclusion

.

Gifted Phoenix

I shall begin by reflecting on Gifted Phoenix’s profile across the ten elements included in this analysis:

  • He has what he believes is a reasonable Blog.
  • He is one of the leading authorities on gifted education on Twitter (if not the leading authority).
  • His Facebook profile consists almost exclusively of ‘repeats’ from his Twitter feed.
  • His LinkedIn page reflects a different identity and is not connected properly to the rest of his profile.
  • His Google+ presence is embryonic.
  • He has used Scoop.it and Storify to some extent, but not Paper.li or Pinterest.

GP currently has a rather small social media footprint, since he is concentrating on doing only two things – blogging and microblogging – effectively.

He might be advised to extend his sphere of influence by distributing the limited available human resource more equitably across the range of available media.

On the other hand he is an individual with no organisational objectives to satisfy. Fundamentally he can follow his own preferences and inclinations.

Maybe he should experiment with this post, publishing it as widely as possible and monitoring the impact via his blog analytics…

.

The Six Organisations

There is a strong correlation between the size of each organisation’s social media footprint and the effectiveness with which they use social media.

There are no obvious examples – in this sample at least – of organisations that have a small footprint because of a deliberate choice to specialise in a narrow range of media.

If we were to rank the six in order of effectiveness, the World Council, NAGC and SENG would be vying for top place, while ECHA and NACE would be competing for bottom place and Potential Plus UK would be somewhere in the middle.

But none of the six organisations would achieve more than a moderate assessment against the two sets of quality criteria. All of them have huge scope for improvement.

Their priorities will vary, according to what is set out in their underlying social media strategies. (If they have no social media strategy, the obvious priority is to develop one, or to revise it if it is outdated.)

.

The Overall Picture across the Five Aspects of Gifted Education

This analysis has been based on the activities of a small sample of six generalist organisations in the gifted education field, as well as wider activity involving a cross-section of tools and platforms.

It has not considered providers who specialise in one of the five aspects – advocacy, learning, professional development, policy-making and research – or the use being made of specialist social media, such as MOOCs and research tools.

So the judgements that follow are necessarily approximate. But nothing I have seen across the wider spectrum of social media over the past 18 months would seriously call into question the conclusions reached below.

  • Advocacy via social media is slightly stronger than it was in 2012 but there is still much insularity and too little progress has been made towards a joined up global movement. The international organisations remain fundamentally inward-looking and have been unable to offer the leadership and sense of direction required.  The grip of the old guard has been loosened and some of the cliquey atmosphere has dissipated, but academic research remains the dominant culture.
  • Learning via social media remains limited. There are still several niche providers but none has broken through in a global sense. The scope for fruitful partnership between gifted education interests and one or more of the emerging MOOC powerhouses remains unfulfilled. The potential for social media to support coherent and targeted blended learning solutions – and to support collaborative learning amongst gifted learners worldwide – is still largely unexploited.
  • Professional development via social media has been developed at a comparatively modest level by several providers, but the prevailing tendency seems to be to regard this as a ‘cash cow’ generating income to support other activities. There has been negligible progress towards securing the benefits that would accrue from systematic international collaboration.
  • Policy-making via social media is still the poor relation. The significance of policy-making (and of policy makers) within gifted education is little appreciated and little understood. What engagement there is seems focused disproportionately on lobbying politicians, rather than on developing at working level practical solutions to the policy problems that so many countries face in common.
  • Research via social media is negligible. The vast majority of academic researchers in the field are still caught in a 20th Century paradigm built around publication in paywalled journals and a perpetual round of face-to-face conferences. I have not seen any significant examples of collaboration between researchers. A few make a real effort to convey key research findings through social media but most do not. Some of NAGC’s networks are beginning to make progress and the 2013 World Conference went further than any of its predecessors in sharing proceedings with those who could not attend. Now the pressure is on the EU Talent Conference in Budapest and ECHA 2014 in Slovenia to push beyond this new standard.

Overall progress has been limited and rather disappointing. The three conclusions I drew in 2012 remain valid.

In September 2012 I concluded that ‘rapid acceleration is necessary otherwise gifted education will be left behind’. Eighteen months on, there are some indications of slowly gathering speed, but the gap between practice in gifted education and leading practice has widened meanwhile – and the chances of closing it seem increasingly remote.

Back in 2010 and 2011 several of my posts had an optimistic ring. It seemed then that there was an opportunity to ‘only connect’ globally, but also at European level via the EU Talent Centre and in the UK via GT Voice. But both those initiatives are faltering.

My 2012 post also finished on an optimistic note:

‘Moreover, social media can make a substantial and lasting contribution to the scope, value and quality of gifted education, to the benefit of all stakeholders, but ultimately for the collective good of gifted learners.

No, ‘can’ is too cautious, non-assertive, unambitious. Let’s go for WILL instead!’

Now in 2014 I am resigned to the fact that there will be no great leap forward. The very best we can hope for is disjointed incremental improvement achieved through competition rather than collaboration.

I will be doing my best for Potential Plus UK. Now what about you?

.

GP

March 2014