Proposals for a 2015 Schools White Paper: Most able

. 

This post sets out for consideration some ideas to inform a new ‘most able learners’ policy’ for inclusion in a forthcoming schools white paper.

paper-32377_1280Background

Now that we have a majority Conservative Government, attention is switching to the shape of its education policy agenda for the next five years.

Parliament will be recalled on 18 May and the new Government’s legislative agenda will be set out on 27 May in the Queen’s Speech.

During the Election campaign, Prime Minister Cameron announced plans for a Schools Bill within the first 100 days of the new Parliament.

That deadline expires on 26 August, during the long summer holiday, so one would expect the Bill to be published before term ends on 22 July or, failing that, in early September.

Cameron said the Bill would contain:

‘…more radical measures to ensure young people leave education with the skills they need. It will include new powers to force coasting schools, as well as failing schools, to accept new leadership, continuing the remarkable success story of Britain’s academy schools.’

DfE civil servants will already have established which Conservative Manifesto pledges require primary legislation, but Ministerial clarification will be required and there may be some as yet undeclared priorities to add to the list.

Some likely contenders include:

  • Resits of KS2 tests in Year 7 and making the EBacc compulsory in secondary schools.
  • Any school considered by Ofsted to Require Improvement will be handed over to ‘the best headteachers – backed by expert sponsors or high-performing neighbouring schools – unless it can demonstrate that it has a plan to improve rapidly’.
  • Permission for ‘all good schools to expand, whether they are maintained schools, academies, free schools or grammar schools’.
  • The establishment of an independent College of Teaching.

It is customary for new governments to publish a white paper covering the areas in which they intend to legislate, so we might expect either a Schools or Education White Paper by the end of the summer term.

Between School Selection

The prospects for renewed emphasis on selection are already being discussed. I gave a detailed account of the pre-Election scenario in ‘The Politics of Selection: Grammar schools and disadvantage’ (November 2014).

Key factors include:

  • The postponed decision on whether to approve a grammar school annexe in Sevenoaks and the precedent that would set elsewhere.
  • The existing scope for grammar schools – whether academies or LA-maintained – to increase their planned admission numbers (PAN), typically by adding additional forms of entry (FE).
  • The campaign by centre-right Tory group Conservative Voice to change the law to permit the establishment of new grammar schools, supported by messrs Brady, Davis and Fox, together with early indications of greater influence for Tory backbenchers through the 1922 Committee which Brady chairs.
  • Coded expressions of support from both Home Secretary May and newly-established Cabinet member Johnson, both considered future contenders for the Tory party leadership.

It will be important to establish a clear demarcation line in government policy.

.

Within School Selection

Back in 2007, when in Opposition, Prime Minister Cameron signalled a shift of emphasis, away from grammar schools and towards setting:

‘When I say I oppose nationwide selection by 11 between schools, that does not mean I oppose selection by academic ability altogether.

Quite the reverse. I am passionate about the importance of setting by ability within schools, so that we stretch the brightest kids and help those in danger of being left behind.’

With a Conservative Government this would be a motor of aspiration for the brightest kids from the poorest homes – effectively a ‘grammar stream’ in every subject in every school.’

In September 2014, there were indications of a revival of this strategy, though it was rapidly relegated into plans for Regional Schools Commissioners, newly empowered to intervene in any school rated inadequate by Ofsted to consider enforced setting as one of a ‘menu of options’.

I discussed the evolution of this position in ‘The Politics of Setting’ (November 2014).

In the event, this additional role for Commissioners did not feature in the Conservative Manifesto, so we do not know whether enforced setting will be added to their armoury. This requires clarification in the White Paper.

Ofsted’s evidence

Shortly before election campaigning began, Ofsted published its second survey report on the education of the most able in non-selective secondary schools, which I reviewed in ‘The most able students: Has Ofsted made progress?’ (March 2015).

The Key Findings highlight a litany of shortcomings. The first three alone say:

  • ‘National data show that too many of the most able students are still being let down and are failing to reach their full potential.’
  • ‘Nationally, too many of our most able students fail to achieve the grades they need to get into top universities.’
  • ‘Schools visited were rarely meeting the distinct needs of students who are most able and disadvantaged.’

In relation to this third point, Ofsted found that no more than a third of schools were using pupil premium funding effectively to target the needs of such pupils.

The Report committed Ofsted to focusing within inspections on the progress of the most able disadvantaged, the quality of the curriculum and information, advice and guidance. We wait to see how this will be reflected in the updated School Inspection Handbooks scheduled for publication later this term.

Meanwhile, Ofsted is also preparing a ‘most able evaluation toolkit for schools’ as part of its wider efforts to influence school improvement. The toolkit should feature in the White Paper and there is scope to consider building additional support around it.

.

Excellence Gaps and Pupil Premium

The Conservative Manifesto gave a clear commitment:

‘We will continue to provide the pupil premium, protected at current rates, so that schools receive additional money for those from the poorest backgrounds.’

It added:

‘And we will make schools funding fairer. We have already increased funding for the 69 least well-funded local authorities in the country, and will make this the baseline for their funding in the next Parliament.’

Teach First leads a group of educational organisations lobbying for pupil premium to be reallocated in such a way that those with lower prior attainment attract double the rate awarded to those whose prior attainment is at or above expectations.

I have been campaigning against this proposal, principally on the grounds that:

  • It robs Peter to pay Paul, inflicting collateral damage on the majority of eligible learners, including the ‘most able disadvantaged’, the majority of whom are already poorly served, as Ofsted has established.
  • Closing gaps between disadvantaged learners and their peers should continue to take priority over closing attainment gaps between low and high attainers. The core purpose of pupil premium should be tackling underachievement – rather than low achievement – amongst disadvantaged learners.
  • Any increase in funding weighted towards low prior attainment should be secured through reform of the school funding formula and involve careful consideration of the overlaps between deprivation, low attainment and additional needs, including SEN.

My own efforts to increase the priority attached to the most able disadvantaged include presenting the evidence base for excellence gaps which I define as:

‘The difference between the percentage of disadvantaged learners who reach a specified age- or stage-related threshold of high achievement – or who secure the requisite progress between two such thresholds – and the percentage of all other eligible learners that do so.’

There is increasing focus on excellence gaps in this country and they should be more fully reflected in Government policy as enshrined in the White Paper. Further assurances should be given over pupil premium rates and eligibility for them.

.

Other Manifesto commitments

The Conservative Manifesto includes – in a section headed ‘We will lead the world in maths and science’ – a generic commitment:

‘We will make sure that all students are pushed to achieve their potential and create more opportunities to stretch the most able.’

It is unclear whether this relates exclusively to maths and science. It might hint at the revival of a flagship policy of the last government, to establish a cadre of up to a dozen selective 16-19 maths free schools, which managed to generate just two of these.

As recommended towards the end of my latest post on these institutions there is plenty of scope to rationalise and reform the STEM talent pipeline more efficiently, so that it benefits students regardless of the schools and colleges they attend.

Those finalising the Tory Manifesto may have had in mind a rival Labour commitment – which didn’t make it into their manifesto – to establish a Gifted and Talented Fund. The purpose and application of this Fund, discussed here, were never clarified.

The Conservatives were wise not to take on board a poorly-conceived Policy Exchange proposal to introduce a National Scholarships Scheme. The idea behind this is to support the most talented undergraduates on condition that they attend a UK university and remain in the UK for three years after graduating. It has no merit whatsoever.

The way forward

Rather than adopt a piecemeal approach, or risk being tripped up by the febrile politics of selection, the new Government should actively consider the inclusion in its schools white paper of a holistic policy to support our high-attaining learners.

This would broaden the agenda and allow the Government to take credit for a more sophisticated, multi-stranded approach.

The policy should embrace primary, secondary and post-16 education, placing particular emphasis on reducing excellence gaps and improving access to our most selective universities.

.

.

Key elements of the policy should include:

  • Holding the line on grammar school expansion established in the Manifesto: expansion is permitted, through satellite schools where legally permissible, but new selective institutions are confined to 16+.
  • Incentivising and encouraging all existing grammar schools to give priority in their admission arrangements to learners eligible for the pupil premium – and supporting their wider efforts to work with primary schools to increase their intake of disadvantaged learners.
  • Sponsoring guidance and associated professional development for schools and colleges on effective institution-wide provision for their most able learners, developed from a set of core principles and designed to re-establish national consensus in this field. This should also feature Ofsted’s evaluation toolkit.
  • Sponsoring guidance for schools and colleges on the introduction of more flexible, radical and innovative grouping arrangements, extending beyond the confines of setting and streaming.
  • Developing a coherent strategy for strengthening the STEM talent pipeline which harnesses the existing infrastructure and makes high quality support accessible to all learners regardless of the schools and colleges they attend.
  • Top-slicing £50m from the pupil premium budget to underwrite a coherent market-driven programme supporting high-attaining disadvantaged students to progress to selective universities. This would integrate the ‘push’ from schools and colleges with the ‘pull’ from higher education achieving efficiencies on both sides.
  • Incentivising schools to give higher priority to disadvantaged high attainers by protecting their pupil premium entitlement and sharpening accountability arrangements, including Ofsted inspection but also the publication of key indicators in Performance Tables under the new assessment regime.
  • Building system-wide capacity, by establishing centres of excellence and a stronger cadre of expert teachers, but also by fostering collaboration and partnership between schools, colleges and all other sources of relevant expertise.

.

GP

May 2015

Has Ofsted improved inspection of the most able?

.

This post examines the quality of Ofsted reporting on how well secondary schools educate their most able learners.

keep-calm-and-prepare-for-ofsted-6The analysis is based on a sample of 87 Section 5 inspection reports published during March 2015.

I have compared the results with those obtained from a parallel exercise undertaken a year ago and published in How well is Ofsted reporting on the most able? (May 2014).

This new post considers how inspectors’ assessments have changed in the light of their increased experience, additional guidance and – most recently – the publication of Ofsted’s survey report: The most able students: An update on progress since June 2013.

This appeared on 4 March 2015, at the beginning of my survey period, although it was heralded in HMCI’s Annual Report and the various supporting materials published alongside it in December 2014. One might therefore expect it to have had an immediate effect on inspection practice.

Those seeking further details of either of these publications are cordially invited to consult the earlier posts I dedicated to them:

The organisation of this post is straightforward.

The first section considers how Ofsted expects its inspectors to report on provision for the most able, as required by the current Inspection Handbook and associated guidance. It also explores how those expectations were intended to change in the light of the Update on Progress.

Subsequent sections set out the findings from my own survey:

  • The nature of the 2015 sample – and how this differs from the 2014 sample
  • Coverage in Key Findings and Areas for Improvement
  • Coverage in the main body of reports, especially under Quality of Teaching and Achievement of Pupils, the sections that most commonly feature material about the most able

The final section follows last year’s practice in offering a set of key findings and areas for improvement for consideration by Ofsted.

I have supplied page jumps to each section from the descriptions above.

How inspectors should address the most able

.

Definition and distribution

Ofsted nowhere explains how inspectors are to define the most able. It is not clear whether they permit schools to supply their own definitions, or else apply the distinctions adopted in their survey reports. This is not entirely helpful to schools.

In the original survey – The most able students: Are they doing as well as they should in our non-selective secondary schools? (June 2013) – Ofsted described the most able as:

‘…the brightest students starting secondary school in Year 7 attaining Level 5 or above, or having the potential to attain Level 5 and above, in English (reading and writing) and/or mathematics at the end of Key Stage 2.’

The measure of potential is not defined, but an example is given, of EAL students who are new to the country and so might not (yet) have achieved Level 5.

In the new survey prior attainment at KS2 remains the indicator, but the reference to potential is dropped:

‘…students starting secondary school in Year 7 having attained Level 5 or above in English (reading and writing) and/or mathematics at the end of Key Stage 2’

The size of this group varies at national level according to the year group.

If we take learners in Year 7 who completed KS2 in 2014, the data shows that 24% achieved KS2 Level 5 in both English (reading and writing) and maths. A further 5% secured L5 in English (reading and writing only) while another 20% reached L5 in maths only.

So 49% of the present Year 7 are deemed high attainers.

.

Ofsted venn Capture

But this proportion falls to about 40% amongst those who completed KS4 in 2014 and so typically undertook KS2 assessment five years earlier in 2009.

Ofsted’s measure is different to the definition adopted in the Secondary Performance Tables which, although also based on prior attainment at KS2, depends on an APS of 30 or higher in KS2 tests in the core subjects.

Only ‘all-rounders’ count according to this definition, while Ofsted includes those who are relatively strong in either maths or English but who might be weak in the other subject. Neither approach considers achievement beyond the core subjects.

According to the Performance Tables definition, amongst the cohort completing KS4 in 2014, only 32.3% of those in state-funded schools were deemed high attainers, some eight percentage points lower than Ofsted’s figure.

The sheer size of Ofsted’s most able cohort will be surprising to some, who might naturally assume a higher hurdle and a correspondingly smaller group. The span of attainment it covers is huge, from one L5C (possibly paired with a L3) to three L6s.

But the generosity of Ofsted’s assumptions does mean that every year group in every school should contain at least a handful of high attainers, regardless of the characteristics of its intake.

Unfortunately, Ofsted’s survey report does not say exactly how many schools have negligible numbers of high attainers, telling us only how many non-selective schools had at least one pupil in their 2014 GCSE cohort with the requisite prior attainment in English, in maths and in both English and maths.

In each case some 2,850 secondary schools had at least one student within scope. This means that some 9% of schools had no students in each category, but we have no way of establishing how many had no students in all three categories.

Using the rival Performance Table definition, only some 92 state-funded non-selective secondary schools reported a 2014 GCSE cohort with 10% or fewer high attainers. The lowest recorded percentage is 3% and, of those with 5% or fewer, the number of high attaining students ranges from 1 to 9.

Because Ofsted’s definition is more liberal, one might reasonably assume that every secondary school has at least one high-attaining student per year group, though there will be a handful of schools with very few indeed.

At the other extreme, according to the Performance Tables definition, over 100 state-funded non-selective schools can boast a 2014 GCSE population where high attainers are in the majority – and the highest recorded percentage for a state-funded comprehensive is 86%. Using Ofsted’s measure, the number of schools in this position will be substantively higher.

For the analysis below, I have linked the number of high attainers (according to the Performance Tables) in a school’s 2014 GCSE cohort with the outcomes of inspection, so as to explore whether there is a relationship between these two variables.

Framework and Handbook

The current Framework for School Inspection (December 2014) makes no reference to the most able.

Inspectors must consider:

‘…the extent to which the education provided by the school meets the needs of the range of pupils at the school, and in particular the needs of disabled pupils and those who have special educational needs.’

One of the principles of school inspection is that it will:

‘focus on pupils’ and parents’ needs by…evaluating the extent to which schools provide an inclusive environment that meets the needs of all pupils, irrespective of age, disability, gender, race, religion or belief, or sexual orientation’.

Neither ability nor attainment is mentioned. This may or may not change when the Common Inspection Framework is published.

The most recent version of the School Inspection Handbook (December 2014) has much more to say on the issue. All relevant references in the main text and in the grade descriptors are set out in the Annex at the end of this post.

Key points include:

  • Ofsted uses inconsistent terminology (‘most able’, ‘more able’, ‘highest attainers’) without distinguishing between these terms.
  • Most of the references to the most able occur in lists of different groups of learners, another of which is typically ‘disadvantaged pupils’. This gives the mistaken impression that the two groups are distinct – that there is no such thing as a most able disadvantaged learner.
  • The Common Inspection Framework will be supported by separate inspection handbooks for each sector. The consultation response does not mention any revisions relating to the most able; neither does the March 2015 survey report say that revisions will be introduced in these handbooks to reflect its findings and recommendations (but see below). 

.

Guidance

Since the first survey report was published in 2013, several pieces of guidance have issued to inspectors.

  • In Schools and Inspection (October 2013), inspectors’ attention is drawn to key revisions to the section 5 inspection framework:

‘In judging the quality of teaching…Inspectors will evaluate how teaching meets the needs of, and provides appropriate challenge to, the most able pupils. Underachievement of the most able pupils can trigger the judgements of inadequate achievement and inadequate teaching.’

In relation to report writing:

‘Inspectors are also reminded that they should include a short statement in the report on how well the most able pupils are learning and making progress and the outcomes for these pupils.’

  • In Schools and Inspection (March 2014) several amendments are noted to Section 5 inspection and report writing guidance from January of that year, including:

‘Most Able – Inspectors must always report in detail on the progress of the most able pupils and how effectively teaching engages them with work that is challenging enough.’

‘…must always report in detail on the progress of the most able pupils and how effectively teaching engages them with work that is challenging enough.’

Moreover, for secondary schools:

‘There must be a comment on early entry for GCSE examinations. Where the school has an early entry policy, inspectors must be clear on whether early entry is limiting the potential of the most able pupils. Where early entry is not used, inspectors must comment briefly to that effect.’

  • In School Inspection Update (December 2014) Ofsted’s National Director, Schools reminds inspectors, following the first of a series of half-termly reviews of ‘the impact of policy on school inspection practice’, to:

‘…place greater emphasis, in line with the handbook changes from September, on the following areas in section 5 inspection reports…The provision and outcomes for different groups of children, notably the most-able pupils and the disadvantaged (as referred to in the handbook in paragraphs 40, 129, 137, 147, 155, 180, 186, 194, 195, 196, 207, 208, 210 and 212).’

HMCI’s Annual Report

The 2014 Annual Report said (my emphasis):

‘Ofsted will continue to press schools to stretch their most able pupils. Over the coming year, inspectors will be looking at this more broadly, taking into account the leadership shown in this area by schools. We will also further sharpen our recommendations so that schools have a better understanding of how they can help their most able pupils to reach their potential.’

HMCI’s Commentary on the Report  added for good measure:

‘In the year ahead, Ofsted will look even more closely at the performance of the brightest pupils in routine school inspections.’

So we are to expect a combination of broader focus, closer scrutiny and sharper recommendations.

The Annual Report relates to AY2013/14 and was published at the end of the first term of AY2014/15 and the end of calendar year 2014, so one assumes that references to the ‘coming year’ and ‘the year ahead’ are to calendar year 2015.

We should be able to see the impact of this ramping up in the sample I have selected, but some further change is also likely.

March 2015 survey report

One of the key findings from the March 2015 survey was (my emphasis):

Ofsted has sharpened its focus on the progress and quality of teaching of the most able students. We routinely comment on the achievement of the most able students in our inspection reports. However, more needs to be done to develop a clearer picture of how well schools use pupil premium funding for their most able students who are disadvantaged and the quality of information, advice and guidance provided for them. Ofsted needs to sharpen its practice in this area.’

Ofsted directed three recommendations at itself which do not altogether reflect this (my emboldening):

‘Ofsted should:

  • Make sure that inspections continue to focus sharply on the progress made by students who are able and disadvantaged.
  • Report more robustly about how well schools promote the needs of the most able through the quality of their curriculum and the information, advice and guidance they offer to the most able students.
  • Ensure thematic surveys investigate, where appropriate, how well the most able are supported through, for example, schools’ use of the pupil premium and the curriculum provided.’

The first of these recommendations implies that inspections already focus sufficiently on the progress of able and disadvantaged learners – an assumption that we shall test in the analysis below. It therefore implies that no further change is necessary.

The third alludes to the most able disadvantaged but relates solely to thematic surveys, not to Section 5 inspection reports.

The second may imply that further emphasis will be placed on inspecting the appropriateness of the curriculum and IAG. Both of these topics seem likely to feature more strongly in a generic sense in the new Framework and Handbooks. One assumes that this will be extended to the most able, amongst other groups.

Though not mentioned in the survey report, we do know that Ofsted is preparing an evaluation toolkit. This was mentioned in a speech given by its Schools Director almost immediately after publication:

‘In this region specifically, inspectors have met with headteachers to address the poor achievement of the brightest disadvantaged children.

And inspectors are developing a most able evaluation toolkit for schools, aligned to that which is in place for free school meals.’

It is not clear from this whether the toolkit will be confined only to the most able disadvantaged or will have wider coverage.

Moreover, this statement raises the prospect that the toolkit might be similar in style to The Pupil Premium: Analysis and challenge tools for schools (January 2013). This is more akin to an old spanner than a Swiss army penknife. Anything of this nature would be rather less helpful than the term ‘toolkit’ implies.

At his request, I emailed Ofsted’s Director, Schools with questions on 21 March 2015. I requested further details of the toolkit. At the time of writing I have still to receive a reply.

.

The sample

I have selected an almost identical sample to that used in my 2014 analysis, one year on. It includes the 87 Section 5 inspection reports on secondary schools (excluding middle schools deemed secondary) that were published by Ofsted in the month of March 2015.

The bulk of the inspections were undertaken in February 2015, though a few took place in late January or early March.

Chart 1 gives the regional breakdown of the schools in the sample. All nine regions are represented, though there are only five schools from the North East, while Yorkshire and Humberside boasts 15. There are between seven and 11 schools in each of the other regions. In total 59 local authorities are represented.

In regional terms, this sample is more evenly balanced than the 2014 equivalent and the total number of authorities is two higher.

 .

Ofanal 1

Chart 1: Schools within the sample by region

Chart 2 shows how different statuses of school are represented within the sample.

All are non-selective. Fifty-three schools (61%) are academies, divided almost equally between the sponsored and converter varieties.

Community and foundation schools together form a third group of equivalent size, while the seven remaining schools have voluntary status, just one of them voluntary controlled. There are no free schools.

.

Ofanal 2

Chart 2: Schools within the sample by status

.

All but three of the schools are mixed – and those three are boys’ schools.

As for age range, there is one 13-18 and one 14-18 school. Otherwise there are 32 11-16 institutions (37% of the sample) while the remaining 53 (61%) are 11-18 or 11-19 institutions.

Chart 3 shows the variation in numbers on roll. The smallest school – a new 11-18 secondary school – has just 125 pupils; the largest 2083. The average is 912.

Fifty-two schools (60%) are between 600 and 1,200 and twenty-three (26%) between 800 and 1,000 pupils.

.

Ofanal 3

Chart 3: Schools within the sample by NOR

. 

Chart 4 shows the overall inspection grade of schools within the sample. A total of 19 schools (22%) are rated inadequate, seven of them attracting special measures. Only nine (10%) are outstanding, while 27 (31%) are good and 32 (37%) require improvement.

This is very similar to the distribution in the 2014 sample, except that there are slightly more inadequate schools and slightly fewer requiring improvement.

.

Ofanal 4

Chart 4: Schools within the sample by overall inspection grade

Unlike the 2104 analysis, I have also explored the distribution of all grades within reports. The results are set out in Chart 5.

Schools in the sample are relatively more secure on Leadership and management (55% outstanding or good) and Behaviour and safety of pupils (60% outstanding or good) than they are on Quality of teaching (43% outstanding or good) and Achievement of pupils (41% outstanding or good).

.

Ofanal 5

Chart 5: Schools within the sample by inspection sub-grades

Another new addition this year is comparison with the number and percentage of high attainers.

Amongst the sample, the number of high attainers in the 2014 GCSE cohort varied from three to 196 and the percentage from 3% to 52%. (Two schools did not have a GCSE cohort in 2014.)

These distributions are shown on the scatter charts 6 and 7, below.

Chart 6 (number) shows one major outlier at the top of the distribution. The vast majority – 64% of the sample – record numbers between 20 and 60. The average number is 41.

.

Ofanal 6

Chart 6: Schools within the sample by number of high attainers (Secondary Performance Tables measure)

. 

Chart 7 again has a single outlier, this time at the bottom of the distribution. The average is 32%, slightly less than the 32.3% reported for all state-funded schools in the Performance Tables.

Two in five of the sample register a high attainer percentage of between 20% and 30%, while three in five register between 20% and 40%.

But almost a third have a high attainer population of 20% or lower.

.

Ofanal 7 

Chart 7: Schools within the sample by percentage of high attainers (Secondary Performance Tables measure)

Out of curiosity, I compared the overall inspection grade with the percentage of high attainers.

  • Amongst the nine outstanding schools, the percentage of high attainers ranged from 22% to 47%, averaging 33% (there was also one without a high attainer percentage).
  • Amongst the 27 good schools, the percentage of high attainers was between 13% and 52% (plus one without a high attainer percentage) and averaged 32%.
  • Amongst the 32 schools requiring improvement, the percentage of high attainers varied between 3% and 40% and averaged 23%.
  • Amongst the 19 inadequate schools, the percentage of high attainers lay between 10% and 38% and also averaged 23%.

This may suggest a tendency for outstanding/good schools to have a somewhat larger proportion of high attainers than schools judged to be requiring improvement or inadequate.

Key findings and areas for improvement

.

Distribution of comments

Thirty-nine of the reports in the sample (45%) address the most able in the Summary of key findings, while 33 (38%) do so in the section about what the school needs to do to improve further.

In 24 cases (28%) there were entries in both these sections, but in 39 of the reports (45%) there was no reference to the most able in either section.

In 2014, 34% of reports in the sample addressed the issue in both the main findings and recommendations and 52% mentioned it in neither of these sections.

These percentage point changes are not strongly indicative of an extended commitment to this issue.

In the 2015 sample it was rather more likely for a reference to appear in the key findings for community schools (53%) and foundation schools (50%) than it was for converter academies (44%), sponsored academies (42%) or voluntary schools (29%).

Chart 8 shows the distribution of comments in these sections according to the overall inspection grade. In numerical terms, schools rated as requiring improvement overall are most likely to attract comments in both Key findings and Areas for improvement related to the most able.

.

Ofanal 8

Chart 8: Most able mentioned in key findings and areas for improvement by overall inspection grade (percentages)

.

But, when expressed as percentages of the total number of schools in the sample attracting these grades, it becomes apparent that the lower the grade, the more likely such a comment will be received.

Of the 39 reports making reference in the key findings, 10 comments were positive, 28 were negative and one managed to be both positive and negative simultaneously:

‘While the most-able students achieve well, they are capable of even greater success, notably in mathematics.’ (Harewood College, Bournemouth)

.

Positive key findings

Five of the ten exclusively positive comments were directed at community schools.

The percentage of high attainers in the 2014 GCSE cohorts at the schools attracting positive comments varied from 13% to 52% and included three of the five schools with the highest percentages in the sample.

Interestingly, only two of the schools with positive comments received an overall outstanding grade, while three required improvement.

Examples of positive comments, which were often generic, include:

  • ‘The most able students achieve very well, and the proportion of GCSE A* and A grades is significantly above average across the curriculum.’ (Durham Johnston Comprehensive School, Durham)
  • ‘The most able students do well because they are given work that challenges them to achieve their potential’. (The Elton High School Specialist Arts College, Bury)
  • ‘Most able students make good progress in most lessons because of well-planned activities to extend their learning’. (Endon High School, Staffordshire)
  • ‘Teachers encourage the most able students to explore work in depth and to master skills at a high level’. (St Richard Reynolds Catholic High School, Richmond-upon-Thames).

Negative key findings

The distribution of the 28 negative comments in Key findings according to overall inspection grade was:  Outstanding (nil); Good five (19%); Requires improvement twelve (38%); Inadequate eleven (58%).

This suggests a relatively strong correlation between the quality of provision for the most able and the overall quality of the school.

The proportion of high attainers in the 2014 GCSE cohorts of the schools attracting negative comments varied between 3% and 42%. All but three are below the national average for state-funded schools on this measure and half reported 20% or fewer high attainers.

This broadly supports the hypothesis that quality is less strong in schools where the proportion of high attainers is comparatively low.

Examples of typical negative comments:

  • ‘The most able students are not given work that is hard enough’ (Dyson Perrins C of E Sports College, Worcestershire)
  • ‘Too many students, particularly the most able, do not make the progress of which they are capable’ (New Line Learning Academy, Kent)
  • ‘Students, particularly the more able, make slower progress in some lessons where they are not sufficiently challenged. This can lead to some off task behaviour which is not always dealt with by staff’ (The Ferrers School, Northamptonshire)
  • ‘Teachers do not always make sufficient use of assessment information to plan work that fully stretches or challenges all groups of students, particularly the most able’ (Noel-Baker School, Derby).

The menu of shortcomings identified is limited, consisting of seven items: underachievement (especially too few high GCSE grades), insufficient progress, low expectations, insufficiently challenging work, poor teaching quality, poor planning and poor use of assessment information.

Of these, the most common comprise a familiar litany. They are (in descending order): 

  • Insufficiently challenging work 
  • Insufficient progress 
  • Underachievement and 
  • Low expectations.

Inspectors often point out inconsistent practice, though in the worst instances these shortcomings are dominant or even school-wide.

.

No key findings

Chart 9 shows the distribution of reports with no comments about the most able in Key findings and Areas for improvement according to overall inspection grade. When expressed as percentages, these again show that schools rated as outstanding are most likely to escape such comments, while inadequate schools are most likely to be in the firing line.

.

Ofanal 9

Chart 9: Most able not mentioned in key findings and areas for improvement by inspection grade (percentages)

This pattern replicates the findings from 2014. Orders of magnitude are also broadly comparable.  There is no substantive evidence of a major increase in emphasis from inspectors.

It seems particularly surprising that, in over half of schools requiring improvement and a third or more of inadequate schools, issues with educating the most able are still not significant enough to feature in these sections of inspection reports.

.

Areas for improvement

By definition, recommendations for improvement are always associated with identified shortcomings.

The correlation between key findings and areas for improvement is inconsistent. In six cases there were Key findings relating to the most able, but no area for improvement specifically associated with those. Conversely, nine reports had identified areas for improvement that were not picked up in the key findings.

Areas for improvement are almost always formulaic and expressed as lists: the school should improve x through y and z.

When it comes to the most able, the area for improvement is almost invariably teaching quality, though sometimes this is indicated as the route to higher achievement while on other occasions teaching quality and raising achievement are perceived as parallel priorities.

Just one report in the sample mentioned the quality of leadership and management:

‘Ensure that leadership and management take the necessary steps to secure a significant rise in students’ achievement at the end of Year 11 through…ensuring that work set for the most able is always sufficiently challenging’ (New Line Learning Academy, Kent).

This is despite the fact that leadership was specifically mentioned as a focus in HMCI’s Annual Report.

The actions needed to bring about improvement reflect the issues mentioned in the analysis of key findings above. The most common involve applying assessment information to planning and teaching:

  • ‘Raise students’ achievement and the quality of teaching further by ensuring that:…all staff develop their use of class data to plan learning so that students, including the most able, meet their challenging targets’ (Oasis Academy Isle of Sheppey, Kent)
  • ‘Ensure the quality of teaching is always good or better, in order to raise attainment and increase rates of progress, especially in English and mathematics, by:…ensuring teachers use all the information available to them to plan lessons that challenge students, including the most able’ (Oasis Academy Lister Park, Bradford)
  • ‘Embed and sustain improvements in achievement overall and in English in particular so that teaching is consistently good and outstanding by: making best use of assessment information to set work that is appropriately challenging, including for the least and most able students’ (Pleckgate High School Mathematics and Computing College, Blackburn with Darwen)

Other typical actions involve setting more challenging tasks, raising the level of questioning, providing accurate feedback, improving lesson planning and maintaining consistently high expectations.

.

Coverage in the main body of reports

.

Leadership and management

Given the reference to this in HMCI’s Annual Report, one might have expected a new and significant emphasis within this section of the reports in the sample.

In fact, the most able were only mentioned in this section in 13 reports (15% of the total). Hardly any of these comments identified shortcomings. The only examples I could find were:

  • ‘The most-able students are not challenged sufficiently in all subjects to
    achieve the higher standards of which they are capable’ (Birkbeck School and Community Arts College, Lincolnshire)
  • ‘Action to improve the quality of teaching is not focused closely enough on the strengths and weaknesses of the school and, as a result, leaders have not done enough to secure good teaching of students and groups of students, including…the most able (Ashington High School Sports College, Northumberland)

Inspectors are much more likely to accentuate the positive:

  • ‘The school has been awarded the Challenge Award more than once. This is given for excellent education for a school’s most-able, gifted and talented students and for challenge across all abilities. Representatives from all departments attend meetings and come up with imaginative ways to deepen these students’ understanding.’ (Cheam High School, Sutton)
  • ‘Leaders and governors are committed to ensuring equality of opportunity for all students and are making effective use of student achievement data to target students who may need additional support or intervention. Leaders have identified the need to improve the achievement of…the most-able in some subjects and have put in place strategies to do so’ (Castle Hall academy Trust, Kirklees)
  • ‘Measures being taken to improve the achievement of the most able are effective. Tracking of progress is robust and two coordinators have been appointed to help raise achievement and aspirations. Students say improvements in teaching have been made, and the work of current students shows that their attainment and progress is on track to reach higher standards.’ (The Byrchall High School, Wigan).

Not one report mentioned the role of governors in securing effective provision for the most able. 

Given how often school leadership escapes censure for issues identified elsewhere in reports, this outcome could be interpreted as somewhat complacent. 

HMCI is quite correct to insist that provision for the most able is a whole school issue and, as such, a school’s senior leadership team should be held to account for such shortcomings.

Behaviour and safety

The impact of under-challenging work on pupils’ behaviour is hardly ever identified as a problem.

One example has been identified in the analysis of Key findings above. Only one other report mentions the most able in this section, and the comment is about the role of the school council rather than behaviour per se:

‘The academy council is a vibrant organisation and is one of many examples where students are encouraged to take an active role in the life of the academy. Sixth form students are trained to act as mentors to younger students. This was seen being effectively employed to…challenge the most able students in Year 9’ (St Thomas More High School, Southend)

A handful of reports make some reference under ‘Quality of teaching’ but one might reasonably conclude that neither  bullying of the most able nor disruptive behaviour from bored high attainers is particularly widespread.

Quality of teaching

Statements about the most able are much more likely to appear in this section of reports. Altogether 59 of the sample (68%) made some reference.

Chart 10 shows the correlation between the incidence of comments and the sub-grade awarded by inspectors to this aspect of provision. It demonstrates that, while differences are relatively small, schools deemed outstanding are rather more likely to attract such comment.

But only one of the comments on outstanding provision is negative and that did not mention the most able specifically:

‘Also, in a small minority of lessons, activities do not always deepen
students’ knowledge and understanding to achieve the very highest grades at GCSE and A level.’ (Central Foundation Boys’ School, Islington)

.

Ofanal 10

Chart 10: Incidence of comments under quality of teaching by grade awarded for quality of teaching

.

Comments are much more likely to be negative in schools where the quality of teaching is judged to be good (41%), requiring improvement (59%) and inadequate (58%).

Even so, a few schools in the lower two categories receive surprisingly positive endorsements:

  • ‘On the other hand, the most able students and the younger students in school consistently make good use of the feedback. They say they greatly value teachers’ advice….The teaching of the most able students is strong and often very strong. As a result, these students make good progress and, at times, achieve very well.’ (RI – The Elton High School Specialist Arts College, Bury)
  • ‘Teaching in mathematics is more variable, but in some classes, good and outstanding teaching is resulting in students’ rapid progress. This is most marked in the higher sets where the most able students are being stretched and challenged and are on track to reach the highest grades at GCSE…. In general, the teaching of the most able students….is good.’ (RI- New Charter Academy, Tameside)
  • ‘At its most effective, teaching is well organised to support the achievement of the most able, whose progress is better than other students. This is seen in some of the current English and science work.’ (I – Ely College, Cambridgeshire).

Negative comments on the quality of teaching supply a familiar list of shortcomings.

Some of the most perceptive are rather more specific. Examples include:

  • ‘While the best teaching allows all students to make progress, sometimes discussions that arise naturally in learning, particularly with more able students, are cut short. As a result, students do not have the best opportunity to explore ideas fully and guide their own progress.’ (Dyson Perrins C of E Sports College, Worcestershire)
  • ‘Teachers’ planning increasingly takes account of current information about students’ progress. However, some teachers assume that because the students are organised into ability sets, they do not need to match their teaching to individual and groups of students’ current progress. This has an inhibiting effect on the progress of the more able students in some groups.’ (Chulmleigh Community College, Devon)
  • ‘In too many lessons, particularly boys’ classes, teachers do not use questioning effectively to check students’ learning or promote their thinking. Teachers accept responses that are too short for them to assess students’ understanding. Neither do they adjust their teaching to revisit aspects not fully grasped or move swiftly to provide greater stretch and new learning for all, including the most able.’ (The Crest Academies, Brent)
  • ‘In some lessons, students, including the most able, are happy to sit and wait for the teacher to help them, rather than work things out for themselves’ (Willenhall E-ACT Academy, Walsall).

Were one compiling a list of what to do to impress inspectors, it would include the following items:

  • Plans lessons meticulously with the needs of the most able in mind 
  • Use assessment information to inform planning of work for the most able 
  • Differentiate work (and homework) to match most able learners’ needs and starting points 
  • Deploy targeted questioning, as well as opportunities to develop deeper thinking and produce more detailed pieces of work 
  • Give the most able the flexibility to pursue complex tasks and do not force them to participate in unnecessary revision and reinforcement 
  • Do not use setting as an excuse for neglecting differentiation 
  • Ensure that work for the most able is suitably challenging 
  • Ensure that subject knowledge is sufficiently secure for this purpose 
  • Maintain the highest expectations of what the most able students can achieve 
  • Support the most able to achieve more highly but do not allow them to become over-reliant on support 
  • Deploy teaching assistants to support the most able 
  • Respond to restlessness and low level disruption from the most able when insufficiently challenged.

While many of the reports implicitly acknowledge that the most able learners will have different subject-specific strengths and weaknesses, the implications of this are barely discussed.

Moreover, while a few reports attempt a terminological distinction between ‘more able’ and ‘most able’, the vast majority seem to assume that, in terms of prior attainment, the most able are a homogenous group, whereas – given Ofsted’s preferred approach – there is enormous variation.

Achievement of pupils 

This is the one area of reports where reference to the most able is now apparently compulsory – or almost compulsory.

Just one report in the sample has nothing to say about the achievement of the most able in this section: that on Ashby School in Leicestershire.

Some of the comments are relatively long and detailed, but others are far more cursory and the coverage varies considerably.

Using as an example the subset of schools awarded a sub-grade of outstanding for the achievement of pupils, we can exemplify different types of response:

  • Generic: ‘The school’s most able students make rapid progress and attain excellent results. This provides them with an excellent foundation to continue to achieve well in their future studies.’ (Kelvin Hall School, Hull)
  • Generic, progress-focused: ‘The most-able students make rapid progress and the way they are taught helps them to probe topics in greater depth or to master skills at a high level.’ (St Richard Reynolds Catholic High School, Richmond-upon-Thames)
  • Achievement-focused, core subjects: ‘Higher attaining students achieve exceptionally well as a result of the support and challenge which they receive in class. The proportion of students achieving the higher A* to A grade was similar to national averages in English but significantly above in mathematics.
  • Specific, achievement- and progress-focused: ‘Although the most able students make exceptional progress in the large majority of subjects, a few do not reach the very highest GCSE grades of which they are capable. In 2014, in English language, mathematics and science, a third of all students gained A and A* GCSE grades. Performance in the arts is a real strength. For example, almost two thirds of students in drama and almost half of all music students achieved A and A* grades. However, the proportions of A and A* grades were slightly below the national figures in English literature, geography and some of the subjects with smaller numbers of students (Central Foundation Boys’ School, Islington)

If we look instead at the schools with a sub-grade of inadequate, the comments are typically more focused on progress, but limited progress is invariably described as ‘inadequate’, ‘requiring improvement’, ‘weak’, ‘not good’, ‘not fast enough’. It is never quantified.

On the relatively few occasions when achievement is discussed, the measure is typically GCSE A*/A grades, most often in the core subjects.

It is evident from cross-referencing the Achievement of pupils sub-grade against the percentage of high attainers in the 2014 GCSE cohort that there is a similar correlation to that with the overall inspection grade:

  • In schools judge outstanding on this measure, the high attainer population ranges from 22% to 47% (average 33%)
  • In schools judged good, the range is from 13% to 52% (average 32%)
  • In schools requiring improvement it is between 3% and 40% (average 23%)
  • In schools rated inadequate it varies from 10% to 32% (average 22%)

.

Sixth Form Provision 

Coverage of the most able in sections dedicated to the sixth form is also extremely variable. Relatively few reports deploy the term itself when referring to 16-19 year-old students.

Sometimes there is discussion of progression to higher education and sometimes not. Where this does exist there is little agreement on the appropriate measure of selectivity in higher education:

  • ‘Students are aspiring to study at the top universities in Britain. This is a realistic prospect and illustrates the work the school has done in raising their aspirations.’ (Welling School, Bexley)
  • ‘The academy carefully tracks the destination of leavers with most students proceeding to university and one third of students gaining entry to a Russell Group university’ (Ashcroft Technology Academy, Wandsworth)
  • ‘Provision for the most able students is good, and an increasing proportion of students are moving on to the highly regarded ‘Russell group’ or Oxbridge universities. A high proportion of last year’s students have taken up a place at university and almost all gained a place at their first choice’ (Ashby School, Leicestershire)
  • ‘Large numbers of sixth form students progress to well-regarded universities’ (St Bartholomew’s School, West Berkshire)
  • ‘Students receive good support in crafting applications to universities which most likely match their attainment; this includes students who aspire to Oxford or Cambridge’ (Anthony Gell School, Derbyshire).

Most able and disadvantaged

Given the commitment in the 2015 survey report to ‘continue to focus sharply on the progress made by students who are able and disadvantaged’, I made a point of reviewing the coverage of this issue across all sections of the sample reports.

Suffice to say that only one report discussed provision for the most able disadvantaged students, in these terms:

‘Pupil premium funding is being used successfully to close the wide achievement gaps apparent at the previous inspection….This funding is also being effectively used to extend the range of experiences for those disadvantaged students who are most able. An example of this is their participation in a residential writing weekend.’ (St Hild’s C of E VA School, Hartlepool)

Take a bow Lead Inspector Petts!

A handful of other reports made more general statements to the effect that disadvantaged students perform equivalently to their non-disadvantaged peers, most often with reference to the sixth form:

  • ‘The few disadvantaged students in the sixth form make the same progress as other students, although overall, they attain less well than others due to their lower starting points’ (Sir Thomas Wharton Community College, Doncaster)
  • ‘There is no difference between the rates of progress made by disadvantaged students and their peers’ (Sarum Academy, Wiltshire)
  • ‘In many cases the progress of disadvantaged students is outstripping that of others. Disadvantaged students in the current Year 11 are on course to do
    every bit as well as other students.’ (East Point Academy, Suffolk).

On two occasions, the point was missed entirely:

  • ‘The attainment of disadvantaged students in 2014 was lower than that of other students because of their lower starting points. In English, they were half a grade behind other students in the school and nationally. In mathematics, they were a grade behind other students in the school and almost a grade behind students nationally. The wider gap in mathematics is due to the high attainment of those students in the academy who are not from disadvantaged backgrounds.’ (Chulmleigh Community College, Devon)
  • ‘Disadvantaged students make good progress from their starting points in relation to other students nationally. These students attained approximately two-thirds of a GCSE grade less than non-disadvantaged students nationally in English and in mathematics. This gap is larger in school because of the exceptionally high standards attained by a large proportion of the most able students…’ (Durham Johnston Comprehensive School, Durham)

If Ofsted believes that inspectors are already focusing sharply on this issue then, on this evidence, they are sadly misinformed.

Key Findings and areas for improvement

.

Key findings: Guidance

  • Ofsted inspectors have no reliable definition of ‘most able’ and no guidance on the appropriateness of definitions adopted by the schools they visit. The approach taken in the 2015 survey report is different to that adopted in the initial 2013 survey and is now exclusively focused on prior attainment. It is also significantly different to the high attainer measure in the Secondary Performance Tables.
  • Using Ofsted’s approach, the national population of most able in Year 7 approaches 50% of all learners; in Year 11 it is some 40% of all learners. The latter is some eight percentage points lower than the cohort derived from the Performance Tables measure.
  • The downside of such a large cohort is that it masks the huge attainment differences within the cohort, from a single L5C (and possibly a L3 in either maths or English) to a clutch of L6s. Inspectors might be encouraged to regard this as a homogenous group.
  • The upside is that there should be a most able presence in every year group of every school. In some comprehensive schools, high attainers will be a substantial majority in every year group; in others there will be no more than a handful.
  • Ofsted has not released data showing the incidence of high attainers in each school according to its measure (or the Performance Tables measure for that matter). This does not features in Ofsted’s Data Dashboard.
  • Guidance in the current School Inspection Handbook is not entirely helpful. There is not space in a Section 5 inspection report to respond to all the separate references (see Appendix for the full list). The terminology is confused (‘most able’, ‘more able’, ‘high attainers’).Too often the Handbook mentions several different groups alongside the most able, one of which is disadvantaged pupils. This perpetuates the false assumption that there are no most able disadvantaged learners. We do not yet know whether there will be wholesale revision when new Handbooks are introduced to reflect the Common Inspection Framework.
  • At least four pieces of subsidiary guidance have issued to inspectors since October 2013. But there has been nothing to reflect the commitments in HMCI’s Annual Report (including a stronger focus on school leadership of this issue) or the March 2015 Survey report. This material requires enhancement and consolidation.
  • The March 2015 Report apparently commits to more intensive scrutiny of curricular and IAG provision in Section 5 inspections, as well as ‘continued focus’ on able and disadvantaged students (see below). A subsequent commitment to an evaluation toolkit would be helpful to inspectors as well as schools, but its structure and content has not yet been revealed.

Key findings: Survey

  • The sample for my survey is broadly representative of regions, school status and variations in NOR. In terms of overall inspection grades, 10% are outstanding, 31% good, 37% require improvement and 22% are inadequate. In terms of sub-grades, they are notably weaker on Quality of teaching and Achievement of pupils, the two sections that most typically feature material about the most able.
  • There is huge variation within the sample by percentage of high attainers (2014 GCSE population according to the Secondary Performance Tables measure). The range is from 3% to 52%. The average is 32%, very slightly under the 32.3% average for all state-funded schools. Comparing overall inspection grade with percentage of high attainers suggests a marked difference between those rated outstanding/good (average 32/33%) and those rated as requiring improvement/inadequate (average 23%).
  • 45% of the reports in the sample addressed the most able under Key findings; 38% did so under Areas for improvement and 28% made reference in both sections. However, 45% made no reference in either of these sections. In 2014, 34% mentioned the most able in both main findings and recommendations, while 52% mentioned it in neither. On this measure, inspectors’ focus on the most able has not increased substantively since last year.
  • Community and foundation schools were rather more likely to attract such comments than either converter or sponsored academies. Voluntary schools were least likely to attract them. The lower the overall inspection grade, the more likely a school is to receive such comments.
  • In Key findings, negative comments outnumbered positive comments by a ratio of 3:1. Schools with high percentages of high attainers were well represented amongst those receiving positive comments.
  • Unsurprisingly, schools rated inadequate overall were much more likely to attract negative comments. A correlation between overall quality and quality of provision for the most able was somewhat more apparent than in 2014. There was also some evidence to suggest a correlation between negative comments and a low proportion of high attainers.
  • On the other hand, over half of schools with an overall requiring improvement grade and a third with an overall inspection grade of inadequate did not attract comments about the most able under Key findings. This is not indicative of greater emphasis.
  • The menu of shortcomings is confined to seven principal faults: underachievement (especially too few high GCSE grades), insufficient progress, low expectations, insufficiently challenging work, poor teaching quality, poor planning and poor use of assessment information. In most cases practice is inconsistent but occasionally problems are school-wide.
  • Areas for improvement are almost always expressed in formulaic fashion. Those relating to the most able focus almost invariably on the Quality of teaching. The improvement most commonly urged is more thorough application of assessment information to planning and teaching.
  • Only 15% of reports mention the most able under Leadership and management and, of those, only two are negative comments. The role of governors was not raised once. Too often the school leadership escapes censure for shortcomings identified elsewhere in the report. This is not consistent with indications of new-found emphasis in this territory.
  • The most able are hardly ever mentioned in the Behaviour and safety section of reports. It would seem that bullying is invisible and low level disruption by bored high attainers rare.
  • Conversely, 68% of reports referenced the most able under Quality of teaching. Although negative comments are much more likely in schools judged as inadequate or requiring improvement in this area, a few appear to be succeeding with their most able against the odds. The main text identifies a list of twelve good practice points gleaned from the sample.
  • Only one report fails to mention the most able under Achievement of pupils, but the quality and coverage varies enormously. Some comments are entirely generic; some focus on achievement, others on progress and some on both. Few venture beyond the core subjects. There is very little quantification, especially of insufficient progress (and especially compared with equivalent discussion of progress by disadvantaged learners).
  • Relatively few reports deploy the term ‘most able’ when discussing sixth form provision. Progression to higher education is sometimes mentioned and sometimes not. There is no consensus on how to refer to selective higher education.
  • Only one report in this sample mentions disadvantaged most able students. Two reports betray the tendency of assuming these two groups to be mutually exclusive but, worse still, the sin of omission is almost universal. This provides no support whatsoever for Ofsted’s claim that inspectors already address the issue.

Areas for improvement

Ofsted has made only limited improvements since the previous inspection in May 2014 and its more recent commitments are not yet reflected in Section 5 inspection practice.

In order to pass muster it should:

  • Appoint a lead inspector for the most able who will assume responsibility across Ofsted, including communication and consultation with third parties.
  • Consolidate and clarify material about the most able in the new Inspection Handbooks and supporting guidance for inspectors.
  • Prepare and publish a high quality evaluation toolkit, to support schools and inspectors alike. This should address definitional and terminological issues as well as supplying benchmarking data for achievement and progress. It might also set out the core principles underpinning effective practice.
  • Include within the toolkit a self-assessment and evaluation framework based on the quality standards. This should model Ofsted’s understanding of whole school provision for the most able that aligns with outstanding, good and requiring improvement grades, so that schools can understand the progression between these points.
  • Incorporate data about the incidence of the most able and their performance in the Data Dashboard.
  • Extend all elements of this work programme to the primary and post-16 sectors.
  • Undertake this work programme in consultation with external practitioners and experts in the field, completing it as soon as possible and by December 2015 at the latest.

 .

Verdict: (Still) Requires Improvement.

GP

April 2015

.. 

.

Annex: Coverage in the School Inspection Handbook (December 2014)

Main Text

Inspectors should:

  • Gather evidence about how well they are ‘learning, gaining knowledge and understanding, and making progress’ (para 40)
  • Take account of them when considering performance data (para 59)
  • Take advantage of opportunities to gather evidence from them (para 68)
  • Consider the effectiveness of pupil grouping, for example ‘where pupils are taught in mixed ability groups/classes, inspectors will consider whether the most able are stretched…’ (para 153)
  • Explore ‘how well the school works with families to support them in overcoming the cultural obstacles that often stand in the way of the most able pupils from deprived backgrounds attending university’ (para 154)
  • Consider whether ‘teachers set homework in line with the school’s policy and that challenges all pupils, especially the most able’ (para 180)
  • Consider ‘whether work in Key Stage 3 is demanding enough, especially for the most able when too often undemanding work is repeated unnecessarily’ (para 180)
  • Consider whether ‘teaching helps to develop a culture and ethos of scholastic excellence, where the highest achievement in academic work is recognised, especially in supporting the achievement of the most able’ (para 180)
  • When judging achievement, have regard for ‘the progress that the most able are making towards attaining the highest grades’ and ‘pay particular attention to whether more able pupils in general and the most able pupils in particular are achieving as well as they should’. They must ‘summarise the achievements of the most able pupils in a separate paragraph of the inspection report’ (paras 185-7)
  • Consider ‘how the school uses assessment information to identify pupils who…need additional support to reach their full potential, including the most able.’ (para 193)
  • Consider how well ‘assessment, including test results, targets, performance descriptors or expected standards are used to ensure that…more able pupils do work that deepens their knowledge and understanding’ and ‘pupils’ strengths and misconceptions are identified and acted on by teachers during lessons and more widely to… deepen the knowledge and understanding of the most able’ (para 194)
  • Take account of ‘the learning and progress across year groups of different groups of pupils currently on the roll of the school, including…the most able’. Evidence gathered should include ‘the school’s own records of pupils’ progress, including… the most able pupils such as those who joined secondary schools having attained highly in Key Stage 2’ (para 195)
  • Take account of ‘pupils’ progress in the last three years, where such data exist and are applicable, including that of…the most able’ (para 195)
  • ‘When inspecting and reporting on students’ achievement in the sixth form, inspectors must take into account all other guidance on judging the achievement, behaviour and development of students, including specific groups such as…the most able ‘ (para 210)
  • Talk to sixth form students to discover ‘how well individual study programmes meet their expectations, needs and future plans, including for…the most able’ (para 212)

However, the terminology is not always consistent. in assessing the overall effectiveness of a school, inspectors must judge its response to ‘the achievement of…the highest and lowest attainers’ (para 129)

Grade descriptors

Outstanding

  • Overall effectiveness:

‘The school’s practice consistently reflects the highest expectations of staff and the highest aspirations for pupils, including the most able…’

  • Quality of teaching:

‘Much teaching over time in all key stages and most subjects is outstanding and never less than consistently good. As a result, almost all pupils currently on roll in the school, including…the most able, are making sustained progress that leads to outstanding achievement.’

  • Achievement of pupils:

‘The learning of groups of pupils, particularly… the most able, is consistently good or better.’

  • Effectiveness of sixth form provision:

‘All groups of pupils make outstanding progress, including…the most able’

Good

  • Overall effectiveness:

‘The school takes effective action to enable most pupils, including the most able…’

  • Quality of teaching:

‘Teaching over time in most subjects, including English and mathematics, is consistently good. As a result, most pupils and groups of pupils on roll in the school, including…the most able, make good progress and achieve well over time.’

‘Effective teaching strategies, including setting appropriate homework and well-targeted support and intervention, are matched closely to most pupils’ needs, including those most and least able, so that pupils learn well in lessons’

  • Achievement of pupils:

‘The learning of groups of pupils, particularly… the most able, is generally good.’

  • Effectiveness of sixth form provision:

‘As a result of teaching that is consistently good over time, students make good progress, including…the most able’

Inadequate

  • Quality of teaching:

‘As a result of weak teaching over time, pupils or particular groups of pupils, including…the most able, are making inadequate progress.’

  • Achievement of pupils:

‘Groups of pupils, particularly disabled pupils and/or those who have special educational needs and/or disadvantaged pupils and/or the most able, are underachieving’

  • Effectiveness of sixth form provision:

‘Students or specific groups such as… the most able do not achieve as well as they can. Low attainment of any group shows little sign of rising.’

The most able students: Has Ofsted made progress?

.

This post considers Ofsted’s survey report ‘The most able students: An update on progress since June 2013’ published on 4 March 2015.

It is organised into the following sections:

  • The fit with earlier analysis
  • Reaction to the Report
  • Definitions and the consequent size of Ofsted’s ‘most able’ population
  • Evidence base – performance data and associated key findings
  • Evidence base – inspection and survey evidence and associated key findings
  • Ofsted’s recommendations and overall assessment
  • Prospects for success

How this fits with earlier work

The new Report assesses progress since Ofsted’s previous foray into this territory some 21 months ago: ‘The most able students: Are they doing as well as they should in our non-selective secondary schools?’ (June 2013)

The autopsy I performed on the original report was severely critical.

It concluded:

‘My overall impression is of a curate’s egg, whose better parts have been largely overlooked because of the opprobrium heaped on the bad bits.

The Report might have had a better reception had the data analysis been stronger, had the most significant messages been given comparatively greater prominence and had the tone been somewhat more emollient towards the professionals it addresses, with some sort of undertaking to underwrite support – as well as challenge – from the centre.’

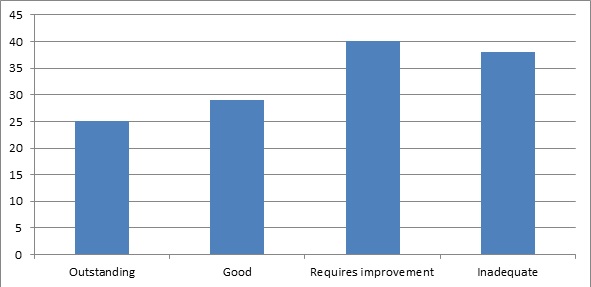
In May 2014, almost exactly mid-way between that Report and this, I published an analysis of the quality of Ofsted reporting on support for the most able in a sample of Section 5 secondary school inspection reports.

This uncovered a patchy picture which I characterised as ‘requiring improvement’.

It noted the scant attention given by inspectors to high-attaining disadvantaged learners and called for Ofsted to publish guidance to clarify, for inspectors and schools alike, what they mean by the most able and their expectations of what support schools should provide.

In December 2014, I published ‘HMCI ups the ante on the most able’ which drew attention to commitments in HMCI’s Annual Report for 2013/14 and the supporting documentation released alongside it.

I concluded that post with a series of ten recommendations for further action by Ofsted and other central government bodies that would radically improve the chances of achieving system-wide improvement in this territory.

The new Report was immediately preceded by a Labour commitment to introduce a £15m Gifted and Talented Fund if successful in the forthcoming General Election.

This short commentary discusses that and sets out the wider political context into which Ofsted’s new offering will fall.

.

Reactions to Ofsted’s Report

Before considering the Report’s content, it may be helpful to complete this context-setting by charting immediate reactions to it.

  • DfE’s ‘line to take, as quoted by the Mail, is:

‘We know that the best schools do stretch their pupils. They are the ones with a no-excuses culture that inspires every student to do their best.

Our plan for education is designed to shine a bright light on schools which are coasting, or letting the best and brightest fall by the wayside.

That is why we are replacing the discredited system which rewarded schools where the largest numbers of pupils scraped a C grade at GCSE.

Instead we are moving to a new system which encourages high-achievers to get the highest grades possible while also recognising schools which push those who find exams harder.’

‘David Cameron’s government has no strategy for supporting schools to nurture their most able pupils. International research shows we perform badly in helping the most gifted pupils. We’re going to do something about that. Labour will establish a Gifted and Talented Fund to equip schools with the most effective strategies for stretching their most able pupils.’

  • ASCL complains that the Report ‘fails to recognise that school leaders have done an extraordinary job in difficult circumstances in raising standards and delivering a good education for all children’. It is also annoyed because Ofsted’s press release:

‘…should have focused on the significant amount of good practice identified in the report rather than leading with comments that some schools are not doing enough to ensure the most able children fulfil their potential.’

 .

 .

  • NAHT makes a similarly generic point about volatility and change:

‘The secondary sector has been subject to massive structural change over the past few years. It’s neither sensible nor accurate to accuse secondary schools of failure. The system itself is getting in the way of success…

…Not all of these changes are bad. The concern is that the scale and pace of them will make it very hard indeed to know what will happen and how the changes will interact….

…The obvious answer is quite simple: slow down and plan the changes better; schedule them far enough ahead to give schools time to react….

But the profession also needs to ask what it can do. One answer is not to react so quickly to changes in league table calculations – to continue to do what is right…’

There was no official reaction from ATL, NASUWT or NUT.

Turning to the specialist organisations:

‘If the failure reported by Ofsted was about any other issue there would be a national outcry.

This cannot be an issue laid at the door of schools alone, with so many teachers working hard, and with no budget, to support these children.

But in some schools there is no focus on supporting high potential learners, little training for teachers to cope with their educational needs, and a naive belief that these children will succeed ‘no matter what’.

Ofsted has shown that this approach is nothing short of a disaster; a patchwork of different kinds of provision, a lack of ambitious expectations and a postcode lottery for parents.

We need a framework in place which clearly recognises best practice in schools, along with a greater understanding of how to support these children with high learning potential before it is too late.’

‘NACE concurs with both the findings and the need for urgent action to be taken to remove the barriers to high achievement for ALL pupils in primary and secondary schools…

… the organisation is  well aware that nationally there is a long way to go before all able children are achieving in line with their abilities.’

‘Today’s report demonstrates an urgent need for more dedicated provision for the highly able in state schools. Ofsted is right to describe the situation as ‘especially disappointing’; too many of our brightest students are being let down…

…We need to establish an effective national programme to support our highly able children particularly those from low and middle income backgrounds so that they have the stretch and breath they need to access the best universities and the best careers.’

Summing up, the Government remains convinced that its existing generic reforms will generate the desired improvements.

There is so far no response, from Conservatives or Liberal Democrats, to the challenge laid down by Labour, which has decided that some degree of arms-length intervention from the centre is justified.

The headteacher organisations are defensive because they see themselves as the fall guys, as the centre increasingly devolves responsibility through a ‘school-driven self-improving’ system that cannot yet support its own weight (and might never be able to do so, given the resource implications of building sufficient capacity).

But they cannot get beyond these generic complaints to address the specific issues that Ofsted presents. They are in denial.

The silence of the mainstream teachers’ associations is sufficient comment on the significance they attach to this issue.

The specialist lobby calls explicitly for a national framework, or even the resurrection of a national programme. All are pushing their own separate agendas over common purpose and collaborative action.

Taken together, this does not bode well for Ofsted’s chances of achieving significant traction.

Ofsted’s definitions

.

Who are the most able?

Ofsted is focused exclusively on non-selective secondary schools, and primarily on KS3, though most of the data it publishes relates to KS4 outcomes.

My analysis of the June 2013 report took umbrage at Ofsted’s previous definition of the most able:

‘For the purpose of this survey ‘most able’ is defined as the brightest students starting secondary school in Year 7 attaining Level 5 or above, or having the potential to attain Level 5 and above, in English (reading and writing) and/or mathematics at the end of Key Stage 2. Some pupils who are new to the country and are learning English as an additional language, for example, might not have attained Level 5 or beyond at the end of Key Stage 2 but have the potential to achieve it.’

On this occasion, the definition is similarly based on prior attainment at KS2, but the unquantified proportion of learners with ‘the potential to attain Level 5 or above’ are removed, meaning that Ofsted is now focused exclusively on high attainers:

‘For this report, ‘most able’ refers to students starting secondary school in Year 7 having attained Level 5 or above in English (reading and writing) and/or mathematics at the end of Key Stage 2.’

This reinforces the unsuitability of the term ‘most able’, on the grounds that attainment, not ability, is the true focus.

Ofsted adds for good measure:

‘There is currently no national definition for most able’

They fail to point out that the Performance Tables include a subtly different definition of high attainers, essentially requiring an APS of 30 points or higher across Key Stage 2 tests in the core subjects.

The 2014 Secondary Performance Tables show that this high attainer population constitutes 32.3% of the 2014 GCSE cohort in state-funded schools.

The associated SFR indicates that high attainers account for 30.9% of the cohort in comprehensive schools (compared with 88.8% in selective schools).

But Ofsted’s definition is wider still. The SFR published alongside the 2014 Primary Performance Tables reveals that, in 2014:

  • 29% of pupils achieved Level 5 or above in KS2 reading and writing
  • 44% of pupils achieved Level 5 or above in KS2 Maths and
  • 24% of pupils achieved Level 5 or above in KS2 reading, writing and maths.

If this information is fed into a Venn diagram, it becomes evident that, this academic year, the ‘most able’ constitute 49% of the Year 7 cohort.

That’s right – almost exactly half of this year’s Year 7s fall within Ofsted’s definition.

.

Ofsted venn Capture

.

The population is not quite so large if we focus instead on KS2 data from 2009, when the 2014 GCSE cohort typically took their KS2 tests, but even that gives a combined total of 39%.

We can conclude that Ofsted’s ‘most able’ population is approximately 40% of the KS4 cohort and approaching 50% of the KS3 cohort.

This again calls into question Ofsted’s terminology, since the ‘most’ in ‘most able’ gives the impression that they are focused on a much smaller population at the top of the attainment distribution.

We can check the KS4 figure against numerical data provided in the Report, to demonstrate that it applies equally to non-selective schools, ie once selective schools have been removed from the equation.

The charts in Annex A of the Report give the total number of pupils in non-selective schools with L5 outcomes from their KS2 assessments five years before they take GCSEs:

  • L5 maths and English = 91,944
  • L5 maths = 165,340
  • L5 English (reading and writing) = 138,789

Assuming there is no double-counting, this gives us a total population of 212,185 in 2009.

I could not find a reliable figure for the number of KS2 test takers in 2009 in state-funded primary schools, but the equivalent in the 2011 Primary Performance Tables is 547,025.

Using that, one can calculate that those within Ofsted’s definition constitute some 39% of the 2014 GCSE cohort in non-selective secondary schools. The calculations above suggest that the KS3 cohort will be some ten percentage points larger.

.

Distribution between schools

Of course the distribution of these students between schools will vary considerably.

The 2014 Secondary Performance Tables illustrate this graphically through their alternative ‘high attainers’ measure. The cohort information provides the percentage of high attainers in the GCSE cohort in each school.

The highest recorded percentage in a state-funded comprehensive school is 86%, whereas 92 state-funded schools record 10% or fewer high attainers and just over 650 have 20% or fewer in their GCSE cohort.

At the other extreme, 21 non-selective state-funded schools are at 61% or higher, 102 at 51% or higher and 461 at 41% or higher.

However, the substantial majority – about 1,740 state-funded, non-selective schools – fall between 21% and 40%.

The distribution is shown in the graph below.

.

Ofsted graph 1

Percentage of high attainers within each state-funded non-selective secondary school’s cohort 2014 (Performance Tables measure)

Ofsted approaches the issue differently, by looking at the incidence of pupils with KS2 L5 in English, maths and both English and maths.

Their tables (again in Annex A of the Report) show that, within the 2014 GCSE cohort there were:

  • 2,869 non-selective schools where at least one pupil previously attained a L5 in KS2 English
  • 2,875 non-selective schools where at least one pupil previously attained a L5 in KS2 maths and
  • 2,859 non-selective schools where at least one pupil previously attained l5 in KS2 English and maths.

According to the cohort data in the 2014 Secondary Performance Tables, this suggests that roughly 9% of state-funded non-selective secondary schools had no pupils in each of these categories within the relevant cohort. (It is of course a different 9% in each case.)

Ofsted’s analysis shows that the lowest decile of schools in the distribution of students with L5 in English will have up to 14 of them.

Similarly the lowest decile for L5 in maths will have up to 18 pupils, and the lowest decile for L5 in maths and English combined will have up to 10 pupils.

Assuming a top set typically contains at least 26 pupils, 50% of state-funded, non-selective schools with at least one pupil with L5 English have insufficient students for one full set. The comparable percentage for maths is 30%.

But Ofsted gives no hint of what might constitute a critical mass of high attainers, appearing to suggest that it is simply a case of ‘the more the better’.

Moreover, it seems likely that Ofsted might simply be identifying the incidence of disadvantage through the proxy of high attainers.

This is certainly true at the extremes of the distribution based on the Performance Tables measure.

  • Amongst the 92 schools with 10% or fewer high attainers, 53 (58%) have a cohort containing 41% or more disadvantaged students.
  • By comparison, amongst the 102 schools with 51% or more high attainers, not one school has such a high proportion of disadvantaged students, indeed, 57% have 10% or fewer.

Disadvantage

When Ofsted discusses the most able from disadvantaged backgrounds, its definition of disadvantage is confined to ‘Ever-6 FSM’.

The Report does not provide breakdowns showing the size of this disadvantaged population in state-funded non-selective schools with L5 English or L5 maths.

It does tell us that 12,150 disadvantaged students in the 2014 GCSE cohort had achieved KS2 L5 in both English and maths.  They form about 13.2% of the total cohort achieving this outcome.

If we assume that the same percentage applies to the total populations achieving L5 English only and L5 maths only, this suggests the total size of Ofsted’s disadvantaged most able population within the 2014 GCSE cohort in state-funded, non-selective schools is almost exactly 28,000 students.

Strangely, the Report does not analyse the distribution of disadvantaged high attainers, as opposed to high attainers more generally, even though the text mentions this as an issue in passing.

One would expect that the so called ‘minority effect’ might be even more pronounced in schools where there are very few disadvantaged high attainers.

Ofsted’s evidence base: Performance data

The Executive Summary argues that analysis of national performance data reveals:

‘…three key areas of underperformance for the most able students. These are the difference in outcomes between:

  • schools where most able students make up a very small proportion of the school’s population and those schools where proportions are higher
  • the disadvantaged most able students and their better off peers
  • the most able girls and the most able boys.

If the performance of the most able students is to be maximised, these differences need to be overcome.’

As noted above, Ofsted does not separately consider schools where the incidence of disadvantaged most able students is low, nor does it look at the interaction between these three categories.

It considers all three areas of underperformance through the single prism of prior attainment in KS2 tests of English and maths.

The Report also comments on a fourth dimension: the progression of disadvantaged students to competitive universities. Once again this is related to KS2 performance.

There are three data-related Key Findings:

  • National data show that too many of the most able students are still being let down and are failing to reach their full potential. Most able students’ achievement appears to suffer even more when they are from disadvantaged backgrounds or when they attend a school where the proportion of previously high-attaining students is small.’
  • ‘Nationally, too many of our most able students fail to achieve the grades they need to get into top universities. There are still schools where not a single most able student achieves the A-level grades commonly preferred by top universities.’
  • The Department for Education has developed useful data about students’ destinations when they leave Key Stage 4. However, information about students’ destinations when they leave Key Stage 5 is not as comprehensive and so is less useful.’

The following sections look at achievement compared with prior attainment, followed by each of the four dimensions highlighted above.

GCSE attainment compared with KS2 prior attainment

Ofsted’s approach is modelled on the transition matrices, as applied to non-selective schools, comparing KS2 test performance in 2009 with subsequent GCSE performance in 2014.

Students with KS2 L5 are expected to make at least three levels of progress, to GCSE Grade B or higher, but this is relatively undemanding for high attainers, who should ideally be aiming for A/A* grades.

Ofsted presents two charts which illustrate the relatively small proportions who are successful in these terms – and the comparatively large proportions who undershoot even a grade B.

Ofsted Capture 1

Ofsted Capture 2

 .

  • In English, 39% manage A*/A grades while 77% achieve at least a Grade B, meaning that 23% achieve C or below.
  • In maths, 42% achieve A*/A grades, 76% at least a B and so 24% achieve C or lower.
  • In English and maths combined, 32% achieve A*/A grades in both subjects, 73% manage at least 2 B grades, while 27% fall below this.

Approximately one in four high attainers is not achieving each of these progression targets, even though they are not particularly demanding.

The Report notes that, in selective schools, the proportion of Level 5 students not achieving at least a Grade B is much lower, at 8% in English and 6% in maths.

Even allowing for the unreliability of these ‘levels of progress’ assumptions, the comparison between selective and non-selective schools is telling.

.

The size of a school’s most able population

The Report sets out evidence to support the contention that ‘the most able do best when there are more of them in a school’ (or, more accurately, in their year group).

It provides three graphs – for English, for maths and for maths and English combined – which divide non-selective schools with at least one L5 student into deciles according to the size of that L5 population.

These show consistent increases in the proportion of students achieving GCSE Grade B and above and Grades A*/A, with the lowest percentages for the lowest deciles and vice versa.

Comparing the bottom (fewest L5) and top (most L5) deciles:

  • In English 27% of the lowest decile achieved A*/A and 67% at least a B, whereas in the highest decile 48% achieved A*/A and 83% at least B.
  • In maths 28% of the bottom decile recorded A*/A while 65% managed at least a B, whereas in the top decile 54% achieved A*/A and 83% at least a B.
  • In maths and English combined, the lowest decile schools returned 17% A*/A grades and 58% at B or above, while in the highest decile the percentages were 42% and 81% respectively.

Selective schools record higher percentages than the highest decile on all three measures.

There is a single reference to the impact of sublevels, amply evidenced by the transition matrices.

‘For example, in schools where the lowest proportions of most able students had previously gained Level 5A in mathematics, 63% made more than expected progress. In contrast, in schools where the highest proportion of most able students who had previously attained Level 5A in mathematics, 86% made more than expected progress.’

Ofsted does not draw any inferences from this finding.

As hinted above, one might want to test the hypothesis that there may be an association with setting – in that schools with sufficient Level 5 students to constitute a top set might be relatively more successful.

Pursued to its logical extreme the finding would suggest that Level 5 students will be most successful where they are all taught together.

Interestingly, my own analysis of schools with small high attainer populations (10% or less of the cohort), derived from the 2014 Secondary Performance Tables, shows just how much variation there can be in the performance of these small groups when it comes to the standard measures:

  • 5+ A*-C grades including English and maths varies from 44% to 100%
  • EBacc ranges from 0% to 89%
  • Expected progress in English varies between 22% and 100% and expected progress in maths between 27% and 100%.

This is partly a function of the small sample sizes. One suspects that Ofsted’s deciles smooth over similar variations.

But the most obvious point is that already emphasised in the previous section – the distribution of high attainers seems in large part a proxy for the level of advantage in a school.

Viewed from this perspective, Ofsted’s data on the variation in performance by distribution of high attaining students seems unsurprising.

.

Excellence gaps

Ofsted cites an ‘ever 6’ gap of 13 percentage points at GCSE grade B and above in English (66% compared with 79%) and of 17 percentage points in maths (61% compared with 78%).

Reverting again to progression from KS2, the gap between L5 ‘ever 6 FSM’ and other students going on to achieve A*/A grades in both English and maths is also given as 17 percentage points (20% versus 37%). At Grade B and above the gap is 16 points (59% compared with 75%).

A table is supplied showing progression by sub-level in English and maths separately.

.

Ofsted Capture 3

. 

A footnote explains that the ‘ever 6 FSM’ population with L5a in English was small, consisting of just 136 students.

I have transferred these excellence gaps to the graph below, to illustrate the relationship more clearly.

.

Ofsted chart 2

GCSE attainment gaps between advantaged and disadvantaged learners by KS2 prior attainment

.

It shows that, for grades A*-B, the size of the gap reduces the higher the KS2 sub-level, but the reverse is true at grades A*/A, at least as far as the distinction between 5c and 5b/a is concerned. The gaps remain similar or identical for progression from the higher two sub-levels.

This might suggest that schools are too little focused on pushing high-attaining disadvantaged learners beyond grade B.

 .

Gender

There is a short section on gender differences which points out that, for students with KS2 L5:

  • In English there was a 10 percentage point gap in favour of girls at Grade B and above and an 11 point gap in favour of girls at A*/A.
  • In maths there was a five percentage point gap at both Grade B and above and Grade A*/A.

But the interrelationship with excellence gaps and the size of the high attainer population is not explored.

.

Progression to competitive higher education

The Executive Summary mentions one outcome from the 2012/13 destinations data – that only 5% of disadvantaged students completing KS5 in 2012 progressed to ‘the top universities’. (The main text also compares the progression rates for state-funded and independent schools).

It acknowledges some improvement compared with previous years, but notes the disparity with progression rates for students from comparatively advantaged backgrounds.

A subsequent footnote reveals that Ofsted is referring throughout to progression to Russell Group universities

The Executive Summary also highlights regional differences:

‘For example, even within a high-achieving region like London, disadvantaged students in Brent are almost four times as likely to attend a prestigious university as those in Croydon.’

The main text adds:

‘For example, of the 500 or so disadvantaged students in Kent, only 2% go on to attend a top university. In Manchester, this rises to 9%. Disadvantaged students in Barnet are almost four times as likely as their peers in Kent to attend a prestigious university.’

Annex A provides only one statistic concerning progression from KS2 to KS5:

‘One half of students achieving Level 5 in English and mathematics at Key Stage 2 failed to achieve any A or A* grades at A level in non-selective schools’

There is no attempt to relate this data to the other variables discussed above.

Ofsted’s Evidence base – inspection and survey evidence

The qualitative evidence in Ofsted’s report is derived from:

  • A survey of 40 non-selective secondary schools and 10 primary schools. All the secondary schools had at least 15% of students ‘considered to be high attaining at the end of Key Stage 2’ (as opposed to meeting Ofsted’s definition), as well as 10% or more considered to be low-attaining. The sample varied according to size, type and urban or rural location. Fifteen of the 40 were included in the survey underpinning the original 2013 report. Nine of the 10 primary schools were feeders for the secondaries in the sample. In the secondary schools, inspectors held discussions with senior leaders, as well as those responsible for transition and IAG (so not apparently those with lead responsibility for high attainers). They also interviewed students in KS3 and KS5 and looked at samples of students’ work.

The six survey questions are shown below

.

Ofsted Capture 4

.

  • Supplementary questions asked during 130 Section 5 inspections, focused on how well the most able students are maintaining their progress in KS3, plus challenge and availability of suitable IAG for those in Year 11.
  • An online survey of 600 Year 8 and Year 11 students from 17 unidentified secondary schools, plus telephone interviews with five Russell Group admissions tutors.

The Report divides the qualitative dimension of its report into seven sections that map broadly on to the six survey questions.

The summary below is organised thematically, pulling together material from the key findings and supporting commentary. Relevant key findings are emboldened. Some of these have relevance to sections other than that in which they are located.

The length of each section is a good guide to the distribution and relative weight of Ofsted’s qualitative evidence

Most able disadvantaged

‘Schools visited were rarely meeting the distinct needs of students who are most able and disadvantaged. Not enough was being done to widen the experience of these students and develop their broader knowledge or social and cultural awareness early on in Key Stage 3. The gap at Key Stage 4 between the progress made by the most able disadvantaged students and their better off peers is still too large and is not closing quickly enough.’

The 2013 Report found few instances of pupil premium being used effectively to support the most able disadvantaged. This time round, about a third of survey schools were doing so. Six schools used the premium effectively to raise attainment.

Funding was more often used for enrichment activities but these were much less common in KS3, where not enough was being done to broaden students’ experience or develop social and cultural awareness.

In less successful schools, funding was not targeted ‘with the most able students in mind’, nor was its impact evaluated with sufficient precision.

In most survey schools, the proportion of most able disadvantaged was small. Consequently leaders did not always consider them.

In the few examples of effective practice, schools provided personalised support plans.

.

.

Leadership

Ofsted complains of complacency. Leaders are satisfied with their most able students making the expected progress – their expectations are not high enough.

School leaders in survey schools:

‘…did not see the need to do anything differently for the most able as a specific group.’

One head commented that specific support would be ‘a bit elitiist’.

In almost half of survey schools, heads were not prioritising the needs of their most able students at a sufficiently early stage.

Just 44 of the 130 schools asked supplementary questions had a senior leader with designated responsibility for the most able. Of these, only 16 also had a designated governor.

The Report comments:

‘This suggests that the performance of the most able students was not a high priority…’

Curriculum

Too often, the curriculum did not ensure that work was hard enough for the most able students in Key Stage 3. Inspectors found that there were too many times when students repeated learning they had already mastered or did work that was too easy, particularly in foundation subjects.’

Although leaders have generally made positive curriculum changes at KS4 and 5, issues remain at KS3. General consensus amongst students in over half the survey schools was that work is too easy.

Students identified maths and English as more challenging than other subjects in about a third of survey schools.

In the 130 schools asked supplementary questions, leaders rarely prioritised the needs of the most able at KS3. Only seven offered a curriculum designed for different abilities.

In the most effective survey schools the KS3 curriculum was carefully structured:

‘…leaders knew that, for the most able, knowledge and understanding of content was vitally important alongside the development of resilience and knowing how to conduct their own research.’

By comparison, the KS4 curriculum was tailored in almost half of survey schools. All the schools introduced enrichment and extra-curricular opportunities, though few were effectively evaluated.

. 

Assessment and tracking

Assessment, performance tracking and target setting for the most able students in Key Stage 4 were generally good, but were not effective enough in Key Stage 3. The schools visited routinely tracked the progress of their older most able students, but this remained weak for younger students. Often, targets set for the most able students were too low, which reflected the low ambitions for these students. Targets did not consistently reflect how quickly the most able students can make progress.’

Heads and assessment leaders considered tracking the progress of the most able sufficient to address their performance, but only rarely was this information used to improve curriculum and teaching strategies.

Monitoring and evaluation tends to be focused on KS4. There were some improvements in tracking at KS4 and KS5, but this had caused many schools to lose focus on tracking from the start of KS3.

KS3 students in most survey schools said their views were sought, but could not always point to changes as a consequence. Only in eight schools were able students’ views sought as a cohort.

Year 8 respondents to the online survey typically said schools could do more to develop their interests.

At KS3, half the survey schools did not track progress in all subjects. Where tracking was comprehensive, progress was inconsistent, especially in foundation subjects.

Assessment and tracking ‘generally lacked urgency and rigour’. This, when combined with ineffective use of KS2 assessments:

‘… has led to an indifferent start to secondary school for many of the most able students in these schools.’

KS2 tests were almost always used to set targets but five schools distrusted these results. Baseline testing was widely used, but only about a quarter of the sample used it effectively to spot gaps in learning or under-achievement.

Twenty-six of the 40 survey schools set targets ‘at just above national expectations’. For many students these were insufficiently demanding.

Expectations were insufficiently high to enable them to reach their potential. Weaknesses at KS3 meant there was too much to catch up at KS4 and 5.

In the better examples:

‘…leaders looked critically at national expectations and made shrewd adjustments so that the most able were aiming for the gold standard of A and A* at GCSE and A levels rather than grade B. They ensured that teachers were clear about expectations and students knew exactly what was expected of them. Leaders in these schools tracked the progress of their most able students closely. Teachers were quickly aware of any dips in performance and alert to opportunities to stretch them.’

The expectations built into levels-based national curriculum assessment imposed ‘a glass ceiling’. It is hoped that reforms such as Progress 8 will help raise schools’ aspirations.

 .

Quality of teaching

‘In some schools, teaching for the most able lacked sufficient challenge in Key Stage 3. Teachers did not have high enough expectations and so students made an indifferent start to their secondary education. The quality of students’ work across different subjects was patchy, particularly in foundation subjects. The homework given to the most able was variable in how well it stretched them and school leaders did not routinely check its effectiveness.’

The most common methods of introducing ‘stretch’ reported by teachers and students were extension work, challenge questions and differentiated tasks.

But in only eight of the survey schools did teachers have specific training in applying these techniques to the most able.

As in 2013, teaching at KS3 was insufficiently focused on the most able. The quality of work and tasks set was patchy, especially in foundation subjects. In two-thirds of survey schools work was insufficiently challenging in foundation subjects; in just under half, work was insufficiently challenging in maths and English.

Students experienced a range of teaching quality, even in the same school. Most said there were lessons that did not challenge them. Older students were more content with the quality of stretch and challenge.

In only about one fifth of survey schools was homework adapted to the needs of the most able. Extension tasks were increasingly common.

The same was true of half of the 130 schools asked supplementary questions.  Only 14 had a policy of setting more challenging homework for the most able.

Most schools placed students in maths and science sets fairly early in Year 7, but did so less frequently in English.

In many cases, older students were taught successfully in mixed ability classes, often because there were too few students to make sets viable:

‘The fact that these schools were delivering mixed ability classes successfully suggests that the organisation of classes by ability is not the only factor affecting the quality of teaching. Other factors, such as teachers not teaching their main subject or sharing classes or leaders focusing the skills of their best teachers disproportionately on the upper key stages, are also influential.’

. 

School culture and ethos

Leaders had not embedded an ethos in which academic excellence was championed with sufficient urgency. Students’ learning in Key Stage 3 in the schools visited was too frequently disrupted by low-level disruption, particularly in mixed-ability classes. Teachers had not had enough effective training in using strategies to accelerate the progress of their most able students.’

Where leadership was effective, leaders placed strong emphasis on creating the right ethos. School leaders had not prioritised embedding a positive ethos at KS3 in 22 of the survey schools.

In half of the survey schools, the most able students said their learning was affected by low-level disruption, though teachers in three-quarters of schools maintained this was rare. Senior leaders also had a more positive view than students.

In 16 of the schools, students thought behaviour was less good in mixed ability classes and staff tended to agree.

.

Transition

‘Inspectors found that the secondary schools visited were not using transition information from primary schools effectively to get the most able off to a flying start in Key Stage 3. Leaders rarely put in place bespoke arrangements for the most able students. In just under half of the schools visited, transition arrangements were not good enough. Some leaders and teachers expressed doubt about the accuracy of Key Stage 2 results. The information that schools gathered was more sophisticated, but, in too many cases, teachers did not use it well enough to make sure students were doing work with the right level of difficulty.

Too often poor transition arrangements meant students were treading water in KS3. The absence of leadership accountability for transition appeared a factor in stifled progress at KS4 and beyond.

Transfer arrangements with primary schools were not well developed in 16 of the survey schools. Compared with 2013, schools were more likely to find out about pupils’ strengths and weaknesses, but the information was rarely used well.

Secondary schools had more frequent and extended contact with primary schools through subject specialists to identify the most able, but these links were not always used effectively. Only one school had a specific curriculum pathway for such students.

Leaders in four of the ten primary schools surveyed doubted whether secondary schools used transition information effectively.

However, transition worked well in half of the secondary schools.  Six planned the Year 7 curriculum jointly with primary teachers. Leaders had the highest expectations of their staff to ensure that the most able were working at the appropriate level of challenge.

Transition appeared more effective where schools had fewer feeder primaries. About one third of the sample had more than 30 feeder schools, which posed more difficulties, but four of these schools had effective arrangements.

Progression to HE

‘Information, advice and guidance to students about accessing the most appropriate courses and universities were not good enough. There were worrying occasions when schools did too little to encourage the most able students to apply to prestigious universities. The quality of support was too dependent on the skills of individual staff in the schools visited.

While leaders made stronger links with universities to provide disadvantaged students in Key Stages 4 and 5 with a wider range of experiences, they were not evaluating the impact sharply enough. As a result, there was often no way to measure how effectively these links were supporting students in preparing successful applications to the most appropriate courses.’

Support and guidance about university applications is ‘still fragile’ and ‘remains particularly weak’.

Students, especially those from disadvantaged backgrounds, were not getting the IAG they need. Ten survey schools gave no specific support to first generation university attendees or those eligible for the pupil premium.

Forty-nine of the 130 school asked additional questions did not prioritise the needs of such students. However, personalised mentoring was reported in 16 schools.

In four survey schools students were not encouraged to apply to the top universities.

‘The remnants of misplaced ideas about elitism appear to be stubbornly resistant to change in a very small number of schools. One admissions tutor commented: ‘There is confusion (in schools) between excellence and elitism’.

Only a third of survey schools employed dedicated staff to support university applications. Much of the good practice was heavily reliant on the skills of a few individuals. HE admissions staff agreed.

In 13 of the schools visited, students had a limited understanding of the range of opportunities available to them.

Survey schools had a sound understanding of subject requirements for different degree courses. Only about one-quarter engaged early with parents.

.

Ofsted and other Central Government action

‘Ofsted has sharpened its focus on the progress and quality of teaching of the most able students. We routinely comment on the achievement of the most able students in our inspection reports. However, more needs to be done to develop a clearer picture of how well schools use pupil premium funding for their most able students who are disadvantaged and the quality of information, advice and guidance provided for them. Ofsted needs to sharpen its practice in this area.’

The Department for Education has developed useful data about students’ destinations when they leave Key Stage 4. However, information about students’ destinations when they leave Key Stage 5 is not as comprehensive and so is less useful.’

.

Ofsted’s recommendations and conclusions

This is a somewhat better Report than its June 2013 predecessor, although it continues to fall into several of the same statistical and presentational traps.

It too is a curate’s egg.

For any student of effective provision for the most able, the broad assessment in the previous section is profoundly unsurprising, but its endorsement by Ofsted gives it added power and significance.

We should be grateful that HMCI has chosen to champion this issue when so many others are content to ignore it.

The overall message can best be summarised by juxtaposing two short statements from the Report, one expressed positively, another negatively:

  • In over half of survey schools, the most able KS3 students were progressing as well as, or better than, others. 
  • The needs of the most able were not being met effectively in the majority of survey schools.

Reading between the lines, too often, the most able students are succeeding despite their schools, rather than because of them.

What is rather more surprising – and potentially self-defeating – is Ofsted’s insistence on laying the problem almost entirely at the door of schools, and especially of headteachers.

There is most definitely a degree of complacency amongst school leaders about this issue, and Ofsted is quite right to point that out.

The determination of NAHT and ASCL to take offence at the criticism being directed towards headteachers, to use volatility and change as an excuse and to urge greater focus on the pockets of good practice is sufficient evidence of this.

But there is little by way of counterbalance. Too little attention is paid to the question whether the centre is providing the right support – and the right level of support – to facilitate system-wide improvement. It as if the ‘school-led, self-improving’ ideal is already firmly in place.

Then again, any commitment on the part of the headteachers’ associations to tackling the root causes of the problem is sadly lacking. Meanwhile, the teachers;’ associations ignored the Report completely.

Ofsted criticises this complacency and expresses concern that most of its survey schools:

‘…have been slow in taking forward Ofsted’s previous recommendations, particularly at KS3’

There is a call for renewed effort:

‘Urgent action is now required. Leaders must grasp the nettle and radically transform transition from primary school and the delivery of the Key Stage 3 curriculum. Schools must also revolutionise the quality of information, advice and guidance for their most able students.’

Ofsted’s recommendations for action are set out below. Seven are directed at school leaders, three at Ofsted and one at DfE.

Ofsted capture 5

Ofsted Capture 6

Those aimed by Ofsted towards itself are helpful in some respects.

For example, there is implicit acknowledgement that, until now, inspectors have been insufficiently focused on the most able from disadvantaged backgrounds.

Ofsted stops short of meeting my call for it to produce guidance to help schools and inspectors to understand Ofsted’s expectations.

But it is possible that it might do so. Shortly after publication of the Report, its Director for Schools made a speech confirming that: 

‘… inspectors are developing a most able evaluation toolkit for schools, aligned to that which is in place for free school meals’. 

.

.

If Ofsted is prepared to consult experts and practitioners on the content of that toolkit, rather than producing it behind closed doors, it is more likely to be successful.

There are obvious definitional issues stemming from the fact that, according to Ofsted’s current approach, the ‘most able’ population constitutes 40-50% of all learners.

While this helps to ensure relevance to every school, no matter how depressed the attainment of its intake, it also highlights the need for further differentiation of this huge population.

Some of Ofsted’s statistical indicators and benchmarking tools will need sharpening, not least to avoid the pitfalls associated with the inverse relationship between the proportion of high attainers and the proportion of disadvantaged learners.

They might usefully focus explicitly on the distribution and incidence of the disadvantaged most able.

Prospects for success

But the obvious question is why schools should be any more likely to respond this time round than in 2013?

Will the references in the Ofsted inspection handbook plus reformed assessment arrangements be sufficient to change schools’ behaviour?

Ofsted is not about to place explicit requirements on the face of the inspection framework.

We are invited to believe that Progress 8 in particular will encourage secondary schools to give due attention to the needs of high attainers.

Yet there is no commitment to the publication of a high attainers’ performance measure (comparable to the equivalent primary measure) or the gap on that measure between those from advantaged and disadvantaged backgrounds.

Data about the performance of secondary high attainers was to have been made available through the now-abandoned Data Portal – and there has been no information about what, if anything, will take its place.

And many believe that the necessary change cannot be achieved by tinkering with the accountability framework.

The specialist organisations are united in one respect: they all believe that schools – and learners themselves – need more direct support if we are to spread current pockets of effective practice throughout the system.

But different bodies have very different views about what form that support should take. Until we can:

  • Establish the framework necessary to secure universally high standards across all schools without resorting to national prescription

we – and Ofsted – are whistling in the wind.

GP

March 2015

How well is Ofsted reporting on the most able?


This post considers how Ofsted’s new emphasis on the attainment and progress of the most able learners is reflected in school inspection reports.

My analysis is based on the 87 Section 5 secondary school inspection reports published in the month of March 2014.

keep-calm-and-prepare-for-ofsted-6I shall not repeat here previous coverage of how Ofsted’s emphasis on the most able has been framed. Interested readers may wish to refer to previous posts for details:

The more specific purpose of the post is to explore how consistently Ofsted inspectors are applying their guidance and, in particular, whether there is substance for some of the concerns I expressed in these earlier posts, drawn together in the next section.

The remainder of the post provides an analysis of the sample and a qualitative review of the material about the most able (and analogous terms) included in the sample of 87 inspection reports.

It concludes with a summary of the key points, a set of associated recommendations and an overall inspection grade for inspectors’ performance to date. Here is a link to this final section for those who prefer to skip the substance of the post.


Background

Before embarking on the real substance of this argument I need to restate briefly some of the key issues raised in those earlier posts:

  • Ofsted’s definition of ‘the most able’ in its 2013 survey report is idiosyncratically broad, including around half of all learners on the basis of their KS2 outcomes.
  • The evidence base for this survey report included material suggesting that the most able students are supported well or better in only 20% of lessons – and are not making the progress of which they are capable in about 40% of schools.
  • The survey report’s recommendations included three commitments on Ofsted’s part. It would:

 o   ‘focus more closely in its inspections on the teaching and progress of the most able students, the curriculum available to them, and the information, advice and guidance provided to the most able students’;

o   ‘consider in more detail during inspection how well the pupil premium is used to support the most able students from disadvantaged backgrounds’ and

o   ‘report its inspection findings about this group of students more clearly in school inspection, sixth form and college reports.’

  • Subsequently the school inspection guidance was revised somewhat  haphazardly, resulting in the parallel use of several undefined terms (‘able pupils’, ‘most able’, ‘high attaining’, ‘highest attaining’),  the underplaying of the attainment and progress of the most able learners attracting the Pupil Premium and very limited reference to appropriate curriculum and IAG.
  • Within the inspection guidance, emphasis was placed primarily on learning and progress. I edited together the two relevant sets of level descriptors in the guidance to provide this summary for the four different inspection categories:

In outstanding schools the most able pupils’ learning is consistently good or better and they are making rapid and sustained progress.

In good schools the most able pupils’ learning is generally good, they make good progress and achieve well over time.

In schools requiring improvement the teaching of the most able pupils and their achievement are not good.

In inadequate schools the most able pupils are underachieving and making inadequate progress.

  • No published advice has been made available to inspectors on the interpretation of these amendments to the inspection guidance. In October 2013 I wrote:

‘Unfortunately, there is a real risk that the questionable clarity of the Handbook and Subsidiary Guidance will result in some inconsistency in the application of the Framework, even though the fundamental purpose of such material is surely to achieve the opposite.’

  • Analysis of a very small sample of reports for schools reporting poor results for high attainers in the school performance tables suggested inconsistency both before and after the amendments were introduced into the guidance. I commented:

‘One might expect that, unconsciously or otherwise, inspectors are less ready to single out the performance of the most able when a school is inadequate across the board, but the small sample above does not support this hypothesis. Some of the most substantive comments relate to inadequate schools.

It therefore seems more likely that the variance is attributable to the differing capacity of inspection teams to respond to the new emphases in their inspection guidance. This would support the case made in my previous post for inspectors to receive additional guidance on how they should interpret the new requirement.’

The material below considers the impact of these revisions on a more substantial sample of reports and whether this justifies some of the concerns expressed above.

It is important to add that, in January 2014, Ofsted revised its guidance document ‘Writing the report for school inspections’ to include the statement that:

Inspectors must always report in detail on the progress of the most able pupils and how effectively teaching engages them with work that is challenging enough.’ (p8)

This serves to reinforce the changes to the inspection guidance and clearly indicates that coverage of this issue – at least in these terms – is a non-negotiable: we should expect to see appropriate reference in every single section 5 report.


The Sample

The sample comprises 87 secondary schools whose Section 5 inspection reports were published by Ofsted in the month of March 2014.

The inspections were conducted between 26 November 2013 and 11 March 2014, so the inspectors will have had time to become familiar with the revised guidance.

However up to 20 of the inspections took place before Ofsted felt it necessary to emphasise that coverage of the progress and teaching of the most able is compulsory.

The sample happens to include several institutions inspected as part of wider-ranging reviews of schools in Birmingham and schools operated by the E-ACT academy chain. It also incorporates several middle-deemed secondary schools.

Chart 1 shows the regional breakdown of the sample, adopting the regions Ofsted uses to categorise reports, as opposed to its own regional structure (ie with the North East identified separately from Yorkshire and Humberside).

It contains a disproportionately large number of schools from the West Midlands while the South-West is significantly under-represented. All the remaining regions supply between 5 and 13 schools. A total of 57 local authority areas are represented.


Chart 1: Schools within the sample by region

Ofsted chart 1


Chart 2 shows the different statuses of schools within the sample. Over 40% are community schools, while almost 30% are sponsored academies. There are no academy converters but sponsored academies, free schools and studio schools together account for some 37% of the sample.


Chart 2: Schools within the sample by status

Ofsted chart 2


The vast majority of schools in the sample are 11-16 or 11-18 institutions, but four are all-through schools, five provide for learners aged 13 or 14 upwards and 10 are middle schools. There are four single sex schools.

Chart 3 shows the variation in school size. Some of the studio schools, free schools and middle schools are very small by secondary standards, while the largest secondary school in the sample has some 1,600 pupils. A significant proportion of schools have between 600 and 1,000 pupils.


Chart 3: Schools within the sample by number on roll

Ofsted chart 3

The distribution of overall inspection grades between the sample schools is illustrated by Chart 4 below. Eight of the sample were rated outstanding, 28 good, 35 as requiring improvement and 16 inadequate.

Of those rated inadequate, 12 were subject to special measures and four had serious weaknesses.


Chart 4: Schools within the sample by overall inspection grade

 Ofsted chart 4

The eight schools rated outstanding include:

  • A mixed 11-18 sponsored academy
  • A mixed 14-19 studio school
  • A mixed 11-18 free school
  • A mixed 11-16 VA comprehensive;
  • A girls’ 11-18  VA comprehensive
  • A boys’ 11-18 VA selective school
  • A girls’ 11-18 community comprehensive and
  • A mixed 11-18 community comprehensive

The sixteen schools rated inadequate include:

  • Eight mixed 11-18 sponsored academies
  • Two mixed 11-16 sponsored academies
  • An mixed all-through sponsored academy
  • A mixed 11-16 free school
  • Two mixed 11-16 community comprehensives
  • A mixed 11-18 community comprehensive and
  • A mixed 13-19 community comprehensive


Coverage of the most able in main findings and recommendations


Terminology 

Where they were mentioned, such learners were most often described as ‘most able’ but a wide range of other terminology is deployed included ‘most-able’, ‘the more able’, ‘more-able’, ‘higher attaining’, ‘high-ability’, ‘higher-ability’ and ‘able students’.

The idiosyncratic adoption of redundant hyphenation is an unresolved mystery.

It is not unusual for two or more of these terms to be used in the same report. Because there is no glossary in existence, this makes some reports rather less straightforward to interpret accurately.

It is also more difficult to compare and contrast reports. Helpful services like Watchsted’s word search facility become less useful.


Incidence of commentary in the main findings and recommendations

Thirty of the 87 inspection reports (34%) addressed the school’s most able learners explicitly (or applied a similar term) in the sections setting out the report’s main findings and the recommendations respectively.

The analysis showed that 28% of reports on academies (including studios and free schools) met this criterion, whereas 38% of reports on non-academy schools did so.

Chart 5 shows how the incidence of reference in both main findings and recommendations varies according to the overall inspection grade awarded.

One can see that this level of attention is most prevalent in schools requiring improvement, followed by those with inadequate grades. It was less common in schools rated good and less common still in outstanding schools. The gap between these two categories is perhaps smaller than expected.

The slight lead for schools requiring improvement over inadequate schools may be attributable to a view that more of the latter face more pressing priorities, or it may have something to do with the varying proportions of high attainers in such schools, or both of these factors could be in play, amongst others.


Chart 5: Most able covered in both main findings and recommendations by overall inspection rating (percentage)

Ofsted chart 5

A further eleven reports (13%) addressed the most able learners in the recommendations but not the main findings.

Only one report managed to feature the most able in the main findings but not in the recommendations and this was because the former recorded that ‘the most able students do well’.

Consequently, a total of 45 reports (52%) did not mention the most able in either the main findings or the recommendations.

This applied to some 56% of reports on academies (including free schools and studio schools) and 49% of reports on other state-funded schools.

So, according to these proxy measures, the most able in academies appear to receive comparatively less attention from inspectors than those in non-academy schools. It is not clear why. (The samples are almost certainly too small to support reliable comparison of academies and non-academies with different inspection ratings.)

Chart 6 below shows the inspection ratings for this subset of reports.


Chart 6: Most able covered in neither main findings nor recommendations by overall inspection rating (percentage)

Ofsted chart 6

Here is further evidence that the significant majority of outstanding schools are regarded as having no significant problems in respect of provision for the most able.

On the other hand, this is far from being universally true, since it is an issue for one in four of them. This ratio of 3:1 does not lend complete support to the oft-encountered truism that outstanding schools invariably provide outstandingly for the most able – and vice versa.

At the other end of the spectrum, and perhaps even more surprisingly, over 30% of inadequate schools are assumed not to have issues significant enough to warrant reference in these sections. Sometimes this may be because they are equally poor at providing for all their learners, so the most able are not separately singled out.

Chart 7 below shows differences by school size, giving the percentage of reports mentioning the most able in both main findings and recommendations and in neither.

It divides schools into three categories: small (24 schools with a NOR of 599 or lower), medium (35 schools with a NOR of 600-999) and large (28 schools with a NOR of 1000 or higher.


Chart 7: Reports mentioning the most able in main findings and recommendations by school size 

 Ofsted chart 7

It is evident that ‘neither’ exceeds ‘both’ in the case of all three categories. The percentages are not too dissimilar in the case of small and large schools, which record a very similar profile.

But there is a much more significant difference for medium-sized schools. They demonstrate a much smaller percentage of ‘both’ reports and comfortably the largest percentage of ‘neither’ reports.

This pattern – suggesting that inspectors are markedly less likely to emphasise provision for the most able in medium-sized schools – is worthy of further investigation.

It would be particularly interesting to explore further the relationship between school size, the proportion of high attainers in a school and their achievement.


Typical references in the main findings and recommendations

I could detect no obvious and consistent variations in these references by school status or size, but it was possible to detect a noticeably different emphasis between schools rated outstanding and those rated inadequate.

Where the most able featured in reports on outstanding schools, these included recommendations such as:

‘Further increase the proportion of outstanding teaching in order to raise attainment even higher, especially for the most able students.’ (11-16 VA comprehensive).

‘Ensure an even higher proportion of students, including the most able, make outstanding progress across all subjects’ (11-18 sponsored academy).

These statements suggest that such schools have made good progress in eradicating underachievement amongst the most able but still have further room for improvement.

But where the most able featured in recommendations for inadequate schools, they were typically of this nature:

‘Improve teaching so that it is consistently good or better across all subjects, but especially in mathematics, by: raising teachers’ expectations of the quality and amount of work students of all abilities can do, especially the most and least able.’  (11-16 sponsored academy).

‘Improve the quality of teaching in order to speed up the progress students make by setting tasks that are at the right level to get the best out of students, especially the most able.’ (11-18 sponsored academy).

‘Rapidly improve the quality of teaching, especially in mathematics, by ensuring that teachers: have much higher expectations of what students can achieve, especially the most able…’ (11-16 community school).

These make clear that poor and inconsistent teaching quality is causing significant underachievement at the top end (and ‘especially’ suggests that this top end underachievement is particularly pronounced compared with other sections of the attainment spectrum in such schools).

Recommendations for schools requiring improvement are akin to those for inadequate schools but typically more specific, pinpointing particular dimensions of good quality teaching that are absent, so limiting effective provision for the most able. It is as if these schools have some of the pieces in place but not yet the whole jigsaw.

By comparison, recommendations for good schools can seem rather more impressionistic and/or formulaic, focusing more generally on ‘increasing the proportion of outstanding teaching’. In such cases the assessment is less about missing elements and more about the consistent application of all of them across the school.

One gets the distinct impression that inspectors have a clearer grasp of the ‘fit’ between provision for the most able and the other three inspection outcomes, at least as far as the distinction between ‘good’ and ‘outstanding’ is concerned.

But it would be misleading to suggest that these lines of demarcation are invariably clear. The boundary between ‘good’ and ‘requires improvement’ seems comparatively distinct, but there was more evidence of overlap at the intersections between the other grades.


Coverage of the most able in the main body of reports 

References to the most able rarely turn up in the sections dealing with behaviour and safety and leadership and management. I counted no examples of the former and no more than one or two of the latter.

I could find no examples where information, advice and guidance available to the most able are separately and explicitly discussed and little specific reference to the appropriateness of the curriculum for the most able. Both are less prominent than the recommendations in the June 2013 survey report led us to expect.

Within this sample, the vast majority of reports include some description of the attainment and/or progress of the most able in the section about pupils’ achievement, while roughly half pick up the issue in relation to the quality of teaching.

The extent of the coverage of most able learners varied enormously. Some devoted a single sentence to the topic while others referred to it separately in main findings, recommendations, pupils’ achievement and quality of teaching. In a handful of cases reports seemed to give disproportionate attention to the topic.


Attainment and progress

Analyses of attainment and progress are sometimes entirely generic, as in:

‘The most able students make good progress’ (inadequate 11-18 community school).

‘The school has correctly identified a small number of the most able who could make even more progress’ (outstanding 11-16 RC VA school).

‘The most able students do not always secure the highest grades’ (11-16 community school requiring improvement).

‘The most able students make largely expected rates of progress. Not enough yet go on to attain the highest GCSE grades in all subjects.’ (Good 11-18 sponsored academy).

Sometimes such statements can be damning:

‘The most-able students in the academy are underachieving in almost every subject. This is even the case in most of those subjects where other students are doing well. It is an academy-wide issue.’ (Inadequate 11-18 sponsored academy).

These do not in my view constitute reporting ‘in detail on the progress of the most able pupils’ and so probably fall foul of Ofsted’s guidance to inspectors on writing reports.

More specific comments on attainment typically refer explicitly to the achievement of A*/A grades at GCSE and ideally to specific subjects, for example:

‘In 2013, standards in science, design and technology, religious studies, French and Spanish were also below average. Very few students achieved the highest A* and A grades.’ (Inadequate 11-18 sponsored academy)

‘Higher-ability students do particularly well in a range of subjects, including mathematics, religious education, drama, art and graphics. They do as well as other students nationally in history and geography.’ (13-18 community school  requiring improvement)

More specific comments on progress include:

‘The progress of the most able students in English is significantly better than that in other schools nationally, and above national figures in mathematics. However, the progress of this group is less secure in science and humanities.’  (Outstanding 11-18 sponsored academy)

‘In 2013, when compared to similar students nationally, more-able students made less progress than less-able students in English. In mathematics, where progress is less than in English, students of all abilities made similar progress.’ (11-18 sponsored academy requiring improvement).

Statements about progress rarely extend beyond English and maths (the first example above is exceptional) but, when attainment is the focus, some reports take a narrow view based exclusively on the core subjects, while others are far wider-ranging.

Despite the reference in Ofsted’s survey report, and subsequently the revised subsidiary guidance, to coverage of high attaining learners in receipt of the Pupil Premium, this is hardly ever addressed.

I could find only two examples amongst the 87 reports:

‘The gap between the achievement in English and mathematics of students for whom the school receives additional pupil premium funding and that of their classmates widened in 2013… During the inspection, it was clear that the performance of this group is a focus in all lessons and those of highest ability were observed to be achieving equally as well as their peers.’ (11-16 foundation school requiring improvement)

‘Students eligible for the pupil premium make less progress than others do and are consequently behind their peers by approximately one GCSE grade in English and mathematics. These gaps reduced from 2012 to 2013, although narrowing of the gaps in progress has not been consistent over time. More-able students in this group make relatively less progress.’ (11-16 sponsored academy requiring improvement)

More often than not it seems that the most able and those in receipt of the Pupil Premium are assumed to be mutually exclusive groups.


Quality of teaching 

There was little variation in the issues raised under teaching quality. Most inspectors select two or three options from a standard menu:

‘Where teaching is best, teachers provide suitably challenging materials and through highly effective questioning enable the most able students to be appropriately challenged and stretched…. Where teaching is less effective, teachers are not planning work at the right level of difficulty. Some work is too easy for the more able students in the class. (Good 11-16 community school)

 ‘In teaching observed during the inspection, the pace of learning for the most able students was too slow because the activities they were given were too easy. Although planning identified different activities for the most able students, this was often vague and not reflected in practice.  Work lacks challenge for the most able students.’ (Inadequate 11-16 community school)

‘In lessons where teaching requires improvement, teachers do not plan work at the right level to ensure that students of differing abilities build on what they already know. As a result, there is a lack of challenge in these lessons, particularly for the more able students, and the pace of learning is slow. In these lessons teachers do not have high enough expectations of what students can achieve.’ (11-18 community school requiring improvement)

‘Tasks set by teachers are sometimes too easy and repetitive for pupils, particularly the most able. In mathematics, pupils are sometimes not moved on quickly enough to new and more challenging tasks when they have mastered their current work.’ (9-13 community middle school requiring improvement)

‘Targets which are set for students are not demanding enough, and this particularly affects the progress of the most able because teachers across the year groups and subjects do not always set them work which is challenging. As a result, the most able students are not stretched in lessons and do not achieve as well as they should.’ (11-16 sponsored academy rated inadequate)

All the familiar themes are present – assessment informing planning, careful differentiation, pace and challenge, appropriate questioning, the application of subject knowledge, the quality of homework, high expectations and extending effective practice between subject departments.


Negligible coverage of the most able

Only one of the 87 reports failed to make any mention of the most able whatsoever. This is the report on North Birmingham Academy, an 11-19 mixed school requiring improvement.

This clearly does not meet the injunction to:

‘…report in detail on the progress of the most able pupils and how effectively teaching engages them with work that is challenging enough’.

It ought not to have passed through Ofsted’s quality assurance processes unscathed. The inspection was conducted in February 2014, after this guidance issued, so there is no excuse.

Several other inspections make only cursory references to the most able in the main body of the report, for example:

‘Where teaching is not so good, it was often because teachers failed to check students’ understanding or else to anticipate when to intervene to support students’ learning, especially higher attaining students in the class.’ (Good 11-18 VA comprehensive).

‘… the teachers’ judgements matched those of the examiners for a small group of more-able students who entered early for GCSE in November 2013.’ (Inadequate 11-18 sponsored academy).

‘More-able students are increasingly well catered for as part of the academy’s focus on raising levels of challenge.’ (Good 11-18 sponsored academy).

‘The most able students do not always pursue their work to the best of their capability.’ (11-16 free school requiring improvement).

These would also fall well short of the report writing guidance. At least 6% of my sample falls into this category.

Some reports note explicitly that the most able learners are not making sufficient progress, but fail to capture this in the main findings or recommendations, for example:

‘The achievement of more able students is uneven across subjects. More able students said to inspectors that they did not feel they were challenged or stretched in many of their lessons. Inspectors agreed with this view through evidence gathered in lesson observations…lessons do not fully challenge all students, especially the more able, to achieve the grades of which they are capable.’ (11-19 sponsored academy requiring improvement).

‘The 2013 results of more-able students show they made slower progress than is typical nationally, especially in mathematics.  Progress is improving this year, but they are still not always sufficiently challenged in lessons.’ (11-18 VC CofE school requiring improvement).

‘There is only a small proportion of more-able students in the academy. In 2013 they made less progress in English and mathematics than similar students nationally. Across all of their subjects, teaching is not sufficiently challenging for more-able students and they leave the academy with standards below where they should be.’ (Inadequate 11-18 sponsored academy).

‘The proportion of students achieving grades A* and A was well below average, demonstrating that the achievement of the most able also requires improvement.’  (11-18 sponsored academy requiring improvement).

Something approaching 10% of the sample fell into this category. It was not always clear why this issue was not deemed significant enough to feature amongst schools’ priorities for improvement. This state of affairs was more typical of schools requiring improvement than inadequate schools, so one could not so readily argue that the schools concerned were overwhelmed with the need to rectify more basic shortcomings.

That said, the example from an inadequate academy above may be significant. It is almost as if the small number of more able students is the reason why this shortcoming is not taken more seriously.

Inspectors must carry in their heads a somewhat subjective hierarchy of issues that schools are expected to tackle. Some inspectors appear to feature the most able at a relatively high position in this hierarchy; others push it further down the list. Some appear more flexible in the application of this hierarchy to different settings than others.


Formulaic and idiosyncratic references 

There is clear evidence of formulaic responses, especially in the recommendations for how schools can improve their practice.

Many reports adopt the strategy of recommending a series of actions featuring the most able, either in the target group:

‘Improve the quality of teaching to at least good so that students, including the most able, achieve higher standards, by ensuring that: [followed by a list of actions] (9-13 community middle school requiring improvement)

Or in the list of actions:

‘Improve the quality of teaching in order to raise the achievement of students by ensuring that teachers:…use assessment information to plan their work so that all groups of students, including those supported by the pupil premium and the most-able students, make good progress.’ (11-16 community school requiring improvement)

It was rare indeed to come across a report that referred explicitly to interesting or different practice in the school, or approached the topic in a more individualistic manner, but here are a few examples:

‘More-able pupils are catered for well and make good progress. Pupils enjoy the regular, extra challenges set for them in many lessons and, where this happens, it enhances their progress. They enjoy that extra element which often tests them and gets them thinking about their work in more depth. Most pupils are keen to explore problems which will take them to the next level or extend their skills.’  (Good 9-13 community middle school)

‘Although the vast majority of groups of students make excellent progress, the school has correctly identified a small number of the most able who could make even more progress. It has already started an impressive programme of support targeting the 50 most able students called ‘Students Targeted A grade Results’ (STAR). This programme offers individualised mentoring using high-quality teachers to give direct intervention and support. This is coupled with the involvement of local universities. The school believes this will give further aspiration to these students to do their very best and attend prestigious universities.’  (Outstanding 11-16 VA school)

I particularly liked:

‘Policies to promote equality of opportunity are ineffective because of the underachievement of several groups of students, including those eligible for the pupil premium and the more-able students.’ (Inadequate 11-18 academy) 


Conclusion


Main Findings

The principal findings from this survey, admittedly based on a rather small and not entirely representative sample, are that:

  • Inspectors are terminologically challenged in addressing this issue, because there are too many synonyms or near-synonyms in use.
  • Approximately one-third of inspection reports address provision for the most able in both main findings and recommendations. This is less common in academies than in community, controlled and aided schools. It is most prevalent in schools with an overall ‘requires improvement’ rating, followed by those rated inadequate. It is least prevalent in outstanding schools, although one in four outstanding schools is dealt with in this way.
  • Slightly over half of inspection reports address provision for the most able in neither the main findings nor the recommendations. This is relatively more common in the academies sector and in outstanding schools. It is least prevalent in schools rated inadequate, though almost one-third of inadequate schools fall into this category. Sometimes this is the case even though provision for the most able is identified as a significant issue in the main body of the report.
  • There is an unexplained tendency for reports on medium-sized schools to be significantly less likely to feature the most able in both main findings and recommendations and significantly more likely to feature it in neither. This warrants further investigation.
  • Overall coverage of the topic varies excessively between reports. One ignored it entirely, while several provided only cursory coverage and a few covered it to excess. The scope and quality of the coverage does not necessarily correlate with the significance of the issue for the school.
  • Coverage of the attainment and progress of the most able learners is variable. Some reports offer only generic descriptions of attainment and progress combined, some are focused exclusively on attainment in the core subjects while others take a wider curricular perspective. Outside the middle school sector, desirable attainment outcomes for the most able are almost invariably defined exclusively in terms of A* and A grade GCSEs.
  • Hardly any reports consider the attainment and/or progress of the most able learners in receipt of the Pupil Premium.
  • None of these reports make specific and explicit reference to IAG for the most able. It is rarely stated whether the school’s curriculum satisfies the needs of the most able.
  • Too many reports adopt formulaic approaches, especially in the recommendations they offer the school. Too few include reference to interesting or different practice.

In my judgement, too much current inspection reporting falls short of the commitments contained in the original Ofsted survey report and of the more recent requirement to:

‘always report in detail on the progress of the most able pupils and how effectively teaching engages them with work that is challenging enough.’


Recommendations

  • Ofsted should publish a glossary defining clearly all the terms for the most able that it employs, so that both inspectors and schools understand exactly what is intended when a particular term is deployed and which learners should be in scope when the most able are discussed.
  • Ofsted should co-ordinate the development of supplementary guidance clarifying their expectations of schools in respect of provision for the most able. This should set out in more detail what expectations would apply for such provision to be rated outstanding, good, requiring improvement and inadequate respectively. This should include the most able in receipt of the Pupil Premium, the suitability of the curriculum and the provision of IAG.
  • Ofsted should provide supplementary guidance for inspectors outlining and exemplifying the full range of evidence they might interrogate concerning the attainment and progress of the most able learners, including those in receipt of the Pupil Premium.
  • This guidance should specify the essential minimum coverage expected in reports and the ‘triggers’ that would warrant it being referenced in the main findings and/or recommendations for action.
  • This guidance should discourage inspectors from adopting formulaic descriptors and recommendations and specifically encourage them to identify unusual or innovative examples of effective practice.
  • The school inspection handbook and subsidiary guidance should be amended to reflect the supplementary guidance.
  • The School Data Dashboard should be expanded to include key data highlighting the attainment and progress of the most able.
  • These actions should also be undertaken for inspection of the primary and 16-19 sectors respectively.


Overall assessment: Requires Improvement.


GP

May 2014


My Twitter Feed Summarising Key Points from Ofsted’s Report ‘The Most Able Students’

.

Here is the record of my Tweets from this morning summarising the main points from Ofsted’s newly-published Survey Report: ‘The Most Able Students’.

.

.

.

OFSTED’S KEY FINDINGS

.

.

.

OFSTED’S RECOMMENDATIONS

.

.

.

OFSTED’S COMMITMENTS

.

.

.

OVERALL ASSESSMENT

.

.

.

GOVERNMENT RESPONSE

.

.

.

OPPOSTION RESPONSE

.

.

.

POTENTIAL PLUS PRESS RELEASE

.

.

.

SUTTON TRUST PRESS RELEASE

.

.

.

WHAT THE UNIONS THINK

.