Missing Talent

.

people-308531_1280This post reviews the Sutton Trust’s Research Brief ‘Missing Talent’, setting it in the context of the Trust’s own priorities and the small canon of research on excellence gaps in the English education system.

It is structured as follows:

  • Background on what has been published and my own involvement in researching and debating these issues.
  • Analysis of the data-driven substance of the Research Brief
  • Analysis of the recommendations in the Research and their fit with previous recommendations contained in the Sutton Trust’s Mobility Manifesto (September 2014)
  • Commentary on the quality of the Research Brief, prospects for the adoption of these recommendations and comparison with my own preferred way forward.

.

Background

‘Missing Talent’ was prepared for The Sutton Trust by education datalab, an offshoot of the Fischer Family Trust (FFT).

The project was announced by education datalab in March (my emphases):

‘This is a short piece of research to explore differences in the secondary school experiences of highly able children from deprived backgrounds, compared to others. Its purpose is to identify whether and why some of the top 10% highest attaining children at the end of primary school do not achieve their full potential at age 16…

…For this group of highly able children we will:

  • describe the range of different GCSE outcomes they achieve
  • show their distribution across local authorities and different types of schools
  • explore whether there is any evidence that different types of high attaining children need to be differentially catered for within our education system

We hope our research will be able to suggest what number and range of qualifications schools should plan to offer students in this group. We may be able to identify parts of the country or particular types of schools where these students are not currently reaching their potential. We will be able to show whether highly able children from particular backgrounds are not currently reaching their full potential, with tentative suggestions as to whether school or home support are mostly contributing to this underperformance.’

On 2 June 2015, The Sutton Trust published:

  • An Overview summarising the key findings and recommendations
  • A Press Release ‘Over a third of clever but poor boys significantly underachieve at GCSE’ and
  • A guest blog post – Advancing the able – authored by Rebecca Allen, education datalab director. This also appears on the education datalab site.

The post is mostly about the wider issue of the priority attached to support for high attainers. It contains a gratifying reference to ‘brilliant blogger Gifted Phoenix’, but readers can rest assured that I haven’t pulled any punches here as a consequence!

The press release provided the substance of the ensuing media coverage, including pieces by the BBC, Guardian, Mail, Schools Week and TES.

There was limited commentary on social media since release of the Research Brief coincided with publication of the legislation underpinning the new Conservative Government’s drive for academisation. I commented

.

.

Just prior to publication and at extremely short notice I was asked by Schools Week for a comment that foregrounded references to the pupil premium.

This was in their coverage:

“I wholeheartedly support any action to reinforce effective practice in using pupil premium to support ‘the most able disadvantaged’.

“Ofsted is already taking action, but this should also be embedded in pupil premium reviews and become a higher priority for the Education Endowment Foundation.

“Given their close relationship, I hope the Sutton Trust will pursue that course. They might also publicly oppose Teach First proposals for redistributing pupil premium away from high and middle attainers and engage more directly with those of us who are pursuing similar priorities.”

For those who are unaware, I have been campaigning against Teach First’s policy position on the pupil premium, scrutinised in this recent post: Fisking Teach First’s defence of its pupil premium policy (April 2015). This is also mentioned in the Allen blog post.

I have also written extensively about excellence gaps, provisionally defined as:

‘The difference between the percentage of disadvantaged learners who reach a specified age- or stage-related threshold of high achievement – or who secure the requisite progress between two such thresholds – and the percentage of all other eligible learners that do so.’

This appears in a two-part review of the evidence base published in September 2014:

I have drawn briefly on that material in the commentary towards the end of this post.

.

Research Brief findings

.

Main findings, definitions and terminology

The Research Brief reports its key findings thus:

  • 15% of highly able pupils who score in the top 10% nationally at age 11 fail to achieve in the top 25% at GCSE 
  • Boys, and particularly pupil premium eligible boys, are most likely to be in this missing talent group 
  • Highly able pupil premium pupils achieve half a grade less than other highly able pupils, on average, with a very long tail to underachievement 
  • Highly able pupil premium pupils are less likely to be taking GCSEs in history, geography, triple sciences or a language

These are repeated verbatim in the Trust’s overview of research, but are treated slightly differently in the press release, which foregrounds the performance of boys from disadvantaged backgrounds:

‘Over a third (36%) of bright but disadvantaged boys seriously underachieve at age 16, new Sutton Trust research reveals today. Clever but poor girls are slightly less likely to underperform, with just under a quarter (24%) getting disappointing GCSE results. These figures compare with 16% of boys and 9% of girls from better off homes who similarly fall behind by age 16.’

The opening paragraph of the Brief describes ‘highly able’ learners as those achieving within the top decile in KS2 tests. This is a measure of prior attainment, not a measure of ability and it would have been better if the document referred to high attainers throughout.

There is also a curious and cryptic reference to this terminology

‘…following Sutton Trust’s previously used notion of those ‘capable of excellence in school subjects’’

which is not further explained (though ‘capable’ implies a measure of ability rather than attainment).

The analysis is based on the 2014 GCSE cohort and is derived from ‘their mark on each KS2 test paper they sat in 2009’. It therefore depends on high average performance across statutory tests of English, maths and (presumably) science.

The single measure of GCSE performance is achievement on the Attainment 8 measure, as defined in 2014. This has not been made available through the 2014 Secondary Performance Tables.

Essentially Attainment 8 comprises English and maths (both double-weighted) any three EBacc subjects and three other approved qualifications (the Brief says they must be GCSEs).

The measure of ‘missing talent’ is derived from the relationship between these two performance measures. It comprises those who fall within the top decile at KS2 but outside the top quartile nationally (ie the top 25%) at KS4.

There is no explanation or justification for the selection of these two measures, why they are pitched differently and why the difference between them has been set at 15 percentage points.

The text explains that some 7,000 learners qualify as ‘missing talent’, about 15% of all highly able learners (so the total of all highly able learners must approach 47,000).

The analysis is based on certain presumptions about consistency of progress between key stages. The brief says, rather dismissively:

‘Progress through school is not always smooth and predictable. Of course some children do well at primary school but are overtaken by peers who thrive at secondary school.’

It does not mention education datalab’s own analysis which shows that only 45% of learners make the expected linear progress between KS2 and KS3 and just 33% do so between KS3 and KS4. It would have been interesting and useful to have seen material about inconsistency of progress amongst this cohort.

Presumably the selection of top decile at KS2 but top quartile at KS4 is intended in part to compensate for this effect.

The main body of the Research Brief provides analysis of four topics:

  • The characteristics of the ‘missing talent’ subset – covering gender, ethnic background and socio-economic disadvantage.
  • Performance on the Attainment 8 measure of ‘missing talent’ from disadvantaged backgrounds compared with their more advantaged peers.
  • Take up of EBacc subjects by this population, including triple science.
  • The geographical distribution of ‘missing talent’ between local authorities and schools.

The sections below deal with each of these in turn.

.

The characteristics of ‘missing talent’

The ‘missing talent’ population comprises some 7,000 learners, so about 1 in 7 of all highly able learners according to the definition deployed.

We are not provided with any substantive information about the characteristics of the total highly able cohort, so are unable to quantify the differences between the composition of that and the ‘missing talent’ subset.

However we are told that the ‘missing talent’ group:

  • Is slightly more likely to be White British, Black Caribbean, Pakistani or Bangladeshi and somewhat less likely to be Chinese, Indian or African.
  • Includes 1,557 learners (943 boys and 614 girls) who are disadvantaged. The measure of disadvantage is ‘ever 6 FSM’ the basis for the receipt of pupil premium on grounds of deprivation. This is approximately 22% of the ‘missing talent’ group.
  • Includes 24% of the ‘ever 6 FSM’ girls within the highly able cohort compared with 9% of others; and includes 36% of ‘ever 6 FSM’ boys within the whole cohort compared with 16% of others.

Hence: ‘ever 6 FSM’ learners of both genders are more likely to be part of ‘missing talent’; boys are more likely than girls to be included, regardless of socio-economic status; and ‘ever 6 FSM boys are significantly more likely to be included than ‘ever 6 FSM’ girls.

.

Missing Talent Capture

.

The fact that 36% of ‘ever 6 FSM’ boys fall within the ‘missing talent’ group is described as ‘staggering’.

By marrying the numbers given with the percentages in the charts above, it seems that some 5,180 of the total highly able population are disadvantaged – roughly 11% – so both disadvantaged boys and girls are heavily over-represented in the ‘missing talent’ subset (some 30% of the total disadvantaged population are ‘missing talent’) and significantly under-represented in the total ‘highly able’ cohort.

By comparison, the 2014 Secondary Performance Tables show that 26.9% of the overall 2014 GCSE cohort in state-funded schools are disadvantaged (though this includes children in care).

There is no analysis to show whether there is a particular problem with white working class boys (or any other sub-groups for that matter) although that might be expected.

.

Attainment 8 performance

Attainment 8 is described as ‘the Government’s preferred measure’, although we anticipate that proposals in the Conservative manifesto for a ‘compulsory EBacc’ will almost certainly change its nature significantly, even if it is not supplanted by the EBacc.

The document supplies a table showing the average grade (points equivalents) for different percentiles of the ‘highly able FSM6’, ‘highly able not FSM6’ and ‘not highly able’ populations.

.

missing talent Capture 2

.

Median (50th percentile) performance for ‘highly able FSM6’ is 6.7, compared with 7.2 for ‘highly able not FSM6’ and 5.0 for ‘not highly able’.

The commentary translates this:

‘…they [‘highly able FSM 6’] score 4As and 4Bs when their equally able classmates from better off backgrounds get straight As’.

By analogy, the ‘not highly able’ group are achieving straight Cs.

However, there is also a ‘long tail of underachievement’ amongst the highly able disadvantaged:

‘One in ten of the poor but clever pupils are barely achieving C grades (or doing much worse) and at this end of the distribution they are lagging their non-FSM6 peers by almost a whole GCSE grade per subject.’

The latter is actually only true at the 95th percentile.

By comparison, at that point in the distribution, the ‘not highly able’ population are achieving 8 F grades.

So there is a clear excellence gap between the Attainment 8 performance of the highly able and the highly able disadvantaged, though the difference only becomes severe at the extreme of the distribution – the reference to a ‘long tail’ is perhaps a little overdone.

.

Take-up of EBacc subjects

A second table shows the distribution of grades for ‘highly able FSM6’ and ‘highly able not FSM6’ across the five EBacc components: English, maths, sciences, humanities and languages.

.

Missing Talent Capture 3

This is not discussed extensively in the text, but it reveals some interesting comparisons. For example, the percentage point excellence gaps between the two populations at GCSE grades A*/A are: maths 17 points; English 16 points; sciences 22 points; humanities 21 points; and languages 18  points.

At the other extreme 23% of ‘highly able FSM6’ are Ungraded in languages, as are 16% in humanities. This is particularly worrying if true, but Ungraded almost certainly includes those not entered for an appropriate examination.

The commentary says that ‘almost a quarter will not be taking a language at GCSE’, which might suggest that U is a misnomer. It is not clear whether the U category includes both non-takers and ungraded results, however.

The Government’s plans for ‘compulsory EBacc’ seem likely to force all learners to take a language and history or geography in future.

They will be less likely to make triple science compulsory for high attainers, though this is deemed significant in the document:

Just 53% of the highly able FSM6 pupils take triple sciences, compared to 69% of those not in the FSM6 category. This may be through choice or because they are in one of the 20% of schools that does not offer the curriculum. Here again the differences are stark: 20% of highly able FSM6 pupils are in a school not offering triple sciences, compared to just 12% of the highly able not-FSM6 pupils.’

The EBacc does not itself require triple sciences. The implications for teacher supply and recruitment of extending them into the schools that do not currently offer them are not discussed.

.

Geographical distribution of ‘missing talent’

At local authority level the Brief provides a list of 20 areas with relatively high ‘missing talent’ and 20 areas at the other extreme.

The bulk of the former are described as areas where secondary pupil performance is low across the attainment spectrum, but four – Coventry, Lambeth, Leicester and Tower Hamlets – are good overall, so the underachievement of high attainers is apparently exceptional.

Some are described as having comparatively low populations of highly able learners but, as the text implies, that should not be an excuse for underachievement amongst this cohort.

It is not clear whether there is differential performance in respect of disadvantaged learners within the ‘missing talent’ group (though the sample sizes may have been too low to establish this).

It is, however, immediately noticeable that the list of areas with high ‘missing talent’ includes many of the most disadvantaged authorities, while the list with low levels of missing talent is much more ‘leafy’.

Most of the former are located in the Midlands or the North. Almost all were Excellence in Cities areas.

The ‘low missing talent’ list also includes 11 London boroughs, but there are only three on the ‘high missing talent’ list.

The Brief argues that schools with low levels of ‘missing talent’ might support others to improve. It proposes additional selection criteria including:

  • ‘A reasonable number of highly able pupils’ – the rather arbitrary cut-off specified is 7% of cohort. It is not clear whether this is the total cohort or only the GCSE cohort. If the latter, it is more than likely to vary from year to year.
  • ‘Relatively low levels of missing talent’ – fewer than 10% ‘significantly underperform’. It is not clear but one assumes that the sole measure is that described above (ie not within the top 25% on the Attainment 8 measure).
  • ‘A socially mixed intake’ with over 10% of FSM6 learners (this is very low indeed compared with the average for the 2014 GCSE cohort in state-funded schools of 26.9%. It suggests that most of the schools will have relatively advantaged intakes.)
  • Triple science must be offered and the schools must have ‘a positive Progress 8 score overall’ (presumably so that they perform reasonably well across the attainment spectrum).

There is no requirement for the school to have achieved a particular Ofsted rating at its most recent inspection.

We are told that there are some 300 schools meeting this description, but no details are given about their distribution between authorities and regions, beyond the fact that:

‘In half of the 20 local authorities with the highest levels of missing talent there is no exemplar school and so a different policy approach may have to be taken.’

This final section of the document becomes a little discursive, stating that:

‘Any new initiatives to support highly able children at risk of falling behind must recognise the successes and failures of past ‘Gifted and Talented’ initiatives, particularly those of the Blair and Brown governments.’

And

‘We believe that any programme of support – whether through the curriculum or through enrichment – must support schools and children in their localities.’

No effort is made to identify these successes and failures, or to provide evidence to substantiate the belief in localised support (or to explain exactly what that means).

.

Recommendations

.

In the Research Brief

The Research Brief itself consists largely of data analysis, but proffers a brief summary of key findings and a set of policy recommendations.

It is not clear whether these emanate from the authors of the research or have been superimposed by the Trust, but the content distinctly suggests the latter.

There are four recommendations (my emphases):

  • ‘The Government should implement the recommendations of Sutton Trust’s Mobility Manifesto to develop an effective national programme for highly able state school pupils, with ring-fenced funding to support evidence-based activities and tracking of pupils’ progress.
  • All schools must be made accountable for the progress of their most able pupils. These pupils should have access to triple sciences and must study a broad traditional curriculum, including a language and humanity, that widens their future educational opportunities. The Government should report the (3-year average) Progress 8 figures for highly able pupils in performance tables. Schools where highly able pupils currently underperform should be supported through the designation of another local exemplar school. In the small number of areas where there is no exemplary good practice, a one-off centralised support mechanism needs to be set-up.
  • Exemplar schools already successfully catering for highly able pupils that are located in areas of high missing talent should be invited to consider whether they are able to deliver a programme of extra-curricular support to raise horizons and aspirations for children living in the wider area.
  • Highly able pupils who receive Pupil Premium funding are at high risk of underperforming at age 16. Schools should be encouraged to use the Pupil Premium funding for these pupils to improve the support they are able to give them.’

These are also repeated unchanged in the research overview, but are summarised and rephrased slightly in the press release.

Instead of demanding ‘an effective national programme…with ring-fenced funding to support evidence-based activities and tracking of pupils’ progress’ this calls on the Government to:

‘…establish a new highly able fund to test the most effective ways of improving the progress and attainment of highly able students in comprehensive schools and to show that the needs of highly able students, especially those from low and middle income backgrounds, are placed high on the national policy agenda.’

This is heavily redolent of Labour’s pre-election commitment to introduce a Gifted and Talented Fund which would establish a new evidence base and help schools’ ‘work in stretching the most able pupils’.

My own analysis of Labour’s commitment (March 2015) drew attention to similarities between this and The Sutton Trust’s own Mobility Manifesto (September 2014).

.

In the Mobility Manifesto

The Manifesto is mentioned in the footnotes to the press release. It offers three recommendations pertaining to highly able learners:

  • Reintroduce ring-fenced government funding to support the most able learners (roughly the top ten per cent) in maintained schools and academies from key stage three upwards. This funding could go further if schools were required to provide some level of match funding.
  • Develop an evidence base of effective approaches for highly able pupils and ensure training and development for teachers on how to challenge their most able pupils most effectively.
  • Make a concerted effort to lever in additional support from universities and other partners with expertise in catering for the brightest pupils, including through creating a national programme for highly able learners, delivered through a network of universities and accessible to every state-funded secondary school serving areas of disadvantage.’

The press release also mentions the Trust’s Sutton Scholars Scheme, a pilot programme undertaken with partner universities that supports highly able learners from low and middle income backgrounds during KS3.

In 2013 there was an initial pilot with 100 pupils involving UCL. In 2014 this was extended to 400 pupils and four partner universities: UCL, Cambridge, Nottingham and Warwick.

The press release says it currently reaches 500 pupils but still involving just four universities, so this is presumably the size of the 2015 cohort.

The programmes at each institution are subtly different but all involve a mix of out-of-school activities. In most cases they appear to be rebadging elements of the universities’ existing outreach programmes; there is nothing startlingly innovative or radical about them.

.

Commentary

.

Quality of the Research Brief

The document is compressed into three sides of A4 so, inevitably, much valuable information is missing. Education datalab should consider making available a separate annex containing all the underlying data that can be released without infringing data protection rules.

The Brief does not address all the elements set out in the original project description. It does not show the distribution of high attainers by type of school, or discuss the impact on underperformance of home and school respectively, nor does it:

‘…explore whether there is any evidence that different types of high attaining children need to be differentially catered for within our education system’.

It seems that the project has been scaled back compared with these original intentions, whether for lack of useful data or some other reason.

When it comes to the findings that are included:

  • The general conclusions about underachievement, particularly amongst high attainers from disadvantaged backgrounds, add something to our understanding of achievement patterns and the nature of excellence gaps. But the treatment also begs several questions that remain unanswered. The discussion needs reconciling with education datalab’s own findings about the limited incidence of linear progress. Further analysis of the performance of high-attaining disadvantaged boys may be a particular priority.
  • The findings on the take-up of EBacc subjects are relatively unsurprising and second order by comparison. They ought really to have been set in the context of the new Government’s commitment to a ‘compulsory EBacc’ (see below).
  • The information about the distribution of ‘missing talent’ is compromised by the very limited analysis, especially of the distribution between schools. The criteria used to identify a subset of 300 exemplar schools do not bear close scrutiny.

There is no cross-referencing to the existing evidence base on excellence gaps, especially the material relating to whether disadvantaged high attainers remain so in ‘The Characteristics of High Attainers’ (DfES 2007), ‘Performing against the odds: developmental trajectories of children in the EPPSE 3-16 study’ (Siraj-Blatchford et al, 2011) and ‘Progress made by high-attaining children from disadvantaged backgrounds’ (Crawford et al 2014).

.

Prospects for the adoption of these recommendations

The recommendation that schools are more strongly encouraged to use the pupil premium to benefit these learners – and to do so effectively – is important, but the text should explain how this can be achieved.

Ofsted has already made the case for action, concluding in March 2015 that two-thirds of non-selective secondary schools are not yet using pupil premium effectively to support disadvantaged high attainers.

Ofsted is committed to ensuring that school inspections focus sharply on the progress of disadvantaged high attainers and that future thematic surveys investigate the effective use of pupil premium to support them.

It is also preparing a ‘most able’ evaluation toolkit that will address this issue. This might provide a basis for further guidance and professional development, as long as the material is high quality and sufficiently detailed.

Effective provision for high attainers should be a higher priority for the pupil premium champion and, as I have already suggested, should feature prominently and explicitly in the guidance supporting pupil premium reviews.

Above all, the EEF should be supporting research on this topic as part of a wider initiative to help schools close excellence gaps.

All parties, including the Government, should make clear their opposition to the policy of Teach First and its Fair Education Alliance to double-weight pupil premium for low attainers at the expense of high and middle attaining recipients.

If at all possible, Teach First should be persuaded to withdraw this misguided policy.

It seems highly probable that the Trust’s recommendation for access to ‘a broad traditional curriculum’ will be secured in part through the new Government’s commitment to make EBacc subjects compulsory.

This is likely to be justified on grounds of social justice, derived from the conviction that taking these subjects supports progression to post-16 education, employment and higher education.

But that notion is contested. When the Education Select Committee considered this issue they concluded (my emphasis):

‘We support the Government’s desire to have greater equality of opportunity for all students, and to improve the attainment of those eligible for free school meals. The evidence is unclear as to whether entering more disadvantaged students for EBac subjects would necessarily make a significant contribution to this aim. Concentrating on the subjects most valued for progression to higher education could mean schools improve the attainment and prospects of their lowest-performing students, who are disproportionately the poorest as well. However, other evidence suggests that the EBac might lead to a greater focus on those students on the borderline of achieving it, and therefore have a negative impact on the most vulnerable or disadvantaged young people, who could receive less attention as a result. At the same time, we believe that the EBac’s level of prescription does not adequately reflect the differences of interest or ability between individual young people, and risks the very shoe-horning of pupils into inappropriate courses about which one education minister has expressed concerns. Given these concerns, it is essential that the Government confirms how it will monitor the attainment of children on free school meals in the EBac.’

This policy will not secure universal access to triple science, though it seems likely that the Government will continue to support that in parallel.

In the final days of the Coalition government, a parliamentary answer said that:

‘Out of 3,910 mainstream secondary schools in England with at least one pupil at the end of key stage four, 2,736 schools entered at least one pupil for triple science GCSEs in 2013/14. This figure does not include schools which offered triple science GCSEs, but did not enter any pupils for these qualifications in 2013/14. It also excludes those schools with no pupils entered for triple science GCSEs but where pupils have been entered for all three of GCSE science, GCSE further science and GCSE further additional science, which together cover the same content as GCSE triple science.

The Government is providing £2.6 million in funding for the Triple Science Support Programme over the period 2014-16. This will give state funded schools with low take up of triple science practical support and guidance on providing triple science at GCSE. The support comprises professional development for teachers, setting up networks of schools to share good practice and advice on how to overcome barriers to offering triple science such as timetabling and lack of specialist teachers.’

The Conservative manifesto said:

‘We aim to make Britain the best place in the world to study maths, science and engineering, measured by improved performance in the PISA league tables…We will make sure that all students are pushed to achieve their potential and create more opportunities to stretch the most able.’

Continued emphasis on triple science seems highly likely, although this will contribute to wider pressures on teacher supply and recruitment.

The recommendation for an additional accountability measure is sound. There is after all a high attainer measure within the primary headline package, though it has not yet been defined beyond:

‘x% of pupils achieve a very high score in their age 11 assessments’.

In its response to consultation on secondary accountability arrangements, the previous government argued that high attainment would feature in the now defunct Data Portal intended to support the performance tables.

It will be important to ensure consistency between primary and secondary measures. The primary measure seems to be based on attainment rather than progress. The Sutton Trust seems convinced that the secondary equivalent should be a progress measure (Progress 8) but does not offer any justification for this.

It is also critical that the selected measures are reported separately for disadvantaged and all other learners, so that the size of the excellence gap is explicit.

.

Prospects for a new national programme

When it comes to the recommendation for a new national programme, the Trust needs to be clearer and more explicit about the fundamental design features.

The recommendations in the Mobility Manifesto and this latest publication are not fully consistent. No effort is made to cost these proposals, to identify the budgets that will support them, or to make connections with the Government’s wider education policy.

Piecing the two sets of recommendations together, it appears that:

  • The programme would cater exclusively for the top decile of high attainers in the state-funded secondary sector. Post-16 institutions and selective schools may or may not be included.
  • Participation would be determined entirely on the basis of KS2 test outcomes, but it is not clear whether learners would remain within the programme regardless of subsequent progress.
  • The programme would comprise two parallel arms – one providing support directly for learners, the other improving the quality of provision for them within their schools and colleges.
  • The support for learners is not defined, but would presumably draw on existing Trust programmes. It would include ‘extra-curricular support to raise horizons and aspirations’.
  • It is not entirely clear whether this support would be available exclusively to those from disadvantaged backgrounds (though we know it would be ‘accessible to every state-funded secondary school serving areas of disadvantage’).
  • The support for schools and colleges will develop and test effective practice in teaching these learners, in tracking and maximising their attainment and progress. It will provide associated professional development. It is not clear whether this will extend into other dimensions of effective whole school provision.
  • Delivery will be via some combination of a network of universities, a cadre of exemplar schools and other partners with expertise. The interaction between these different providers is not discussed.
  • The exemplar schools will be designated as such and will support other schools in their locality where high attainers under-achieve. They should also be ‘invited to consider’ delivering a programme of extra-curricular support for learners in their area.
  • There will also be an unspecified ‘one-off centralised support mechanism’ for areas with no exemplary schools. What this means is a mystery.
  • Costs will be met from a new ring-fenced ‘highly able fund’ the size of which is not quantified.

The relationship between this programme and the Trust’s proposed ‘Open Access Scheme’ – which would place high attaining students in independent schools – is not discussed. (I will not repeat again my arguments against this Scheme.)

The realistic prospect of securing a sufficiently large ring-fenced pot must be negligible in the present funding environment. Labour’s pre-election commitment to find some £15m (annually?) for this purpose is unlikely to be matched by the Conservatives.

Any support for improving the quality of provision in schools is likely to be found within existing budgets, including those supporting research, professional development, teaching schools, their alliances and their designated Specialist Leaders of Education.

STEM-related initiatives are particularly relevant given the Manifesto reference. One would hope for a systematic and co-ordinated approach rather than the piecemeal introduction of new projects.

I have elsewhere suggested a set of priorities including:

  • Guidance and associated professional development on effective whole school provision derived from a set of core principles, including the adoption of flexible, radical and innovative grouping arrangements.
  • Developing a coherent strategy for strengthening the STEM talent pipeline which harnesses the existing infrastructure and makes high quality support accessible to all learners regardless of the schools and colleges they attend.
  • Establishing centres of excellence and a stronger cadre of expert teachers, but also fostering system-wide partnership and collaboration by including the range of expertise available outside schools.

If funding is to go towards improving provision for learners, the only viable option is to use pupil premium, with the consequence that support will be targeted principally, if not exclusively, at disadvantaged high attainers.

I have elsewhere suggested a programme designed to support all such learners aged 11-18 located in state-funded schools and colleges. There is both wider reach and less deadweight if support is targeted at all eligible learners, rather than at schools ‘serving areas of disadvantage’.

It is critical to include the post-16 sector, given the significant proportion of disadvantaged high attainers who transfer post-GCSE.

This would be funded principally by a £50m topslice from the pupil premium budget (matching the topslice taken to support Y6/7 summer schools), though higher education outreach budgets would also contribute and there would be scope to attract additional philanthropic support.

The over-riding priority is to bring much-needed coherence to what is currently a fragmented market, enabling:

  • Learners to undertake a long-term support programme, tailored to their needs and drawing on the vast range of services offered by a variety of different providers, including universities, commercial and third sector organisations (such as the Trust itself).
  • These providers to position and market their services within a single online national prospectus, enabling them to identify gaps on the supply side and take action to fill them.
  • A single, unified, system-wide effort, harmonising the ‘pull’ from higher education fair access strategies and the ‘push’ from schools’ and colleges’ work to close excellence gaps.

I don’t yet recognise this coherence in the Trust’s preferred model.

.

GP

June 2015

The problem of reverse excellence gaps

This post compares the performance of primary schools that record significant proportions of disadvantaged high attainers.

spiral-77493_1280It explores the nature of excellence gaps, which I have previously defined as:

‘The difference between the percentage of disadvantaged learners who reach a specified age- or stage-related threshold of high achievement – or who secure the requisite progress between two such thresholds – and the percentage of all other eligible learners that do so.’

It draws particular attention to the incidence at school level of sizeable reverse excellence gaps where disadvantaged learners out-perform their more advantaged peers.

According to my theoretical model reverse gaps threaten equilibrium and should be corrected without depressing the achievement of disadvantaged high attainers.

In this post:

  • The measure of disadvantage is eligibility for the pupil premium – those eligible for free school meals at any time in the last six years (‘ever 6 FSM’) and children in care.
  • The measure of high attainment is Level 5 or above in KS2 reading, writing and maths combined.

.

National figures

The 2014 Primary School Performance Tables show that 24% of the cohort attending state-funded primary schools achieved KS2 Level 5 or above in reading, writing and maths combined. In 2013, the comparable figure was 21% and in 2012 it was 20%.

In 2014 some 650 primary schools managed a success rate of 50% or higher for the entire cohort, up from 425 in 2013 and 380 in 2012

The comparable national percentages for disadvantaged learners are 12% in 2014, 10% in 2013 and 9% in 2012. For all other learners (ie non-disadvantaged) they are 24% in 2012, 26% in 2013 and 29% in 2014.

In 2014, there were 97 state-funded schools where 50% or more of disadvantaged learners achieved this benchmark, compared with only 38 in 2013 and 42 in 2012. This group of schools provides the sample for this analysis.

Chart 1 below illustrates the national excellence gaps over time while Chart 2 compares the proportion of schools achieving 50% or higher on this measure with all learners and disadvantaged learners respectively.

.

REG graph 1

Chart 1: Percentage of disadvantaged and other learners achieving L5+ in KS2 reading, writing and maths, 2012-14

Chart 1 shows that all rates are improving, but the rate of improvement is slower for disadvantaged learners. So the socio-economic achievement gap at L5+ in reading, writing and maths combined has grown from 15% in 2012, to 16% in 2013 and then to 17% in 2014.

REG graph 2 

Chart 2: Number of schools where 50% of all/disadvantaged learners achieved L5+ in KS2 reading, writing and maths, 2012-14

Chart 2 shows steady improvement in the number of schools achieving outstandingly on this measure for all learners and disadvantaged learners alike (though there was a slight blip in 2013 in respect of the latter).

Since 2012, the proportion of schools achieving this benchmark with disadvantaged learners has increased more substantially than the proportion doing so with all learners. At first sight this is a positive trend.

However Chart 1 suggests that, even with the pupil premium, the national excellence gap between higher-attaining advantaged and disadvantaged learners is increasing steadily. This is a negative trend.

It might suggest either that high-attaining disadvantaged learners are not benefiting sufficiently from the premium, or that interventions targeted towards them are ineffective in closing gaps. Or perhaps both of these factors are in play.


Schools achieving high success rates with disadvantaged learners

The 97 schools achieving a success rate of 50% or more with their disadvantaged high attainers are geographically dispersed across all regions, although a very high proportion (40%) is located in London and over half are in London and the South-East.

.

Reg graph 3

Chart 3: Distribution of schools in sample by region

 .

Nineteen London boroughs are represented but eight of the 97 schools are located in a single borough – Greenwich – with a further five in Kensington and Chelsea. The reasons for this clustering are unclear, though it would suggest a degree of common practice.

Almost half of the sample consists of church schools, fairly equally divided between Church of England and Roman Catholic institutions. Seven of the 97 are academy converters, six are controlled, 42 are aided and the remainder are community schools.

Other variables include:

  • The average size of the KS2 cohort eligible for assessment is about 40 learners, with a range from 14 to 134.
  • The percentage of high attainers varies from 7% to 64%, compared with an average of 25% for all state-funded schools. More than one quarter of these schools record 40% or more high attainers.
  • The percentage of middle attainers ranges between 38% and 78%, compared with an average of 58% for state funded schools.
  • The percentage of low attainers lies between 0% and 38%, compared with the national average for state-funded schools of 18%. Only 15 of the sample record a percentage higher than this national average.
  • The percentage of disadvantaged learners ranges from 4% to 77%, compared with the national average for state-funded schools of 31%. Roughly one in five of the sample has 50% or more, while almost two in five have 20% or less.
  • The number of disadvantaged pupils in the cohort is between 6 and 48. (Schools with fewer than 5 in the cohort have their results suppressed). In only 22 of the sample is the number of disadvantaged pupils higher than 10.
  • In 12 of the schools there are no EAL pupils in the cohort but a further 11 are at 60% or higher, compared with an average for state-funded schools of 18%.

Overall there is significant variation between these schools.

.

School-level performance

The vast majority of the schools in the sample are strong performers overall on the L5 reading, writing and maths measure. All but five lie above the 2014 national average of 24% for state-funded schools and almost half are at 50% or higher.

The average point score ranges from 34.7 to 27.9, compared with the state-funded average of 28.7. All but 15 of the sample record an APS of 30 or higher. The average grade per pupil is 4B in one case only and 4A in fourteen more. Otherwise it is 5C or higher.

Many of these schools are also strong performers in KS2 L6 tests, though these results are not disaggregated for advantaged and disadvantaged learners.

More than four out of five are above the average 9% success rate for L6 maths in state-funded primary schools and almost two out of five are at 20% or higher.

As for L6 grammar, punctuation and spelling (GPS), some two-thirds are above the success rate of 4% for all state-funded primary schools and almost two out of five are at 10% or higher.

When it comes to the core measure used in this analysis, those at the top of the range appear at first sight to have performed outstandingly in 2014.

Four schools come in at over 80%, though none has a disadvantaged cohort larger than eight pupils. These are:

Not far behind them is Tollgate Primary School, Newham (71%) but Tollgate also has a cohort of 34 disadvantaged learners, almost three times the size of any of its nearest rivals.

What stands out from the data above all else is the fact that very few schools show any capacity to replicate this level of performance over two or three years in succession.

In some cases results for earlier years are suppressed because five or fewer disadvantaged pupils constituted the cohort. Leaving those aside, just 6 schools in the sample managed a success rate of 50% or higher in 2013 as well (so for two successive years) and no school managed it for three years in a row.

The schools closest to achieving this are:

  • Tollgate Primary School, Newham (71% in 2014, 50% in 2013 and 40% in 2013)

Only 9 of the sample achieved a success rate of 30% or higher for three years in a row.

The size and direction of excellence gaps

Another conspicuous finding is that several of these schools display sizeable reverse excellence gaps, where the performance of disadvantaged learners far exceeds that of their more advantaged peers.

Their success rates for all other pupils at L5 in reading, writing and maths combined vary enormously, ranging between 91% and 10%. Nineteen of the sample (20%) is at or below the national average rate for state-funded schools.

But in a clear majority of the sample the success rate for all other pupils is lower than it is for disadvantaged pupils.

The biggest reverse excellence gap is recorded by St John’s Church of England Primary School in Cheltenham, Gloucestershire, where the success rate for disadvantaged learners is 67%, compared with 19% for other learners, giving a huge disparity of 48 percentage points!

Several other schools record reverse gaps of 30 points or more, many of them church schools. This raises the intriguing possibility that the ethos and approach in such schools may be relatively more conducive to disadvantaged high attainers, although small numbers are undoubtedly a factor in some schools.

The ‘cliff-edge’ nature of the distinction between disadvantaged and other learners may also be a factor.

If schools have a relatively high proportion of comparatively disadvantaged learners ineligible for the pupil premium they may depress the results for the majority, especially if their particular needs are not being addressed.

At the other extreme, several schools perform creditably with their disadvantaged learners while also demonstrating large standard excellence gaps.

Some of the worst offenders are the schools celebrated above for achieving consistency over a three year period:

  • Fox Primary School has a 2014 excellence gap of 34 points (57% disadvantaged versus 91% advantaged)
  • Nelson Mandela School a similar gap of 28 points (54% disadvantaged versus 82% advantaged).

Only Tollgate School bucks this trend with a standard excellence gap of just two percentage points.

The chart below illustrates the variance in excellence gaps across the sample. Sizeable reverse gaps clearly predominate.

 .

REG graph 4

Chart 4: Incidence of reverse and normal excellence gaps in the sample

Out of the entire sample, only 17 schools returned success rates for advantaged and other learners that were within five percentage points of each other. Less than one-third of the sample falls within a variance of plus or minus 10%.

These extreme variations may in some cases be associated with big disparities in the sizes of the two groups: if disadvantaged high attainers are in single figures, differences can hinge on the performance of just one or two learners. But this does not apply in all cases. As noted above, the underperformance of relatively disadvantaged learners may also be a factor in the reverse gaps scenario.

Ofsted inspection reports

I was curious to see whether schools with sizeable excellence gaps – whether normal or reverse – had received comment on this point from Ofsted.

Of the schools within the sample, just one – Shrewsbury Cathedral Catholic Primary School – has been rated inadequate in its last inspection report. The inspection was undertaken in July 2014, so will not have reflected a huge reverse excellence gap of 38 percentage points in the 2014 KS2 assessments.

The underachievement of the most able is identified as a contributory factor in the special measures judgement but the report comments thus on the achievement of disadvantaged learners:

‘Although in Year 6, pupils eligible for additional government funding (the pupil premium) reach similar levels to their classmates in reading, writing and mathematics, eligible pupils attain lower standards than those reached by their classmates, in Years 2, 3 and 4. The gap between the attainment of eligible and non-eligible pupils in these year groups is widening in reading, writing and mathematics. In mathematics, in Year 3, eligible pupils are over a year behind their classmates.’

Two further schools in the sample were judged by Ofsted to require improvement, both in 2013 – St Matthew’s in Surbiton and St Stephen’s in Godstone, Surrey. All others that have been inspected were deemed outstanding or good.

At St Matthew’s inspectors commented on the achievement of disadvantaged learners:

‘Weaknesses in the attainment of Year 6 pupils supported by pupil premium funding were identified in 2012 and the school took action to reduce the gap in attainment between this group of pupils and their peers. This gap reduced in 2013 so that they were just over one term behind the others in English and mathematics, but there is still a substantial gap for similar pupils in Year 2, with almost a year’s gap evident in 2013. Support is now in place to tackle this.’

In 2014, the KS2 cohort at St Matthew’s achieved a 53% success rate on L5 reading, writing and maths, with disadvantaged learners at 50%, not too far behind.

At St Stephen’s inspectors said of disadvantaged learners:

‘The school successfully closes the gap between the attainment of pupils who benefit from the pupil premium and others. Indeed, in national tests at the end of Year 6 in 2012, the very small number of eligible pupils was attaining about a term ahead of their classmates in English and mathematics. Focused support is being given to eligible pupils in the current year to help all fulfil their potential.’

A more recent report in 2015 notes:

‘The school is successfully closing the gaps between disadvantaged pupils and others. In 2014, at the end of Key Stage 2, disadvantaged pupils outperformed other pupils nationally and in the school by about three terms in mathematics. They also outperformed other pupils nationally by about two terms nationally and in the school in reading and writing. Disadvantaged pupils across the school typically make faster progress than other pupils in reading, writing and mathematics.’

It is not clear whether inspectors regard this as a positive outcome.

Unfortunately, Tollgate, Nelson Mandela and Fox – all three outstanding – have not been inspected since 2008/2009. One wonders whether the significant excellence gaps at the latter might impact on their overall inspection grade.

.

Pupil Premium allocations 

I was equally curious to see what the websites for these three schools recorded about their use of the pupil premium.

Schools are required to publish details of how they spend the pupil premium and the effect this has on the attainment of the learners who attract it.

Ofsted has recently reported that only about one-third of non-selective secondary schools make appropriate use of the pupil premium to support their disadvantaged most able learners – and there is little reason to suppose that most primary schools are any more successful in this respect.

But are these three schools any different?

  • Fox Primary School has pupil premium income of £54.7K in 2014-15. It explains in its statement:

‘Beyond all of this, Fox directs a comparatively large proportion of budget to staffing to ensure small group teaching can target pupils of all attainment to attain and achieve higher than national expectations. Disadvantaged pupils who are attaining above the expected level are also benefitting from small group learning, including core subject lessons with class sizes up to 20. The impact of this approach can be seen in the APS and value added scores of disadvantaged pupils for the last 2 years at both KS1 and KS2. The improved staffing ratios are not included in pupil premium spend.’

  • Nelson Mandela School has so far not uploaded details for 2014-15. In 2013-14 it received pupil premium of £205.2K. The statement contains no explicit reference to high-attaining disadvantaged learners.
  • Tollgate Primary School received pupil premium of £302.2K in 2014-15. Its report covers this and the previous year. In 2013-14 there are entries for:

‘Aim Higher, challenging more able FSM pupils’ (Y6)

In 2014-15 funding is allocated to pay for five intervention teachers, whose role is described as:

‘Small group teaching for higher ability. Intervention programmes for FSM’.

.

Conclusion

The national excellence gap between disadvantaged and other learners achieving KS2 L5 in all of reading, writing and maths is growing, despite the pupil premium. The reasons for this require investigation and resolution.

Ofsted’s commitment to give the issue additional scrutiny will be helpful but may not be sufficient to turn this situation around. Other options should be considered.

The evidence suggests that schools’ capacity to sustain Level 5+ performance across reading, writing and maths for relatively large proportions of their disadvantaged learners is limited. High levels of performance are rarely maintained for two or three years in succession.

Where high success rates are achieved, more often than not this results in a significant reverse excellence gap.

Such reverse gaps may be affected by the small number of disadvantaged learners within some schools’ cohorts but there may also be evidence to suggest that several schools are succeeding with their disadvantaged high achievers at the expense of those from relatively more advantaged backgrounds.

Further investigation is necessary to establish the association between this trend and a ‘cliff-edge’ definition of disadvantage.

Such an outcome is not optimal or desirable and should be addressed quickly, though without depressing the performance of disadvantaged high achievers.

A handful of strong performers, including the majority of those that are relatively more consistent year-on-year, do well despite continuing to demonstrate sizeable standard excellence gaps.

Here the advantaged do outstandingly well and the disadvantaged do significantly worse, but still significantly better than in many other schools.

This outcome is not optimal either.

There are very few schools that perform consistently highly on this measure, for advantaged and disadvantaged high attainers alike.

Newham’s Tollgate Primary School is perhaps the nearest to exemplary practice. It receives significant pupil premium income and, in 2014-15, has invested in five intervention staff whose role is partially to provide small group teaching that benefits high attainers from disadvantaged backgrounds.

Fox Primary School has also acted to reduce group sizes, but it remains to be seen whether this will help to eliminate the large positive excellence gap apparent in 2014.

This is a model that others might replicate, provided their pupil premium income is substantial enough to underwrite the cost, but the necessary conditions for success are not yet clear and further research is necessary to establish and disseminate them.

Alternative approaches will be necessary for schools with small numbers of disadvantaged learners and a correspondingly small pupil premium budget.

The Education Endowment Fund (EEF) is the obvious source of funding. It should be much more explicitly focused on excellence gaps than it has been to date.

GP

May 2015

Proposals for a 2015 Schools White Paper: Most able

. 

This post sets out for consideration some ideas to inform a new ‘most able learners’ policy’ for inclusion in a forthcoming schools white paper.

paper-32377_1280Background

Now that we have a majority Conservative Government, attention is switching to the shape of its education policy agenda for the next five years.

Parliament will be recalled on 18 May and the new Government’s legislative agenda will be set out on 27 May in the Queen’s Speech.

During the Election campaign, Prime Minister Cameron announced plans for a Schools Bill within the first 100 days of the new Parliament.

That deadline expires on 26 August, during the long summer holiday, so one would expect the Bill to be published before term ends on 22 July or, failing that, in early September.

Cameron said the Bill would contain:

‘…more radical measures to ensure young people leave education with the skills they need. It will include new powers to force coasting schools, as well as failing schools, to accept new leadership, continuing the remarkable success story of Britain’s academy schools.’

DfE civil servants will already have established which Conservative Manifesto pledges require primary legislation, but Ministerial clarification will be required and there may be some as yet undeclared priorities to add to the list.

Some likely contenders include:

  • Resits of KS2 tests in Year 7 and making the EBacc compulsory in secondary schools.
  • Any school considered by Ofsted to Require Improvement will be handed over to ‘the best headteachers – backed by expert sponsors or high-performing neighbouring schools – unless it can demonstrate that it has a plan to improve rapidly’.
  • Permission for ‘all good schools to expand, whether they are maintained schools, academies, free schools or grammar schools’.
  • The establishment of an independent College of Teaching.

It is customary for new governments to publish a white paper covering the areas in which they intend to legislate, so we might expect either a Schools or Education White Paper by the end of the summer term.

Between School Selection

The prospects for renewed emphasis on selection are already being discussed. I gave a detailed account of the pre-Election scenario in ‘The Politics of Selection: Grammar schools and disadvantage’ (November 2014).

Key factors include:

  • The postponed decision on whether to approve a grammar school annexe in Sevenoaks and the precedent that would set elsewhere.
  • The existing scope for grammar schools – whether academies or LA-maintained – to increase their planned admission numbers (PAN), typically by adding additional forms of entry (FE).
  • The campaign by centre-right Tory group Conservative Voice to change the law to permit the establishment of new grammar schools, supported by messrs Brady, Davis and Fox, together with early indications of greater influence for Tory backbenchers through the 1922 Committee which Brady chairs.
  • Coded expressions of support from both Home Secretary May and newly-established Cabinet member Johnson, both considered future contenders for the Tory party leadership.

It will be important to establish a clear demarcation line in government policy.

.

Within School Selection

Back in 2007, when in Opposition, Prime Minister Cameron signalled a shift of emphasis, away from grammar schools and towards setting:

‘When I say I oppose nationwide selection by 11 between schools, that does not mean I oppose selection by academic ability altogether.

Quite the reverse. I am passionate about the importance of setting by ability within schools, so that we stretch the brightest kids and help those in danger of being left behind.’

With a Conservative Government this would be a motor of aspiration for the brightest kids from the poorest homes – effectively a ‘grammar stream’ in every subject in every school.’

In September 2014, there were indications of a revival of this strategy, though it was rapidly relegated into plans for Regional Schools Commissioners, newly empowered to intervene in any school rated inadequate by Ofsted to consider enforced setting as one of a ‘menu of options’.

I discussed the evolution of this position in ‘The Politics of Setting’ (November 2014).

In the event, this additional role for Commissioners did not feature in the Conservative Manifesto, so we do not know whether enforced setting will be added to their armoury. This requires clarification in the White Paper.

Ofsted’s evidence

Shortly before election campaigning began, Ofsted published its second survey report on the education of the most able in non-selective secondary schools, which I reviewed in ‘The most able students: Has Ofsted made progress?’ (March 2015).

The Key Findings highlight a litany of shortcomings. The first three alone say:

  • ‘National data show that too many of the most able students are still being let down and are failing to reach their full potential.’
  • ‘Nationally, too many of our most able students fail to achieve the grades they need to get into top universities.’
  • ‘Schools visited were rarely meeting the distinct needs of students who are most able and disadvantaged.’

In relation to this third point, Ofsted found that no more than a third of schools were using pupil premium funding effectively to target the needs of such pupils.

The Report committed Ofsted to focusing within inspections on the progress of the most able disadvantaged, the quality of the curriculum and information, advice and guidance. We wait to see how this will be reflected in the updated School Inspection Handbooks scheduled for publication later this term.

Meanwhile, Ofsted is also preparing a ‘most able evaluation toolkit for schools’ as part of its wider efforts to influence school improvement. The toolkit should feature in the White Paper and there is scope to consider building additional support around it.

.

Excellence Gaps and Pupil Premium

The Conservative Manifesto gave a clear commitment:

‘We will continue to provide the pupil premium, protected at current rates, so that schools receive additional money for those from the poorest backgrounds.’

It added:

‘And we will make schools funding fairer. We have already increased funding for the 69 least well-funded local authorities in the country, and will make this the baseline for their funding in the next Parliament.’

Teach First leads a group of educational organisations lobbying for pupil premium to be reallocated in such a way that those with lower prior attainment attract double the rate awarded to those whose prior attainment is at or above expectations.

I have been campaigning against this proposal, principally on the grounds that:

  • It robs Peter to pay Paul, inflicting collateral damage on the majority of eligible learners, including the ‘most able disadvantaged’, the majority of whom are already poorly served, as Ofsted has established.
  • Closing gaps between disadvantaged learners and their peers should continue to take priority over closing attainment gaps between low and high attainers. The core purpose of pupil premium should be tackling underachievement – rather than low achievement – amongst disadvantaged learners.
  • Any increase in funding weighted towards low prior attainment should be secured through reform of the school funding formula and involve careful consideration of the overlaps between deprivation, low attainment and additional needs, including SEN.

My own efforts to increase the priority attached to the most able disadvantaged include presenting the evidence base for excellence gaps which I define as:

‘The difference between the percentage of disadvantaged learners who reach a specified age- or stage-related threshold of high achievement – or who secure the requisite progress between two such thresholds – and the percentage of all other eligible learners that do so.’

There is increasing focus on excellence gaps in this country and they should be more fully reflected in Government policy as enshrined in the White Paper. Further assurances should be given over pupil premium rates and eligibility for them.

.

Other Manifesto commitments

The Conservative Manifesto includes – in a section headed ‘We will lead the world in maths and science’ – a generic commitment:

‘We will make sure that all students are pushed to achieve their potential and create more opportunities to stretch the most able.’

It is unclear whether this relates exclusively to maths and science. It might hint at the revival of a flagship policy of the last government, to establish a cadre of up to a dozen selective 16-19 maths free schools, which managed to generate just two of these.

As recommended towards the end of my latest post on these institutions there is plenty of scope to rationalise and reform the STEM talent pipeline more efficiently, so that it benefits students regardless of the schools and colleges they attend.

Those finalising the Tory Manifesto may have had in mind a rival Labour commitment – which didn’t make it into their manifesto – to establish a Gifted and Talented Fund. The purpose and application of this Fund, discussed here, were never clarified.

The Conservatives were wise not to take on board a poorly-conceived Policy Exchange proposal to introduce a National Scholarships Scheme. The idea behind this is to support the most talented undergraduates on condition that they attend a UK university and remain in the UK for three years after graduating. It has no merit whatsoever.

The way forward

Rather than adopt a piecemeal approach, or risk being tripped up by the febrile politics of selection, the new Government should actively consider the inclusion in its schools white paper of a holistic policy to support our high-attaining learners.

This would broaden the agenda and allow the Government to take credit for a more sophisticated, multi-stranded approach.

The policy should embrace primary, secondary and post-16 education, placing particular emphasis on reducing excellence gaps and improving access to our most selective universities.

.

.

Key elements of the policy should include:

  • Holding the line on grammar school expansion established in the Manifesto: expansion is permitted, through satellite schools where legally permissible, but new selective institutions are confined to 16+.
  • Incentivising and encouraging all existing grammar schools to give priority in their admission arrangements to learners eligible for the pupil premium – and supporting their wider efforts to work with primary schools to increase their intake of disadvantaged learners.
  • Sponsoring guidance and associated professional development for schools and colleges on effective institution-wide provision for their most able learners, developed from a set of core principles and designed to re-establish national consensus in this field. This should also feature Ofsted’s evaluation toolkit.
  • Sponsoring guidance for schools and colleges on the introduction of more flexible, radical and innovative grouping arrangements, extending beyond the confines of setting and streaming.
  • Developing a coherent strategy for strengthening the STEM talent pipeline which harnesses the existing infrastructure and makes high quality support accessible to all learners regardless of the schools and colleges they attend.
  • Top-slicing £50m from the pupil premium budget to underwrite a coherent market-driven programme supporting high-attaining disadvantaged students to progress to selective universities. This would integrate the ‘push’ from schools and colleges with the ‘pull’ from higher education achieving efficiencies on both sides.
  • Incentivising schools to give higher priority to disadvantaged high attainers by protecting their pupil premium entitlement and sharpening accountability arrangements, including Ofsted inspection but also the publication of key indicators in Performance Tables under the new assessment regime.
  • Building system-wide capacity, by establishing centres of excellence and a stronger cadre of expert teachers, but also by fostering collaboration and partnership between schools, colleges and all other sources of relevant expertise.

.

GP

May 2015

Response to Russell Hobby’s post of 8 May 2015

.

Thank you for taking the time and trouble to provide a considered response to my posts campaigning against the Fair Education Alliance position on the pupil premium: this one launching the campaign and this demolition of Teach First’s official policy statement of 29 April. New-EYEBALL-for-C4D

By responding in this fashion you set a fine example to the other organisations I am challenging to justify their support for this policy.

As things stand, just one other organisation – the Future Leaders Trust – has bothered to make its views known (and duly distanced itself from this policy).

The remainder are unwilling to break ranks. I am not sure whether to charge them with cowardice or complacency. I hope they will now follow your lead.

You have explained that NAHT has not yet formally adopted your recommendation that it support Teach First’s position, so your post constitutes ‘an interim position in lieu of a vote or resolution’. I have offered to meet you to discuss this, to clarify any outstanding issues and – hopefully – to persuade you to revise that recommendation.

Three factual clarifications to begin with:

  • NAHT is listed as a member of the Fair Education Alliance – whose Report Card 2014 is unclear over whether the proposed pupil premium reallocation applies equally to primary and secondary schools – and a supporter of the Read On. Get On campaign, whose publication specifically urges its application in the primary sector (and implies that it is following the Report Card in this respect).
  • There are no proposals in the Report Card for reform of the schools funding formula, whether to increase the weighting for deprivation or for low prior attainment. Teach First’s policy statement mentions a national funding formula but offers no specific proposals for reforming it. I note that NAHT is itself calling for a fair national funding formula.
  • The implication of Teach First’s policy statement is that disadvantaged learners with low prior attainment would attract a pupil premium rate double that available to all other disadvantaged learners, middle as well as high attainers. There is no proposal to change the FSM-driven definition of disadvantage that currently underpins the pupil premium and no definition of what constitutes low prior attainment. I note that you recently floated the idea of replacing ‘ever-6 FSM’ eligibility for pupil premium with ‘a measure of the prior attainment of pupils’.

These are my responses to the substantive points of your argument:

  • It is true that other eligible disadvantaged learners would continue to attract pupil premium funding – at half the rate available for eligible disadvantaged low attainers. This implies that their needs are deemed much less significant, and/or that those needs are significantly easier and cheaper to address. The Report Card makes clear that ‘the change of funding model would increase school accountability for ‘catching up’ pupils’ (p27). All schools would be expected to prioritise ‘catch up’ for disadvantaged low attainers over all other provision for disadvantaged learners. As ASCL has pointed out, this cuts directly across heads’ and governors’ autonomy in deciding how best to allocate pupil premium funding. Hence, in this context, NAHT is arguing for such autonomy to be curtailed. I trust you will concede this?
  • There are presently differential rates of pupil premium for primary and secondary learners. The differential in favour of primary schools was justified by the previous Government, not on equity grounds, but as helping schools to meet higher expectations of ‘secondary readiness’ associated with the new assessment and accountability regime. But the new regime also shifts schools away from a binary approach to a model in which improvements at any point along the scale of prior attainment are equally valued. Double weighting of pupil premium for low attainers points in precisely the opposite direction.
  • You posit an alternative position on equity that:

‘consists in ensuring first that all students achieve a certain level of competence and that therefore more should be invested in those furthest from that threshold… One rationale for this position would be that once individuals have passed a certain threshold they have a capacity for self-improvement whereby they can extend their own education and create opportunities. Below this threshold, such self-determination is significantly harder. Thus, if you had to choose only one option it could be more socially valuable to lift a student to this threshold than to continue to stretch a student already beyond the threshold.’

You explain this as a trade-off imposed as a consequence of scarce resources. Such a position may be ideologically driven, irrational and evidence-free, or supported by an evidence base. The former is not susceptible to counter-argument. The latter can be challenged through an alternative evidence base setting out the equivalent social and economic value of closing excellence gaps. I have presented that evidence base at length and will not revisit it here. But, in determining its final position I trust that NAHT will give full and careful consideration to both sets of evidence, rather than relying exclusively on material that supports your argument. I would welcome your assurances on this point.

  • My broader evidence-driven judgement is that, allowing for scarce resources, the most effective education systems (and the best schools) typically strive to keep excellence and equity in equilibrium. If one is allowed to predominate, the overall quality of education suffers. If a school (or a headteachers’ association or any other organisation targeted by this campaign) holds a particular view on this issue, in which equity is permitted to trump excellence, it seems reasonable to expect it to state explicitly the consequences of that decision – and to hold itself accountable to its stakeholders for those. In the case of a school I would expect this to be made explicit in the vision/mission statements intended for parents and staff alike – and in the documentation supplied to Ofsted prior to inspection. Otherwise there is every risk of hypocrisy. In short, a headteacher who takes this position cannot with integrity run a school that pretends the opposite. If it adopts this policy, I look forward to NAHT advising its members accordingly.
  • You suggest that the distinction between pupil premium and school funding formula is a second order issue. I do not agree. If there is a case for higher weighting for low prior attainment – to reflect the additional costs associated with tackling it – that should be reflected in the core budget through the funding formula, alongside the weightings for pupil deprivation and high needs, typically but not exclusively associated with SEN. The formula should properly recognise the overlap between these factors. I would welcome NAHT’s considered analysis of the totality of funding available to support (disadvantaged) low attainers through all funding streams, since treating pupil premium in isolation is misleading and inappropriate.
  • Pupil premium is different because it is supposed to benefit directly the learners who attract it. Indeed, the latest edition of the Governors’ handbook goes as far as to state that:

‘The pupil premium is a separate funding stream to be used solely for the educational benefit of children eligible and registered for free school meals at any time during the last six years, or those who have been in continuous public care for six months’ (page 109)

While this does not amount to a personal budget, the direct link between the funding and eligible learners means that the reallocation proposed will almost certainly have a direct impact on support for those whose entitlement is reduced, especially if backed up as proposed by accountability pressures. This overrides any consideration of individual needs and circumstances and applies regardless of the total pupil premium funding received by a school. I invite NAHT to consider carefully whether this is in the best interests of the schools its members lead.

  • You accept I have a point about ‘the level of detail in the calculations’. There is no detail whatsoever. This means that the organisations, including NAHT, who support Teach First’s position have effectively signed a ‘blank cheque’. I would hazard a guess that the full consequences of the redistribution, including the risks, have not been thought through. They certainly haven’t been presented. That is not what one would expect of a leading educational organisation, especially one that receives a substantial proportion of its funding from the taxpayer. I recommend that, before taking its decision, NAHT obtains and publishes detailed draft proposals and a full risk analysis.
  • You also acknowledge the potentially negative impact on impact Goal 5. This is especially true of the part relating to progression to selective universities. It suggests that neither Teach First nor the Alliance have properly considered the interaction between their different goals. To suggest, as the Teach First policy statement does, that the appropriate interventions necessary to support Goal 5 are straightforward and inexpensive betrays a certain naivety but also an ignorance of the National strategy for access and student success. I urge that NAHT considers carefully how it will support Goal 5 and whether there is not a risk – even a likelihood – that the proposed reductions in pupil premium would undermine that support.

As you know, both ASCL and the NGA now oppose Teach First’s position, as does John Dunford, the pupil premium champion. The Conservative Manifesto pledges that it will ‘continue to provide the pupil premium, protected at current rates’. NAHT should reassess its own position in the light of this information.

Ofsted has announced that it will ensure inspections continue to focus sharply on the progress of able disadvantaged students, given its finding that only one-third of non-selective secondary schools are using pupil premium effectively to support them.

I have seen no evidence to suggest that primary schools are any more effective in this respect. Regardless of the arguments above, NAHT should obtain this evidence and reflect carefully upon its implications. 

In conclusion, I once more urge NAHT to withdraw its support for Teach First’s policy, as advanced by the FEA and Read On. Get On.

I also invite you to consider what more NAHT itself could do to ensure that its members are providing the best possible education for their most able learners, especially those eligible for the pupil premium.

.

GP

May 2015

Fisking Teach First’s defence of its pupil premium policy

.

New-EYEBALL-for-C4DThis post scrutinises the arguments advanced by Teach First in defence of reallocating Pupil Premium away from disadvantaged learners with middle or high prior attainment.

Background

On 29 April, Teach First responded formally to my campaign against their proposal that the Pupil Premium budget should be redistributed so that learners with low prior attainment attract double the amount available for those with middle and high prior attainment.

The original proposal was included in the Fair Education Alliance Report Card (December 2014) and repeated in a primary sector context in The Power of Reading (April 2015) published on behalf of the Read On Get On campaign.

I set out formidable arguments against this proposal in an earlier post: ‘Protecting Pupil Premium for High Attainers’ (April 2015).

It invited all the organisations listed as members of the Fair Education Alliance or supporters of Read On Get On to justify their backing for the proposal or else distance themselves from it.

To date I have pursued twelve of these organisations for a reply. Eleven have failed to respond.

The twelfth, The Future Leaders Trust provided a statement:

‘…we agree that mid- and high-attainers from poor backgrounds should not be deprived of the support that they need to succeed. FSM children who achieve Level 5 in Reading, Writing and Maths at age 11 are still significantly less likely to go on to A-levels and university than their more affluent peers….rather than trying to redistribute the existing pie, we should be campaigning for a bigger one’.

I take that to mean that they do not fully support the proposal.

Brian Lightman of ASCL sent me a response

Lightman Capture

.

.

.

He wrote:

‘ASCL is not a member of the Fair Education Alliance at this stage although we do agree with many aspects for what they are doing and are in discussion with them about what we might support and how.

However with regards to this specific point our position is similar to the one that NGA expressed. We would not be in agreement with allocating PP on the basis of prior attainment.  FSM is a proxy measure which is used to identify the overall level of disadvantage in a school and therefore pupil premium allocations

We strongly believe that decisions about how to use the PP in schools should be decisions made by school leaders who are fully  accountable for the impact of their decisions.’

Russell Hobby of NAHT – which is a member of the Alliance – committed to a response but has so far failed to produce it. (Quelle surprise, since NAHT has form in that department.)

.

The National Governors’ Association (NGA) has already confirmed its opposition to Teach First’s position.

.

.

Teach First’s argument is also opposed by John Dunford, the Pupil Premium Champion, and by the Sutton Trust.

.

The Teach First response is headed ‘Our policy position on the pupil premium’. It begins:

‘Recently, we’ve had a few questions on our policy position on the Pupil Premium, which we endorsed in the Fair Education Alliance Report Card 2015.’

This helpfully confirms that the proposal set out in the Report Card is official Teach First policy.

It is rather less helpful in failing to acknowledge the source of those questions and failing to link to the counter-arguments set out in my post.

This means that those who want to make up their own minds whether they support Teach First’s position have only one side of the argument available to them. I would have expected more generosity of spirit from an organisation as powerful as Teach First, especially when taking on a singleton blogger like me.

The remainder of this post fisks the Teach First policy position statement.

It strives wherever possible to supplement rather than repeat the substantive arguments advanced in my earlier post, so those who want to consider the case in the round do need to revisit that in addition to the material below.

Recommendation

The statement begins by reiterating the original recommendation, to:

‘Target pupil premium by attainment as well as disadvantage measures. This could be achieved through halving current funding per pupil for FSM Ever 6 [a deprivation measure which includes pupils who have ever been a Looked After Child or eligible for Free School Meals in the previous six years]. Half of this funding could then be re-allocated to pupils eligible for FSM Ever 6 who have low prior attainment. This would give double-weighting to those low income pupils most in need of intervention without raising overall pupil premium spend. The change of funding model would increase school accountability for ‘catching up’ pupils.’

The full implications of what is now declared as official Teach First policy are extremely unclear, because there is no modelling, in the Report Card or elsewhere, of the redistribution or its likely effects.

Indeed, when I challenged Teach First over one aspect of modelling, it admitted that none had been undertaken.

In the absence of any clarification of how the redistribution would work, this is my best guess at what the recommendation means.

One begins with an assumption that one-third of pupil premium beneficiaries are low attainers, while two-thirds are middle and high attainers. (In 2014, 67% of disadvantaged learners achieved KS L4 and above in reading, writing and maths, meaning 33% did not.)

Given a total pupil premium budget of £2.5bn per year, assuming equal shares, the low attainers get £833.33m and the middle and high attainers together get £1.67bn.

One removes half of the funding from the high and middle attainers together – so £833.33m in total, leaving an equivalent sum behind.

The sum removed is added to the low attainers’ budget giving them a total of £1.67bn, meaning they have double the amount available for the other two groups combined.

But this outcome would mean one group, half the size of the other, would also have double the funding, hence each low attainer within that group would have four times the funding allocated to each middle and high attainer.

To make the equation work, one has to divide the sum initially removed from the high and middle attainers into two, allocating £416.67m into each pot.

Then there is £1.25bn for the low attainers and an identical £1.25bn for the middle and high attainers, but there are twice as many of the latter, so each of them gets half the sum available to each low attainer.

Confused yet?

In any case, all of this is guesswork because Teach First has not yet:

  • Confirmed whether this proposal applies to both primary and secondary schools though, since it is referenced in a primary context by the ‘Read On Get On.’ Report and this statement mentions the primary sector in passing , one assumes that it applies equally in both.
  • Defined what constitutes low prior attainment. At secondary level for example, is it below the scaled score equivalent of Level 4b in reading writing and maths combined? Or does it count each assessment separately? Or is it achievement below Level 4, either individually or combined? What is the equivalent measure at primary level? Your guess is as good as mine.

It really behoves Teach First to be clearer on these issues than it has been to date.

However the recommendation above states clearly that learners attracting the pupil premium with low prior attainment would have ‘double weighting’, implying that those with middle and high prior attainment would find their allocations single weighted, so pitched at half this value.

So, in the absence of any further elucidation, I assume that each low attaining pupil premium beneficiary would in future receive twice as much as each middle and high attaining beneficiary.

It would be good to know the size of the premium Teach First expects to be available to each category.

One possible outcome, using the very approximate ratio above, might be:

  • Low attainer primary pupil premium of £1,950 and high/middle attainer primary pupil premium of £975, compared with the present rate of £1,300.
  • Low attainer secondary pupil premium of £1,402 and high/middle attainer pupil premium of £701.

Low attainers would get an additional 50% top-up while all middle/high attainers would get 75% of what they do now.

Until we know the size of the uprating and the numbers used in the calculation, we cannot quantify the redistributive impact, so Teach First has asked its supporters to sign a blank cheque (and they have done so, apparently without too much scrutiny).

.

Pupil premium as it operates now

. 

The positive

The policy statement says:

Teach First is fully supportive of the Pupil Premium. It has been an incredibly important tool that helps to achieve our vision that no child’s success is limited by their socio-economic background.  We will continue to advocate for it, and for it to be protected and enhanced. The introduction of the Pupil Premium has increased accountability for the progress of the country’s poorest children and since this was introduced, an increase in attainment has been seen in those areas where they are the minority, though they still significantly underperform their wealthier peers. We hope and expect the full impact of the Pupil Premium will become apparent as the funding beds in and those pupils who have benefitted from it complete their full school journey.’

The commitment to continued advocacy for the pupil premium to be protected and enhanced rings rather hollow, given that perhaps two-thirds of beneficiaries would have their allocations reduced to half the value of the premium provided for their low attaining peers.

One assumes that ‘protected’ means Pupil Premium should continue to be ring-fenced outside the school funding formula.

‘Enhanced’ is potentially meaningless. It stands proxy for ‘increased’ but, given the wider pressures on the national schools budget, there is little prospect of increasing the total pupil premium budget by the sum necessary to uprate low attainers’ allocations while leaving others unchanged. 

This is apparently what the Future Leaders Trust would like to see, but it simply isn’t realistic.

The data supporting the claim of an increase in attainment since the premium was introduced is unsupported by evidence. What level of attainment? What measure of attainment? What size of area? How do we know the improvement is attributable to the Pupil Premium, as opposed to other factors?

In particular, does this apply to middle and high attainers? If so, what evidence is there to suggest that significantly reducing the sum available to support them will not detract from this progress?

.

The negative

The statement continues:

Schools are held accountable to Ofsted for their spending of the Pupil Premium – demonstrating how it has contributed to improved attainment of eligible pupils. There has not yet been a systematic review of how schools are spending the Pupil Premium, however there is some evidence from Ofsted that Pupil Premium is not always being used as effectively as it could be – in some instances plugging gaps in school budgets which have faced cuts – and that it is not always meeting the needs of those who are falling furthest behind (e.g. Chapter 6 in The Tail).’

This betrays selective use of the evidence base.

Where the funding is being used to plug gaps in the school budget (something that Teach First is also advocating at the macro level – see below) surely middle and high attainers will be suffering equally as much as low attainers, quite possibly more.

In ‘The pupil premium: How schools are spending the funding’ (February 2013), Ofsted reported:

‘Where schools spent the Pupil Premium funding successfully to improve achievement, they shared many of the following characteristics. They:

  • carefully ring-fenced the funding so that they always spent it on the target group of pupils
  • never confused eligibility for the Pupil Premium with low ability, and focused on supporting their disadvantaged pupils to achieve the highest levels.’

Conversely:

‘Where schools were less successful in spending the funding, they tended to have at least some of the following characteristics. They…

  • focused on pupils attaining the nationally expected level at the end of the key stage (Level 4, five A* to C grades at GCSE) but did not go beyond these expectations, so some more able eligible pupils underachieved…’

In ‘The most able students: An update on progress’ (March 2015), Ofsted said:

Our report in 2013 found few instances of the pupil premium being used effectively to support the disadvantaged most able pupils. In the schools visited for this survey, about a third were using the pupil premium funding effectively to target the needs of these pupils.

Ofsted concludes:

‘… more needs to be done to develop a clearer picture of how well schools use pupil premium funding for their most able students who are disadvantaged and the quality of information, advice and guidance provided for them. Ofsted needs to sharpen its practice in this area.’

Most of the evidence I have seen on this issue suggests that the lowest attainers are more likely than higher attainers to have their needs addressed appropriately through the pupil premium.

The case for reallocation via both pupil premium and the NFF

My previous post argues that, to the extent that reallocation is needed, it should be undertaken solely through the national funding formula (NFF) since using pupil premium creates too much ‘collateral damage’ – in the shape of lower allocations for middle and high attainers.

Teach First asserts:

 ‘We believe that low prior attainment is a compounding disadvantage and should be recognised in the National Funding Formula but that there would also be value in making extra funding to low attainers explicit through shifting the emphasis onto this group in the Pupil Premium.

The re-allocation within Pupil Premium funding would incentivise schools to make more progress with their most needy low income pupils: it would focus the accountability – as well as the financial support – directly on that group of pupils most in need of intervention.’

The case for recognition in the NFF is surely built on the costs involved in raising the attainment of low attainers, whether advantaged or disadvantaged.

If Teach First want to make extra funding for low attainers more explicit, that might be achieved by introducing an additional and entirely separate low attainers’ premium which recognises the needs of advantaged and disadvantaged low attainers alike.

But it would be administratively complex for schools to administer two overlapping ring-fenced budgets. It would be more straightforward to undertake the redistribution entirely through the NFF.

Accountability is achieved fundamentally through Ofsted inspection and School Performance Tables. If Teach First believe that schools need to be made more accountable for improving the performance of disadvantaged low attainers – and they cite no evidence to show that this is necessary – those are the obvious routes.

.

Grounds for justifying the policy

I had asked Teach First to explain whether it justified the proposal on the grounds that it would divert extra funding to ‘catch-up’ or that it would redistribute wider deprivation funding between schools.

The policy statement makes clear that both are in play, but one takes precedence over the other:

  • First and foremost, Teach First apparently believes that: those with low prior attainment have greater needs; that the potential benefits of investment in low attainers are more significant; and that effective interventions for them are comparatively more expensive than those for disadvantaged middle and high attainers.
  • Secondly, this is assumed to be an effective method of redistributing funding away from a few (number unquantified) schools that have built up substantial funding surpluses through the combined effects of the current NFF and pupil premium, towards some (number again unquantified) which receive rather less support.

Each segment of this argument is tackled below.

.

The impact of low attainment

The statement says:

We believe this is important because intervention at the lower ends of the prior attainment distribution could have significant impact on later attainment.  The FEA report card showed that those who fall behind early are not likely to catch up – last year only 7% of pupils achieving below expected levels aged 11 went on to get 5 ‘good’ GCSEs aged 16. And we charted how this ‘class ceiling’ can systemically hold some pupils back – having a knock-on effect on their wellbeing, employment and access to higher education.

There is similar evidence in respect of disadvantaged high attainers, where the comparator group are those with equivalent prior attainment from more advantaged backgrounds.

In ‘Closing England’s Excellence Gaps: Part 2’ (September 2014) I set out all the research evidence I could find on the subsequent progress made by high attainers, including:

  • The chances of FSM-eligible KS2 high attainers still being so at the end of KS4 are 45% lower than for other high attainers with similar prior attainment and characteristics (DfES 2007)
  • 58% of FSM students within the ‘most able’ population in KS2 and attending non-selective secondary schools go on to achieve A*-B GCSE grades in English and maths, compared with 75% of non-FSM pupils, giving a gap of 17 percentage points. (Ofsted 2013)
  • Children from poorer backgrounds who are high attaining at age 7 are more likely to fall off a high attainment trajectory than children from richer backgrounds. We find that high-achieving children from the most deprived families perform worse than lower-achieving students from the least deprived families by Key Stage 4. Conversely, lower-achieving affluent children catch up with higher-achieving deprived children between Key Stage 2 and Key Stage 4.’ (Vignoles 2014)

Teach First continues:

Recent analysis of pupils’ progress has shown that – although the majority of pupils do not have linear trajectories – pupils with high prior attainment are much more likely to stay on a linear trajectory than those with low prior attainment… However, low prior-attainers at Primary and Secondary have much more varied trajectories – indicating that rapid progress is possible, despite the fact that it is often not the case – and that focus on this group could be fruitful.’

I am not quite sure what this contributes to the argument. The analysis relates to progress subsequent to KS1 attainment. As the paper notes:

For children achieving a Level 1C, B or A at this stage, their development is so unpredictable that most will either outperform or underperform any Key Stage Two target that might be set.’

Moreover, the percentages are low at all levels – for example, only 12% of pupils with L3C at KS1 make linear progress at all key stages.

And of course they apply to all learners and not to disadvantaged learners, so we cannot see how much variation there is as a consequence of disadvantage.

The same is true of the primary and secondary transition matrices which, amongst other things show that, in 2014:

  • Of those with KS2 L5A in English or maths only half (48% in maths; 51% in English) achieved a GCSE A* grade.
  • Of those with KS2 L5C in English or maths, just one in five makes only a single level of progress by the end of KS4 in English, while the same is true of almost a third of students in maths.

Perhaps more to the point, excellence gaps are wide and growing. The graph below compares the percentage point gaps between disadvantaged and all other learners at KS2 L4 and above and L5 and above in 2013 and 2014 respectively.

.

Fisk graph

.

In 2014 the L5 gaps are larger across the board, with particularly large differences in maths and reading. In the latter, the gap at L5+ is more than twice as large as it is at L4+.

I note in passing that the Teach First model would presumably involve any disadvantaged low attainer who subsequently achieved or exceeded the expected level of performance moving from the higher level of pupil premium to the lower, otherwise the system would be inequitable. This would be complex and costly to administer.

Finally in this section, Teach First argues:

‘As well as huge personal cost, there is huge national cost to this underachievement – consultancy BCG estimated that boosting the attainment of this group could raise GDP by up to £56bn a year by 2050 (BCG, 2013)’

This is a secondary reference to a finding quoted in ‘The Tail’, which appears to be a sacred script for Teach First and the probable source of their false ideological position.

The actual wording in Marshall’s book is:

‘In a comparable study for the UK, the consulting firm BCG found that matching Finnish levels of social mobility (in terms of raising the educational outcomes of poor children) would add £6bn a year to GDP by 2030 and £56bn a year by 2050. Bringing below-average students in the UK to the national average would add £14bn a year to GDP by 2030 and £140bn by 2050.’

It doesn’t inspire confidence that Teach First has misquoted this statement in the Report Card as well as in its policy statement.

The original source is the Sutton Trust’s ‘Mobility Manifesto’ (2010). The calculations are based on PISA 2006 average scores in maths and science and based on a methodology derived by Hanushek. I shall leave it to others to comment on the reliability of the findings.

The first calculation involved estimating the benefits of matching the distribution of scores across the UK (so not just England) with those of Finland; the second with raising attainment across all socio-economic groups (based on parents’ education) to the UK average (excepting the higher than average value already recorded by the highest socio-economic group).

This is of course an entirely hypothetical model which attempts to quantify the impact of education on economic growth.

I will only note that, in ‘The High Cost of Low Educational Performance’ (2010) Hanushek also calculates the not inconsiderable benefits of improving average PISA maths and science performance by 25 points, so impacting across the attainment spectrum.

I reviewed the parallel literature on the economic benefits of investment at the top end in ‘The Economics of Gifted Education Revisited’ (March 2013).

In light of that, it seems to me there is a reasonable case for arguing that investment at the top end would yield commensurate benefits.

Hanushek himself recognises that:

Importantly, the relative size of the effects of performance at the bottom and at the top of the distribution depends on the specification, and further research is needed to yield more detailed predictions. Even so, the evidence strongly suggests that both dimensions of educational performance count for the growth potential of an economy.’

. 

The impact on Goal 5

My original post pointed out that the Fair Education Alliance was also pursuing another goal to:

Narrow the gap in university graduation, including from the 25% most selective universities

The Fair Education Alliance is committed to closing the graduation gap between young people from low income backgrounds and those from high income backgrounds. Our goal is for at least 5,000 more pupils from low income backgrounds to graduate each year, with 1,600 of these young people graduating from the most selective universities.’

I argued that reducing pupil premium for middle and high attainers would make this much harder to achieve, especially the highlighted final phrase, because it would reduce the chances of such learners achieving the grades necessary for admission to such universities.

Teach First’s policy statement says:

We see this recommendation as focusing on a different part of ‘the gap’ from Impact Goal 5 (the gap in university access) recommendations – this policy is about raising the attainment at KS2 and KS4 (our Impact Goals One and Two) for some of the nation’s most vulnerable children.’

This is risible I’m afraid, since a corollary of rationing pupil premium in this fashion is that exactly those disadvantaged learners most likely to proceed to selective universities will lose funding, while those least likely to do so will gain.

The reference to ‘vulnerable children’ introduces a whole new dimension, only for it to disappear as rapidly. Because if we are talking about funding for additional needs, perhaps SEN or behavioural, a range of additional considerations (and funding streams) apply.

Teach First continues:

We know that the kind of intensive interventions needed to raise attainment can be expensive and that working to change a pupil’s trajectory is likely to be harder than to ‘keep pupils on track’.  We also know that there are an array of inexpensive projects working with schools who can boost the non-cognitive and academic skills of those pupils already on positive trajectories – such as debatemateThe Brilliant Club and our own Futures programme. Hence our recommendation that Pupil Premium funding is redistributed to give greater weighting to low prior attainment and the more expensive interventions required there to change a child’s life.’

Hang on, weren’t we told earlier that the majority of students don’t have linear trajectories?

I would like to see evidence that it is necessarily harder to move, for example, a secure L3 to a L4 than it is to move a secure L5 to a L6. My experience suggests that interventions to raise disadvantaged attainment at the top end may need to be equally intensive as those lower down, especially when the focus is admission to selective universities.

On top of pupil premium, there is additional investment in catch-up, including over £50m a year (£500 per pupil) for the Catch-up Premium and the £50m annual topslice from the pupil premium budget for end of KS2 summer schools, also heavily focused on catch-up.

I have called for a similar £50m topslice to support intensive provision for disadvantaged high attainers seeking admission to selective universities.

In their parallel response to that post, Teach First says:

‘The single biggest factor linked to HE access is prior attainment. The Russell Group highlight that, of 15-year-olds on Free School Meals in 2007, only 0.3% achieved 3As or equivalent in their A-levels two years later – a huge barrier for progression to the most selective universities.

In this response, however, it all seems much more straightforward. There ‘are [sic] an array of inexpensive projects’ that can sort this out. (Do English teachers now consider an array to be plural?)

Unfortunately it’s not that simple. I believe debatemate and The Brilliant Club are both Teach First spin-offs (run by alumni). While debatemate is a member of the Fair Education Alliance, The Brilliant Club is not. While debatemate is focused on developing speaking and listening and critical thinking skills, The Brilliant Club is dedicated principally to placing PhD students in schools.

No doubt both are valuable niche programmes and there are dozens more like them, offered by commercial, third sector or university providers. Some are free, some relatively cheap, others more expensive.

The problem is that disadvantaged students aiming for selective universities need a coherent, long-term support programme that addresses their particular strengths and weaknesses. This is increasingly recognised in the national strategy for access.

They also need support from their schools to secure that provision, drawing on a range of different providers to supply the elements they must combine to generate a holistic programme. That’s precisely what my proposed £50m pupil premium topslice would achieve.

It would support a personal budget of £2,000 a year (almost exactly the same as the illustrative higher rate pupil premium for low attainers above) for some 5,000 high attaining pupil premium eligible learners.

It would be designed to increase significantly the number of such students progressing to high tariff universities, including Russell Group institutions and especially Oxbridge.

No sign of Teach First support for this of course.

.

Redistribution of funding

Reverting to its secondary reason for reallocating pupil premium, Teach First argues:

‘A secondary effect of this Pupil Premium change is that it might better recognise the compound disadvantage of growing up in a low income home in an area with a history of educational under-performance.

The Free School Meals (FSM) measure of disadvantage in the UK is not fully progressive or entirely comprehensive. For example, the binary FSM/non-FSM to dictate funding does not allow for recognition of  low-income families who just miss the eligibility criteria for Free School Meals; the national funding formula does not currently compensate for geographical isolation and high transport costs which can compound low incomes in parts of the country. Consequently – due to the combination of a high intake of pupils attracting the Premium and a currently unequal national school funding formula – there are a small number of very successful schools building up surpluses. Meanwhile some schools with arguably greater need, where pupils suffer different socioeconomic disadvantages that affect their attainment, are receiving comparatively little extra funding. This hampers their ability to deal with the challenges that their students face and to prevent those vulnerable pupils from falling behind their peers.  Those areas struggling to raise the attainment of their deprived pupils would most benefit from this double-weighting for their pupils who have fallen behind.’

My previous post argued strongly that any redistribution of this nature should be undertaken through the NFF and not the pupil premium.

Teach First is perfectly at liberty to lobby for changes to the Formula that would achieve its desired outcomes, though it seems that only ‘a small number’ of schools have built up surpluses.

There is no reason in principle why the NFF should not take account of aspects of disadvantage not caught by ‘ever 6 FSM’ (or indeed the other routes to pupil premium), or reflect sparsity factors.

Pupil premium reallocation might be a ‘quick fix’ for this problem but, as noted above, the collateral damage is too great. It drives a coach and horses through the principle that every ‘ever 6 FSM’ learner attracts the same rate of support. As such, it is not to be tolerated.

.

Conclusion

This policy position is fundamentally inequitable, predicated as it is on the mistaken ideological assumption that a low attainer’s needs must necessarily outweigh and be prioritised over those of a high attainer with the same level of disadvantage.

Teach First will surely nail their colours to this mast and sail away into the sunset. In doing so, they confirm the existence of the bias I already suspected.

But, in the words of the Report Card itself, we need ‘a fair education for all’ supported by the ‘sound moral argument for giving every child an equal chance to succeed‘. Success should not mean all learners achieving the same outcomes. The success of one group should not be at the expense of another.

Nothing in Teach First’s new line of argument has persuaded me that high attainers’ chances of success will be protected if their pupil premium is reduced in this way. The same goes for the ‘squeezed middle’.

At bottom, this is nothing more than robbing Peter to pay Paul.

So I call again on the members of the Fair Education Alliance and supporters of Read On Get On to justify their commitment to this ill-conceived and ill-formed idea.

Or else make clear that they no longer support it.

.

.

GP

April 2015

Why McInerney is just plain wrong

.

I should be completing my next evidence-based post but, 24 hours on from reading this evidence-light Guardian article by Laura McInerney, I am still incandescent.

.

.

I find I cannot return to normal business until I have shredded these flimsy arguments.  So this post is by way of catharsis.

McInerney’s core premiss is that political parties of all colours focus disproportionately on ‘the smartest children’ while ‘ignoring lower ability learners’.

This poisonous ideology seems particularly prevalent amongst Teach First types. I imagine they are regurgitating lessons they learned on its courses,

I have seen it promulgated by rising stars in the profession. That exchange prompted this previous post which attempted a balanced, rational analysis of our respective positions.

Ideologues cannot be persuaded by evidence, so there is no hope for McInerney and her ilk, but I hope that more open-minded readers will be swayed a little by the reasoning below.

.

What does she mean by ability?

McInerney distinguishes learners who are ‘smart’ or ‘bright’ from those who are ‘lower ability’. This betrays a curious adherence to old-fashioned notions of fixed ability, dividing children into sheep and goats.

There is no recognition of ability as a continuum, or of the capacity of learners to improve through effort, if given the right support.

The principles of personalised learning are thrown out of the window.

Education is not a matter of enabling every learner to ‘become the best that they can be’. Instead it is a zero sum game, trading off the benefits given to one fixed group – the smart kids – against those allegedly denied to another – the lower ability learners.

There is also an elementary confusion between ability and attainment.

It seems that McInerney is concerned with the latter (‘get good marks’; ‘received a high grade’) yet her terminology (‘lower-ability pupils’; ‘the smartest children’; ‘gifted and talented’) is heavily redolent of the former.

.

What does she mean by focusing on the top rather than the tail?

According to McInerney’s notions, these ‘lower ability’ kids face a sad destiny. They are ‘more likely to truant, be excluded or become unemployed’, more likely to ‘slip into unskilled jobs’ and, by implication, form part of the prison population (‘75% of prisoners are illiterate’).

If we accept that low attainers are preponderant in these categories, then it is logical to conclude that programmes focused on tackling such problems are predominantly benefiting low attainers.

So governments’ investment in action to improve behaviour and discipline, tackle truancy and offer Alternative Provision must be distributed accordingly when we are calculating the inputs on either side of this equation.

Since the bulk of those with special educational needs are also low attainers, the same logic must be applied to SEN funding.

And of course most of the £2.5bn pupil premium budget is headed in the same direction.

Set against the size of some of these budgets, Labour’s commitment to invest a paltry £15 million in supporting high attainers pales into insignificance.

There are precious few programmes that disproportionately support high attainers. One might cite BIS support for fair access and possibly DfE support for the Music and Dance Scheme. Most are ‘penny packages’ by comparison.

When the national gifted and talented programme was at its peak it also cost no more than £15m a year.

Viewed in this way, it is abundantly clear that low attainers continue to attract the lion’s share of educational funding and political attention. The distasteful medical analogy with which McInerney opens her piece is just plain wrong.

The simple reason is that substantial investment in high attainers is politically unacceptable.

Even though one could make a convincing case that the economic benefits of investing in the ‘smart fraction’ are broadly commensurate with those derived from shortening the ‘long tail’.

Of course we need to do both simultaneously. This is not a zero sum game.

.

Deficit model thinking

McInerney is engaged in deficit model thinking.

There is no substance to her suggestion that the government’s social mobility strategy is disproportionately focused on ‘making high court judges’. Take a look at the Social Mobility Indicators if you don’t believe me.

McInerney is dangerously close to suggesting that, because low attainers are predominantly disadvantaged, all disadvantaged learners are low attainers. Labour’s commitment is a sop for the middle classes. Nothing could be further from the truth.

But high-attaining learners from disadvantaged backgrounds will not succeed without the requisite support. They have an equal right to such support: they are not ‘the healthiest’, pushing in front of ‘the sickest’ low attainers. Equally, they should not be expected to go to the back of the queue.

There are powerful economic and equity arguments for ensuring that more learners from disadvantaged backgrounds progress to competitive universities and professional careers.

As and when more succeed, they serve as role models for younger learners, persuading them that they too can follow suit.

McInerney has made that journey personally so I find it hard to understand why she has fallen prey to anti-elitism.

Her criticism of Labour is sadly misplaced. She should be asking instead why other parties are not matching their commitment.

According to her there was a golden age under Blunkett ‘who really believed in helping all children, not mostly the smartest.’

Guess who was Secretary of State when Labour first offered support to gifted and talented learners?

He fully appreciated that the tail should not wag the dog.

[Postscript: Here is the Twitter debate that followed this post. Scroll down to the bottom and work upwards to read the discussion in broadly chronological order.]

.


GP

March 2015

The Politics of Selection: Grammar Schools and Disadvantage

This post considers how England’s selective schools are addressing socio-economic disadvantage.

Another irrelevant Norwegian vista by Gifted Phoenix

Another irrelevant Norwegian vista by Gifted Phoenix

It is intended as an evidence base against which to judge various political statements about the potential value of selective education as an engine of social mobility.

It does not deal with recent research reports about the historical record of grammar schools in this respect. These show that – contrary to received wisdom – selective education has had a very limited impact on social mobility.

Politicians of all parties would do well to acknowledge this, rather than attempting (as some do) to perpetuate the myth in defiance of the evidence.

This post concentrates instead on the current record of these schools, recent efforts to strengthen their capacity to support the Government’s gap closing strategy and prospects for the future.

It encourages advocates of increased selection to consider the wider question of how best to support high attainers from disadvantaged backgrounds.

The post is organised into four main sections:

  • A summary of how the main political parties view selection at this point, some six months ahead of a General Election.
  • A detailed profile of the socio-economic inclusiveness of grammar schools today, which draws heavily on published data but also includes findings from recent research.
  • An evaluation of national efforts over the last year to reform selective schools’ admissions, testing and outreach in support of high-attaining disadvantaged learners.
  • Comparison of the various policy options for closing excellence gaps between such learners and their more advantaged peers – and consideration of the role that reformed and/or increased selection might play in a more comprehensive strategy.

Since I know many readers prefer to read my lengthy posts selectively I have included page jumps from each of the bullet points above to the relevant sections below.

One more preliminary point.

This is the second time I have explored selection on this Blog, though my previous post, on fair access to grammar schools, appeared as far back as January 2011. This post updates some of the data in the earlier one.

One purpose of that earlier post was to draw attention to the parallels in the debates about fair access to grammar schools and to selective higher education.

I do not repeat those arguments here, although writing this has confirmed my opinion that they are closely related issues and that many of the strategies deployed at one level could be applied equally at the other.

So there remains scope to explore how appropriate equivalents of Offa, access agreements, bursaries and contexualised admissions might be applied to selective secondary admissions arrangements, alongside the reforms that are already on the table. I leave that thought hanging.

.

The Political Context

My last post on ‘The Politics of Setting’ explored how political debate surrounding within-school and between-school selection is becoming increasingly febrile as we approach the 2015 General Election.

The two have become inextricably linked because Prime Minister Cameron, in deciding not to accommodate calls on the right of his party to increase the number of selective schools, has called instead for ‘a grammar stream in every school’ and, latterly, for a wider – perhaps universal – commitment to setting.

In May 2007, Cameron wrote:

‘That’s what the grammar school row was about: moving the Conservative Party on from slogans such as ‘Bring back grammar schools’ so that we can offer serious policies for improving state education for everyone…

…Most critics seem to accept, when pressed, that as I have said, the prospect of more grammars is not practical politics.

Conservative governments in the past – and Conservative councils in the present – have both failed to carry out this policy because, ultimately, it is not what parents want….

…When I say I oppose nationwide selection by 11 between schools, that does not mean I oppose selection by academic ability altogether.

Quite the reverse. I am passionate about the importance of setting by ability within schools, so that we stretch the brightest kids and help those in danger of being left behind.’

With a Conservative Government this would be a motor of aspiration for the brightest kids from the poorest homes – effectively a ‘grammar stream’ in every subject in every school.

Setting would be a focus for Ofsted and a priority for all new academies.’

As ‘The Politics of Setting’ explained, this alternative aspiration to strengthen within-school selection has not yet materialised, although there are strong signs that it is still Cameron’s preferred way forward.

The Coalition has been clear that:

‘It is not the policy of the Government to establish new grammar schools in England’ (Hansard, 10 February 2014, Col. 427W).

but it has also:

  • Removed barriers to the expansion of existing grammar schools through increases to planned admission numbers (PANs) within the Admissions Code.
  • Introduced several new selective post-16 institutions through the free schools policy (though not as many as originally envisaged since the maths free schools project has made relatively little progress).
  • Made efforts to reform the admissions procedures of existing selective secondary schools and
  • Accepted in principle that these existing schools might also expand through annexes, or satellite schools. This is now a live issue since one decision is pending and a second proposal may be in the pipeline.

The Liberal Democrats have enthusiastically pursued at least the third of these policies, with Lib Dem education minister David Laws leading the Government’s efforts to push the grammar schools further and faster down this route.

In his June 2014 speech (of which much more below) Laws describes grammar schools as ‘a significant feature of the landscape in many local areas’ and ‘an established fact of our education system’.

But, as the Election approaches, the Lib Dems are increasingly distancing themselves from a pro-selective stance.

Clegg is reported to have said recently that he did not believe selective schools were the way forward:

‘The Conservatives have got this odd tendency to constantly want to turn the clock back.

Some of them seem to be hankering towards a kind of selective approach to education, which I don’t think works.

Non-selective schools stream and a lot of them stream quite forcefully, that’s all fine, but I think a segregated school system is not what this country needs.’

Leaving aside the odd endorsement of ‘forceful streaming’, this could even be interpreted as hostile to existing grammar schools.

Meanwhile, both frontrunners to replace Cameron as Tory leader have recently restated their pro-grammar school credentials:

  • Constituency MP Teresa May has welcomed consideration of the satellite option in Maidenhead.

The right wing of the Tory party has long supported increased selection and will become increasingly vociferous as the Election approaches.

Conservative Voice – which describes itself as on the ‘center-Right of the party’ [sic] – will imminently launch a campaign calling for removal of the ban on new grammar schools to be included in the Conservative Election Manifesto.

They have already conducted a survey to inform the campaign, from which it is clear that they will be playing the social mobility card.

The Conservative right is acutely aware of the election threat posed by UKIP, which has already stated its policy that:

‘Existing schools will be allowed to apply to become grammar schools and select according to ability and aptitude. Selection ages will be flexible and determined by the school in consultation with the local authority.’

Its leader has spoken of ‘a grammar school in every town’ and media commentators have begun to suggest that the Tories will lose votes to UKIP on this issue.

Labour’s previous shadow education minister, Stephen Twigg, opposed admissions code reforms that made it easier for existing grammar schools to expand.

But the present incumbent has said very little on the subject.

A newspaper interview in January 2014 hints at a reforming policy:

‘Labour would not shut surviving grammar schools but Mr Hunt said their social mix should be questioned.

“If they are simply about merit why do we see the kind of demographics and class make-up within them?”’

But it seems that this has dropped off Labour’s agenda now that the Coalition has adopted it.

I could find no formal commitment from Labour to address the issue in government, even though that might provide some sort of palliative for those within the party who oppose selection in all its forms and have suggested that funding should be withdrawn from selective academies.

So the overall picture suggests that Labour and the Lib Dems are deliberately distancing themselves from any active policy on selection, presumably regarding it as a poisoned chalice. The Tories are conspicuously riven on the issue, while UKIP has stolen a march by occupying the ground which the Tory right would like to occupy.

As the Election approaches, the Conservatives face four broad choices. They can:

  • Endorse the status quo under the Coalition, making any change of policy conditional on the outcome of a future leadership contest.
  • Advocate more between-school selection. This might or might not stop short of permitting new selective 11-18 secondary schools. Any such policy needs to be distinct from UKIP’s.
  • Advocate more within-school selection, as preferred by Cameron. This might adopt any position between encouragement and compulsion.
  • Develop a more comprehensive support strategy for high attaining learners from disadvantaged backgrounds. This might include any or all of the above, but should also consider support targeted directly at disadvantaged students.

These options are discussed in the final part of the post.

The next section provides an assessment of the current state of selective school engagement with disadvantaged learners, as a precursor to describing how the reform programme is shaping up.

.

How well do grammar schools serve disadvantaged students?

.

The Grammar School Stock and the Size of the Selective Pupil Population

Government statistics show that, as of January 2014, there are 163 selective state-funded secondary schools in England.

This is one less than previously, following the merger of Chatham House Grammar School for Boys and Clarendon House Grammar School. These two Kent schools formed the Chatham and Clarendon Grammar School with effect from 1 September 2013.

At January 2014:

  • 135 of these 163 schools (83%) are academy converters, leaving just 28 in local authority control. Twenty of the schools (12%) have a religious character.
  • Some 5.1% of pupils in state-funded schools attend selective schools. (The percentage fluctuated between 4% and 5% over the last 20 years.) The percentage of learners under 16 attending selective schools is lower. Between 2007 and 2011 it was 3.9% to 4.0%.
  • There are 162,630 pupils of all ages attending state-funded selective secondary schools, of which 135,365 (83.2%) attend academies and 27,265 (16.8%) attend LA maintained schools. This represents an increase of 1,000 compared with 2013. The annual intake is around 22,000.

The distribution of selective schools between regions and local authority areas is shown in Table 1 below.

The percentage of selective school pupils by region varies from 12.0% in the South East to zero in the North East, a grammar-free zone. The percentage of pupils attending selective schools by local authority area (counting only those with at least one selective school) varies from 45.1% in Trafford to 2.1% in Devon.

Some of the percentages at the upper end of this range seem to have increased significantly since May 2011, although the two sets of figures may not be exactly comparable.

For example, the proportion of Trafford pupils attending selective schools has increased by almost 5% (from 40.2% in 2011). In Torbay there has been an increase of over 4% (34.8% compared with 30.5%) and in Kent an increase of almost 4% (33.3% compared with 29.6%).

.

Table 1: The distribution of selective schools by region and local authority area and the percentage of pupils within each authority attending them (January 2014)

Region Schools Pupils Percentage of all pupils
North East 0 0 0
North West 19 20,240 4.9
Cumbria 1 833 2.8
Lancashire 4 4,424 6.6
Liverpool 1 988 3.3
Trafford 7 7,450 45.1
Wirral 6 6,547 30.5
Yorkshire and Humberside 6 6,055 1.9
Calderdale 2 2,217 14.2
Kirklees 1 1,383 5.5
North Yorkshire 3 2,454 6.5
East Midlands 15 12,700 4.5
Lincolnshire 15 12,699 26.9
West Midlands 19 15,865 4.5
Birmingham 8 7,350 10.4
Stoke-on-Trent 1 1,078 8.7
Telford and Wrekin 2 1,283 11.7
Walsall 2 1,423 7.0
Warwickshire 5 3,980 12.0
Wolverhampton 1 753 5.0
East of England 8 7,715 2.1
Essex 4 3,398 4.0
Southend-on-Sea 4 4,319 32.8
London 19 20,770 4.4
Barnet 3 2,643 11.6
Bexley 4 5,466 26.6
Bromley 2 1,997 9.0
Enfield 1 1,378 6.1
Kingston upon Thames 2 2,021 20.5
Redbridge 2 1,822 7.9
Sutton 5 5,445 30.7
South East 57 59,910 12.0
Buckinghamshire 13 15,288 42.2
Kent 32 33,059 33.3
Medway 6 6,031 32.2
Reading 2 1,632 24.1
Slough 4 3,899 37.4
South West 20 19,370 6.2
Bournemouth 2 2,245 23.3
Devon 1 822 2.1
Gloucestershire 7 6,196 16.2
Plymouth 3 2,780 16.3
Poole 2 2,442 26.8
Torbay 3 2,976 34.8
Wiltshire 2 1,928 6.6
TOTAL 163 162,630 5.1

.

Some authorities are deemed wholly selective but different definitions have been adopted.

One PQ reply suggests that 10 of the 36 local authority areas – Bexley, Buckinghamshire, Kent, Lincolnshire, Medway, Slough, Southend, Sutton, Torbay and Trafford – are deemed wholly selective because they feature in the Education (Grammar School Ballots) Regulations 1998.

Another authoritative source – the House of Commons Library – omits Bexley, Lincolnshire and Sutton from this list, presumably because they also contain comprehensive schools.

Of course many learners who attend grammar schools live in local authority areas other than those in which their schools are located. Many travel significant distances to attend.

A PQ reply from March 2012 states that some 76.6% of all those attending grammar schools live in the same local authority as their school, while 23.2% live outside. (The remainder are ‘unknowns’.)

These figures mask substantial variation between authorities. A recent study, for the Sutton Trust  ‘Entry into Grammar Schools in England’ (Cribb et al, 2013) provides equivalent figures for each local authority from 2009-10 to 2011-12.

The percentage of within authority admissions reaches 38.5% in Trafford and 36% in Buckinghamshire but, at the other extreme, it can be as low as 1.7% in Devon and 2.2% in Cumbria.

The percentage of admissions from outside the authority can be as much as 75% (Reading) and 68% (Kingston) or, alternatively, as low as 4.5% in Gloucestershire and 6.8% in Kent.

.

Recent Trends in the Size and Distribution of the Disadvantaged Grammar School Pupil Population

Although this section of the post is intended to describe the ‘present state’, I wanted to illustrate how that compares with the relatively recent past.

I attached to my 2011 post a table showing how the proportion of FSM students attending grammar schools had changed annually since 1995. This is reproduced below, updated to reflect more recent data where it is available

A health warning is attached since the figures were derived from several different PQ replies and I cannot be sure that the assumptions underpinning each were identical. Where there are known methodological differences I have described these in the footnotes.

.

Table 2: Annual percentage FSM in all grammar schools and gap between that and percentage FSM in all secondary schools, 1995-2013

Year PercentageFSM in GS Percentage FSMall schools Percentagepoint Gap
1995 3.9 18.0 14.1
1996 3.8 18.3 14.5
1997 3.7 18.2 14.5
1998 3.4 17.5 14.1
1999 3.1 16.9 13.8
2000 2.8 16.5 13.7
2001 2.4 15.8 13.4
2002 2.2 14.9 12.7
2003 2.1 14.5 12.4
2004 2.2 14.3 12.1
2005 2.1 14.0 11.9
2006 2.2 14.6 12.4
2007 2.0 13.1 11.1
2008 1.9 12.8 10.9
2009 2.0 13.4 11.4
2010 15.4
2011 2.4 14.6 12.2
2012 14.8
2013 15.1
2014 14.6

(1) Prior to 2003 includes dually registered pupils and excludes boarding pupils; from 2003 onwards includes dually registered and boarding pupils.

(2) Before 2002 numbers of pupils eligible for free school meals were collected at school level. From 2002 onwards numbers have been derived from pupil level returns.

(3) 2008 and 2009 figures for all schools exclude academies

.

Between 1996 and 2005 the FSM rate in all schools fell annually, dropping by 4.3 percentage points over that period. The FSM rate in grammar schools also fell, by 1.7 percentage points. The percentage point gap between all schools and selective schools fell by 2.6 percentage points.

Both FSM rates reached their lowest point in 2008. At that point the FSM rate in grammar schools was half what it had been in 1996. Thereafter, the rate across all schools increased, but has been rather more volatile, with small swings in either direction.

One might expect the 2014 FSM rate across all grammar schools to be at or around its 2011 level of 2.4%.

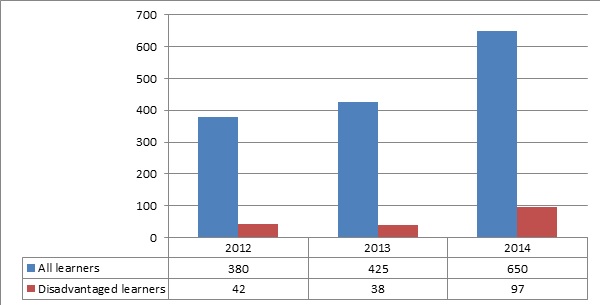
A more recent PQ reply revealed the total number of pupil premium recipients attending selective schools over the last three financial years:

  • FY2011-12 – 3,013
  • FY2012-13 – 6,184 (on extension to ‘ever 6’)
  • FY2013-14 – 7,353

(Hansard 20 January 2014, Col. WA88)

This suggests a trend of increasing participation in the sector, though total numbers are still very low, averaging around 45 per school and slightly over six per year group.

.

Comparison with FSM rates in selective authorities

In 2012, a table deposited in the Commons Library (Dep 2012-0432) in response to a PQ provided the January 2011 FSM rates for selective schools and all state-funded secondary schools in each authority containing selective schools.

In this case, the FSM rates provided relate only to pupils aged 15 or under. The comparable national average rates are 2.7% for selective schools and 15.9% for all state-funded schools.

  • Selective school FSM rates per authority vary between 6.0% in Birmingham and 0.6% in Wiltshire.
  • Other authorities with particularly low FSM rates include Bromley (0.7%), Reading (0.8%) and Essex (0.9%).
  • Authorities with relatively high FSM rates include Wirral (5.2%), Walsall (4.9) and Redbridge (4.8%).
  • The authorities with the biggest gaps between FSM rates for selective schools and all schools are Birmingham, at 28.0 percentage points, Liverpool, at 23.8 percentage points, Enfield at 21.8 percentage points and Wolverhampton, at 21.7 percentage points.
  • Conversely, Buckinghamshire has a gap of only 4.7 percentage points, since its FSM rate for all state-funded secondary schools is only 6.0%.
  • Buckinghamshire’s overall FSM rate is more than four times the rate in its grammar schools, while in Birmingham the overall rate is almost six times the grammar school rate. On this measure, the disparity is greatest in metropolitan boroughs with significant areas of disadvantage.

.

Proportion of disadvantaged learners in each selective school

I attached to my 2011 post a table setting out the FSM rates (all pupils, regardless of age) for each selective school in January 2009.

This updated version sets out the January 2013 FSM and disadvantaged (ie ‘ever 6 FSM’) rates by school, drawn from the latest School Performance Tables. (Click on the screenshot below to download the Excel file.)

.

GS excel Capture

.

Key points include:

  • The size of grammar schools varies considerably, with NORs ranging from 437 (Newport Girls’) to 1518 (Townley Girls’). The average NOR is slightly below 1000.
  • 24 of the 163 schools (14.7%) have suppressed FSM percentages. Since the lowest published percentage is 1.1%, the impact of suppression is that all schools at or below 1.0% are affected. Since no school returns 0, we must assume that all contain a handful of FSM learners. It is notable that six of these schools are in Buckinghamshire, three in Gloucestershire and three in Essex. Both Bromley grammar schools also fall into this category.
  • 67 selective schools (41.1%) have FSM rates of 2% or lower. The average FSM rate across all these schools is 3.25%.
  • The highest recorded FSM rates are at Handsworth Grammar School (14.4%), King Edward VI Aston School (12.9%) and Stretford Grammar School (12%). These three are significant outliers – the next highest rate is 7.8%.
  • As one would expect, there is a strong correlation between FSM rates and ‘ever 6’ rates. Most of the schools with the lowest ‘ever 6’ rates are those with SUPP FSM rates. Of the 26 schools returning ‘ever 6’ rates of 3.0% or lower, all but 7 fall into this category.
  • The lowest ‘ever 6’ rate is the 0.6% returned by Sir William Borlase’s Grammar School in Buckinghamshire. On this evidence it is probably the most socio-economically selective grammar school in the country. Five of the ten schools with the lowest ‘ever 6’ rates are located in Buckinghamshire.
  • A few schools have FSM and ‘ever 6’ rates that do not correlate strongly. The most pronounced is Ribston Hall in Gloucestershire which is SUPP for FSM yet has an ‘ever 6’ rate of 5.5%, not far short of the grammar school average which is some 6.6%. Clitheroe Royal Grammar School is another outlier, returning an ‘ever 6’ rate of 4.8%.
  • The highest ‘ever 6’ rates are in Handsworth Grammar School (27.2%), Stretford Grammar School (24.3%) and King Edward VI Aston School (20.3%). These are the only three above 20%.
  • In London there is a fairly broad range of socio-economic selectivity, from St Olave’s and St Saviour’s (Bromley) – which records an ‘ever 6’ rate of 2.5% – to Woodford County High School, Redbridge, where the ‘ever 6’ rate is 11%. As noted above, the FSM rates at the two Bromley schools are SUPP. The London school with the highest FSM rate is again Woodford County High, at 5%.

Another source throws further light on the schools with the lowest FSM rates. In October 2013, a PQ reply provided a table of the 50 state secondary schools in England with the lowest entitlement to FSM, alongside a second table of the 50 schools with the highest entitlement.

These are again January 2013 figures but on this occasion the rates are for pupils aged 15 or under and the only figures suppressed (denoted by ‘x’) are where no more than two pupils are FSM.

Sir William Borlase’s tops the list, being the only school in the country with a nil return (so the one or two FSM pupils who attend must be aged over 15 and may have been admitted directly to the sixth form).

The remainder of the ‘top ten’ includes eight selective schools and one comprehensive (Old Swinford Hospital School in Dudley). The eight grammar schools are:

  • Cranbrook, Kent – x
  • Adams’, Telford and Wrekin – x
  • St Olave’s and St Saviour’s, Bromley – 0.5%
  • Dr Challoner’s High Buckinghamshire – 0.5%
  • Dr Challoner’s Grammar, Buckinghamshire – 0.6%
  • Aylesbury Grammar, Buckinghamshire – 0.6%
  • Newstead Wood, Bromley – 0.6%
  • Pate’s, Gloucestershire – 0.6%

Comparing the data in my tables for 2009 and 2013 also throws up some interesting facts:

  • Some schools have increased significantly in size – Burnham Grammar School (Buckinghamshire), Sir Thomas Rich’s (Gloucestershire), Highworth Grammar School for Girls (Kent), Simon Langton Grammar School for Boys (Kent), Kesteven and Grantham Girls’ School (Lincolnshire), Carre’s Grammar School (Lincolnshire) and St Joseph’s College (Stoke) have all increased their NORs by 100 or more.
  • However, some other schools have shrunk significantly, notably The Skegness Grammar School in Lincolnshire (down 129), The Boston Grammar School in Lincolnshire (down 110), Fort Pitt Grammar School in Medway (down 132) and Slough Grammar School (down 175).
  • While recognising that the figures may not be fully comparable, there have also been some significant changes in the proportions of FSM pupils on roll. Significant increases are evident at King Edward VI Aston (up 5.9 percentage points), Fort Pitt (up 5.1 percentage points) and Handsworth Grammar (up 4.7 percentage points).
  • The only equally pronounced mover in the opposite direction is St Anselm’s College on The Wirral, where the FSM rate has more than halved, falling by 5.2 percentage points, from 9.8% to 4.6%.

Additional statistics were peppered throughout David Laws’ June 2014 speech.

He refers to a paper by DfE analysts which unfortunately has not been published:

  • In 2013, 21 grammar schools had fewer than 1% of pupils eligible for FSM. Ninety-eight had fewer than 3% eligible and 161 had fewer than 10% eligible. This compares to a national average of 16.3% across England. (The basis for these figures is not supplied but they more or less agree with those above.)
  • In Buckinghamshire in 2011, 14% of the year 7 cohort were eligible for the pupil premium, but only 4% of the cohort in Buckinghamshire grammar schools were eligible. In Lincolnshire the comparable percentages were 21% and 7% respectively.

.

Selectivity

Most commentary tends to regard the cadre of selective schools as very similar in character, leaving aside any religious affiliation and the fact that many are single sex establishments.

Although the fact is rarely discussed, some grammar schools are significantly more selective than others.

The 2013 Secondary Performance Tables show that only 10 grammar schools can claim that 100% of the cohort comprises high attainers. (These are defined on the basis of performance in statutory end of KS2 tests, in which they must record an APS of 30 or more across English, maths and science.)

At several schools – Clarendon House (Kent, now merged), Fort Pitt (Medway), Skegness (Lincolnshire), Dover Boys’ and Girls’ (Kent), Folkestone Girls’ (Kent), St Joseph’s (Stoke), Boston High (Lincolnshire) and the Harvey School (Kent) – the proportion of high attainers stands at 70% or below.

Many comprehensive schools comfortably exceed this, hence – when it comes to KS2 attainment – some comprehensives are more selective than some grammar schools.

Key variables determining a grammar school’s selectivity will include:

  • The overall number of pupils in the area served by the school and/or the maximum geographical distance that pupils may travel to it.
  • The number of pupils who take the entrance tests, including the proportion of pupils attending independent schools competing for admission.
  • The number of competing selective schools and high-performing comprehensive schools, plus the proportion of learners who remain in or are ‘siphoned off’ into the independent sector.
  • The number of places available at the school and the pass mark in the entrance tests.

I have been unable to locate any meaningful measure of the relative selectivity of grammar schools, yet this is bound to impact on the admission of disadvantaged learners.

An index of selectivity would improve efforts to compare more fairly the outcomes achieved by different grammar schools, including their records on access for disadvantaged learners.

.

Prior attainment data

In his June 2014 speech, Laws acknowledges that:

  • ‘A key barrier is the low level of free school meal pupils achieving level 5, typically a proxy for pupils you admit’.
  • However, in wholly selective areas fewer than 50% of FSM learners achieving Level 5 enter selective schools compared with two-thirds of non-FSM pupils:

‘We calculated it would require a shift of just 200 level 5 FSM pupils to go into grammar schools in wholly selective areas to remove this particular bias ‘

Alternative versions of this statement appear elsewhere, as we shall see below.

Using data from 2009/10 and 2011/12, the Sutton Trust study by Cribb et al explored whether advantaged and disadvantaged pupils with KS2 level 5 in both English and maths were equally likely to attend grammar schools.

They found that those not eligible for FSM are still more likely to attend. This applies regardless of whether the grammar school is located in a selective local authority, although the percentages and the gaps vary considerably.

  • In selective authorities, some 66% of these high attaining non-FSM pupils went on to grammar schools compared with under 40% of FSM pupils, giving a gap of over 26 percentage points. (Note that the percentage for FSM is ten percentage points lower than the one quoted by Laws. I can find no reason for this disparity, unless the percentage has changed dramatically since 2012.)
  • In isolated grammar schools outside London the gap is much smaller, at roughly 11 percentage points (18% non-FSM against 7% FSM).
  • In London there is a similar 12 percentage point gap (15% non-FSM versus 3% FSM)


Cribb Capture 1

A similar pattern is detected on the basis of KS2 maths test fine points scores:

‘Two points are evident. First, for any given level of maths attainment, pupils who are eligible for FSM have a noticeably lower probability of attending a grammar school. Indeed, a non-FSM student with an average maths score has the same probability of entering a grammar school as an FSM pupil with a score 0.7 standard deviations above average. Second, the gap in probability of attendance between FSM and non-FSM pupils actually widens substantially: non-FSM pupils with test scores one standard deviation above average have a 55% likelihood of attending a grammar school in selective local authorities, whereas similar pupils who are eligible for FSM have only a 30% chance of attending a grammar school. This is suggestive that bright pupils from deprived families are not attending grammar schools as much as their attainment would suggest they might.’

This rather calls into question Laws’ initial statement that level 5 performance among FSM pupils is ‘a key barrier’ to admission.

The study also confirms that pupils attending primary schools with relatively high levels of deprivation are much less likely to progress to grammar schools.

On the other hand, some 13% of pupils nationally transfer into selective schools from non-state schools and schools outside England. The researchers are unable to distinguish clearly those from abroad and those from the independent sector, but note that they are typically wealthier than state school transfers.

This masks significant variation between local authority areas.

Almost 34% of such pupils transfer in to grammar schools in Essex, as do 24% in Bromley, 23% in Wiltshire and 22% in Bournemouth and Southend. At the other extreme, only 6% are incomers in Kirklees.

.

Headteacher perceptions

The Sutton Trust released a parallel research report from NATCEN reporting the outcomes of interviews with a small sample of three primary school and eight grammar school headteachers.

The researchers found that:

  • Rightly or wrongly, many heads felt disadvantaged learners had relatively lower educational aspirations.
  • Disadvantaged parents were sometimes perceived to know less about grammar schools and place less value on the benefits they might confer.
  • Heads felt disadvantaged parents ‘often associated grammar schools with tradition, middle class values and elitism’. Parents felt their children ‘might struggle interacting with children from more affluent backgrounds’.
  • Grammar school heads highlighted the role of primary schools but ‘this was difficult when primary schools disagreed with assessment based entry processes and selective education in general’.
  • Heads felt grammar schools should provide more outreach and demonstrate their openness to everyone. It was suggested that, as grammar schools increasingly take in pupils from further away and/or from independent schools, this might further distance schools from their local communities.
  • It was widely acknowledged that learners from more advantaged backgrounds were coached to pass the entrance exams. Some grammar heads regarded tutoring as ‘good examination preparation’; others recognised it as a barrier for disadvantaged learners.
  • Although there are financial barriers to accessing grammar schools, including the cost of uniforms and school trips, grammar school heads claimed to deploy a variety of support strategies.

Overall

The preceding analysis is complex and difficult to synthesise into a few key messages, but here is my best effort.

The national figures show that, taken as a whole, the 163 grammar schools contain extremely low proportions of FSM-eligible and ‘ever 6’ learners.

National FSM rates across all grammar schools have fallen significantly over the past 20 years and, although the FSM gap between selective schools and all schools has narrowed a little, it is still very pronounced.

There is certainly a strong case for concerted action to reduce significantly the size of this gap and to strive towards parity.

The disparity is no doubt partly attributable to lower rates of high attainment at KS2 amongst disadvantaged learners, but high attaining disadvantaged learners are themselves significantly under-represented. This is particularly true of wholly selective authorities but also applies nationally.

Although the sample is small, the evidence suggests that grammar school and primary head teachers share the perception that disadvantaged learners are further disadvantaged by the selective admissions process.

However, the cadre of grammar schools is a very broad church. The schools are very different and operate in markedly different contexts. Some are super-selective while others are less selective than some comprehensive schools.

A handful have relatively high levels of FSM and ‘ever-6’ admissions but a significant minority have almost negligible numbers of disadvantaged learners. Although contextual factors influence FSM and ‘ever 6’ rates significantly, there are still marked disparities which cannot be explained by such factors.

Each school faces a slightly different challenge.

Transparency and public understanding would be considerably improved by the publication of statistical information showing how grammar schools differ when assessed against a set of key indicators – and identifying clear improvement targets for each school. 

There seem to me to be strong grounds for incorporating schools’ performance against such targets into Ofsted’s inspection regime.

.

Progress Towards Reform

.

The Sutton Trust Research

Although the Grammar School Heads’ Association (GSHA) argues that it has pursued reform internally for some years, a much wider-ranging initiative has developed over the last twelve months, kicked off by the publication of a tranche of research by the Sutton Trust in November 2013.

This included the two publications, by Cribb et al and NATCEN cited above, plus a third piece by Jesson.

There was also an overarching summary report ‘Poor Grammar: Entry into Grammar Schools for disadvantaged pupils in England’.

This made six recommendations which, taken together, cover the full spectrum of action required to strengthen the schools’ capacity to admit more disadvantaged learners:

  • Review selection tests to ensure they are not a barrier to the admission of learners from disadvantaged backgrounds. The text remarks that:

‘Some grammar schools and local authorities are already trying to develop tests which are regularly changed, less susceptible to coaching, intelligence-based and not culturally biased.’

  • Reduce the advantage obtained by those who can pay for private tuition by making available a minimum of ten hours of test preparation to all applicants on a free or subsidised basis.
  • Improve grammar school outreach support, targeting learners from low and middle income backgrounds. This should include: assurances on access to transport and support with other costs; active encouragement for suitable Pupil Premium recipients to apply; using the media to dispel notions that grammar schools are exclusive and elitist; and deploying existing disadvantaged students as ambassadors.
  • Using the flexibility within the Admissions Code (at this point available only to academies) to prioritise the admission of high achieving students who are entitled to the pupil premium. There is also a suggestion that schools might: 

‘…consider giving preference to students from low or middle income households who reach a minimum threshold in the admission test’.

though it is not clear how this would comply with the Code.

  • Develop primary-grammar school partnerships to provide transition support for disadvantaged students, enabling primary schools to provide stronger encouragement for applications and reassure parents.
  • Develop partnerships with non-selective secondary schools:

‘…to ensure that high achieving students from low and middle income backgrounds have access to good local teachers in their areas.’

The Sutton Trust also made its own commitment to:

‘…look at ways that we can support innovation in improved testing, test preparation, outreach, admissions and collaboration.

We will also commission independent analysis of the impact of any such programmes to create an evidence base to enhance fair access to grammar schools.’

.

Reaction

Immediate reaction was predictably polarised. The GSHA was unhappy with the presentation of the report.

Its November 2013 Newsletter grumbles:

‘It is the way in which the research is presented by the Sutton Trust rather than any of research findings that give rise to concerns. Through a process of statistical machination the press release chose to lead on the claim that 6% of prep school pupils provide four times more grammar school pupils than the 16% of FSM eligible children. Inevitably, this led to headlines that the independent sector dominates admissions. The reality, of course is that 88% of all grammar school students come from state primary schools….

….Grammars select on ability and only 10% of FSM children reach level 5 at KS2 compared with a national average of 25%. The report, quite reasonably, uses level 5 as the indicator of grammar school potential. On the basis of this data the proportions of eligible FSM children in grammar schools is significantly greater than the overall FSM proportion in the top 500 comprehensives….

In 2012 just over 500 FSM children entered grammar schools. For the success rate of L5 FSM to match that of other L5 would require 200 more FSM children a year to enter grammar schools. Just one more in each school would virtually close the gap….

….The recommendations of the report are not, as claimed, either new or radical. All are areas that had already been identified by GSHA as options to aid access and represent practices that are already adopted by schools. This work, however, is usually carefully presented to avoid promotion of a coaching culture.

It is unfortunate that the press briefing both contributed to reinforcing the false stereotyping of grammar schools and failed to signal initiatives taken by grammar schools.’

There is evidence here of retaliatory ‘statistical machination’, together with a rather defensive attitude that may not bode well for the future.

On the other hand HMCI Wilshaw was characteristically forthright in the expression of an almost diametrically opposite opinion.

In December 2013 he is reported to have said:

‘Grammar schools are stuffed full of middle-class kids. A tiny percentage are on free school meals: 3%. That is a nonsense.

Anyone who thinks grammar schools are going to increase social mobility needs to look at those figures. I don’t think they work. The fact of the matter is that there will be calls for a return to the grammar school system. Well, look what is happening at the moment. Northern Ireland has a selective system and they did worse than us in the [international comparison] table. The grammar schools might do well with 10% of the school population, but everyone else does really badly. What we have to do is make sure all schools do well in the areas in which they are located.’

 .

The Laws Speech

Liberal Democrat Education Minister David Laws made clear the Government’s interest in reform with his June 2014 speech, already referenced above.

Early on in the speech he remarks that:

‘The debate about grammar schools seems to have been put in the political deep freeze – with no plans either to increase or reduce the number of what are extremely popular schools in their localities.’

With the benefit of hindsight, this seems rather ignorant of (or else disrespectful to) UKIP, which had nailed their colours to the mast just three weeks previously.

Laws acknowledges the challenge thrown down by Wilshaw, though without attribution:

‘Are you, as some would have it, “stuffed full of middle-class kids”?

Or are you opening up opportunities to all bright children regardless of their background, or can you do more?

Why is entry to grammar schools so often maligned?’

He says he wants to work with them ‘openly and constructively on social mobility’, to ‘consider what greater role they can play in breaking the cycles of disadvantage and closing the opportunity gap’, while accepting that the Government and the primary sector must also play their parts.

He suggests that the Government will do more to increase the supply of high attaining disadvantaged learners:

‘…a key barrier is the low level of free school meal pupils achieving level 5, typically a proxy for pupils you admit. So this is not just a challenge for grammar schools, but for the whole education system…

….My promise to you, alongside my challenge to you, is that this government will do everything in its power to make sure that more children from poorer backgrounds achieve their full potential.’

He lists the policies that:

‘Taken together, and over time…will start to shift the dial for poorer children – so that more and more reach level 5’

leading of course with the pupil premium.

He also proposes aspirational targets, though without any timescale attached:

My ambition is that all selective schools should aim for the same proportion of children on free school meals in their schools as in their local area.

This would mean an additional 3,500 free school meal pupils in selective schools every year, or an additional 35,000 pupils over 10 years.’

In relation to the flexibilities in the Admissions Code he adds:

I am pleased to be able to say that 32 grammar schools have implemented an admissions priority for pupils eligible for free school meals this year….

We in the Department for Education will fully support any school that chooses to change its admissions criteria in this way – in fact, I want to see all grammar schools give preference to pupil premium pupils over the next few years.’

Similarly, on coaching and testing:

‘…I really welcome the association’s work to encourage a move to entry tests that are less susceptible to coaching, and I am heartened to hear that at least 40% of grammar schools are now moving to the introduction of coaching resistant tests.

Again, I hope that all grammar schools will soon do so, and it will be interesting to see the impact of this.’

And he adds:

I want all schools to build on the progress that is being made and seek to close the gap by increasing parental engagement, and stronger working with local primaries – with a focus on identifying potential.’

So he overtly endorses several of the recommendations proposed by the Sutton Trust seven months earlier.

A Sutton Trust press release:

‘…welcomed the commitment by Schools Minister David Laws, to widening access to grammar schools and making the issue a priority in government’.

This may be a little over-optimistic.

A Collaborative Project Takes Shape

Laws also mentions in his speech that:

‘The GSHA will be working with us, the Sutton Trust and the University of Durham to explore ways in which access to grammar schools by highly able deprived children might be improved by looking more closely at the testing process and what may be limiting the engagement of pupils with it.’

The associated release from the Sutton Trust uses the present tense:

‘The Trust is currently working with the King Edward VI Foundation, which runs five grammar schools in Birmingham, Durham University, the Grammar School Heads Association and the Department for Education to target and evaluate the most effective strategies to broaden access to grammar schools.

A range of initiatives being run by the Foundation, including test familiarisation sessions at community locations, visits from primary schools and support for numeracy and literacy teaching for gifted and talented children at local primary schools, will be evaluated by Durham University to understand and compare their impact. The resulting analysis will provide a template for other grammar schools to work with.’

We know that Laws had been discussing these issues with the grammar schools for some time.

When he appeared before the Education Select Committee in February 2014 he said:

‘We are trying, for example, to talk to grammar schools about giving young people fairer access opportunities into those schools.  We are trying to allow them to use the pupil premium as a factor in their admissions policy.  We are trying to encourage them to ensure that testing is fairer to young people and is not just coachable. ‘

The repetition of ‘trying’ might suggest some reluctance on the part of grammar school representatives to engage on these issues.

Yet press coverage suggested the discussions were ongoing. In May the GSHA Newsletter states that it had first met Laws to discuss admissions some eighteen months previously, so perhaps as early as November 2012.

It adds:

‘We are currently working on a research project with the DfE and the Sutton Trust to try to find out what practices help to reduce barriers to access for those parents and students from deprived backgrounds.’

A parallel report in another paper comments:

‘The grammar school heads have also gone into partnership with the education charity the Sutton Trust to support more able children from middle and lower income backgrounds applying to selective schools.

Other ideas being considered include putting on test familiarisation sessions for disadvantaged children – something they have missed out on in the past.’

While an entry on CEM’s website says:

‘Access Grammar:

This project seeks to look at ways access to grammar schools for highly able children from non-privileged backgrounds can be improved. The project will identify potential target cohorts in the study areas for a range of outreach interventions and will look to evaluate these activities. For this project, the CEM Research and Evaluation team are working in collaboration with the Sutton Trust, Grammar School Heads Association, King Edwards Foundation and the Department for Education.

Start date: January 2014
End date: January 2017.’

So we know that there is a five-way partnership engaged on a three year project, The various statements describing the project’s objectives are all slightly different, although there is a clear resemblance between them, the aims articulated by Laws and the recommendations set out by the Sutton Trust.

But I searched in vain for any more detailed specification, including key milestones, funding and intended outcomes. It is not clear whether the taxpayer is contributing through DfE funding, or whether the Sutton Trust  and/or other partners are meeting the cost.

Given that we are almost a year into the programme, there is a strong case for this material to be made public.

.

Progress on Admissions Criteria

Of the issues mentioned in the Sutton Trust’s recommendations – tests and test preparation, admissions flexibility, outreach and partnership with primary and non-selective secondary schools – those at the front of the list have been most prominent (though there is also evidence that the King Edward’s Foundation is pursuing reform across a wider front).

The GSHA’s May 2014 newsletter is less grumpy than its predecessor, but still strikes a rather defensive note.

It uses a now familiar statistic, but in a slightly different fashion:

‘The actual number of students with Level 5s in their SATs who either choose not to apply to a grammar school or who apply but do not receive a place is reckoned by GSHA and the DfE to be two hundred students a year; not the very large number that the percentages originally suggested.’

This is the third time we have encountered this particular assertion, but each time it has been articulated differently. Which of the three statements is correct?

The GSHA is also keen to emphasise that progress is being made independently through its own good offices. On admissions reform, the article says:

‘A significant number of schools 38 have either adopted an FSM priority or consulted about doing so in the last admissions round. A further 59 are considering doing so in the next admissions round.’

The GHSA was also quoted in the TES, to the effect that 30 grammar schools had already been given permission by DfE to change their admissions policies and would so with effect from September 2015, while a further five or six had already introduced the reform.

A November 2014 PQ reply updates the figures above, saying that 32 grammar schools have already prioritised disadvantaged learners in their admissions arrangements and a further 65 ‘intend to consult on doing so’.

That leaves 66 (40%) which are not giving this active consideration.

The Chief Executive of the GSHA commented:

‘“You won’t notice a dramatic change in schools themselves because the numbers are quite small…This is reaching out at the margins in a way that won’t deprive other people of a place. The real need is to raise the standard among free school meals pupils at Key Stage 1 and Key Stage 2, that’s the key issue.

“What we are looking at in the meantime is what we can do to help these free school meals pupils who want to come to grammar school.”

Mr Sindall said that many of the country’s 164 grammar schools would not change their policies because competition for places was less fierce and it would be unnecessary. Many schools were also increasing outreach programmes and some were running eleven-plus familiarisation sessions to help prepare poorer children for the test, he added.’

There is evidence here of a desire to play down the impact of such changes, to suggest that the supply of disadvantaged high achievers is too small to do otherwise.

The data analysis above suggests that almost all selective schools need to address the issue.

Between them, the various press reports mention admissions changes at several schools, including Rugby High, South Wilts, ‘a series of Buckinghamshire grammars including Sir William Borlase’s, Dr Challoner’s  and Aylesbury Grammar’, as well as the King Edward’s Foundation Schools in Birmingham.

I checked how these changes have been embodied in some of these schools’ admissions policies.

The reports indicated that Rugby was:

‘…going even further by reserving a fixed number of places for FSM-eligible children, so potentially accepting pupils with lower entrance exam scores than other applicants.’

Rugby’s admissions arrangements for 2015 do indeed include as a second overall admissions priority, immediately following children in care:

‘Up to 10 places for children living within the priority circle for children in receipt of Free School Meals whose scores are between one and ten marks below the qualifying score for entry to the school.’

South Wilts included FSM as an oversubscription criterion in its 2014 admission arrangements, replacing it with pupil premium eligibility in 2015. However, in both cases it is placed third after children in care and those living in the school’s designated [catchment] area.

Sir William Borlase’s goes one better, in that its 2015 admissions policy places children eligible for free school meals immediately after ‘children in care’ and before ‘children living in the catchment area of the school’, though again only in the oversubscription criteria.

The King Edward’s Foundation is pursuing a similar route to Rugby’s. It announced its intention to reform admissions to its five Birmingham grammar schools in April 2014:

‘The Government wishes to improve the social mobility of children in the UK and has urged selective schools to consider how their admission policies could be changed to achieve this. The King Edward VI Grammar Schools have applied to the Department for Education which can allow them to give preference in their policies, to children who are on free school meals, or have been at any point in the last six years…

… In addition the grammar schools will be offering familiarisation sessions which will introduce children from less privileged backgrounds to the idea of attending a grammar school and will encourage them to take the 11+.

All of the Grammar Schools have set themselves a target of a 20% intake of children on free school meals (Aston has already achieved this and has a target of 25%). The expansion of the grammar schools which was announced earlier this year means that these additional children will simply fill the additional space.’

According to the 2013 Performance Tables, the FSM rates at each of these schools in January 2013 were:

  • Aston – 12.9%
  • Camp Hill Boys – 3.6%
  • Camp Hill Girls – 5.3%
  • Five Ways – 2.6%
  • Handsworth Girls – 6.3%

There must have been a major improvement at Aston for the September 2013 admissions round. As for the other four schools, they must increase their FSM admissions by a factor of between 4 and 8 to reach this target.

I wonder whether the targets are actually for ‘ever 6’ admissions?

In the event, the Foundation’s applications encountered some difficulties. In July the Admissions Adjudicator was obliged to reject them.

A parent had objected on the grounds that:

‘…it is necessary to request financial information from parents to achieve this priority which is contrary to paragraph 1.9(f) of the School Admissions Code.

… The objector further feels that it is unclear, unfair and unreasonable to use the pupil premium to differentiate between applications when the school is oversubscribed.’

The Adjudicator found in favour of the parent on the technical grounds that, although the schools had applied for variations of their funding agreements to permit this change, they had only done so retrospectively.

However, in each case:

‘The school is now entitled to give priority to girls eligible for the pupil premium as the funding agreement has been amended.’

By August the Foundation was able to state that the issue had been resolved:

‘Children applying for a place at any of the King Edward VI Grammar Schools must now achieve a minimum “qualifying score” in the test to be eligible for entry.

Any Looked After Child or previously Looked After Child (a child who is or has been in the care of the Local Authority) who achieves the “qualifying score” will be given priority for admission for up to 20% of the available places (25% at Aston).

Children eligible for Pupil Premium (those who have been registered for Free School meals at any point in the 6 years prior to the closing date for registration, 11 July 2014) who achieve the “qualifying score” will also be given priority for admission.

After this allocation, children not eligible for the Pupil Premium but who achieve the “qualifying score” will be admitted by rank order of scores until all places are filled.’

The Foundation has published an interesting FAQ on the new arrangements:

‘Q5. Will this mean that if you are poor you won’t have to score as high in the 11+ admission tests?
A. That is essentially correct – up to 20% of places (25% at Aston) are set aside for pupil premium children who achieve “a qualifying score”. This qualifying score will be set before the test in September after we have reviewed data in order to ensure that children who achieve the score can flourish in our schools.

Q6. Why don’t you want the cleverest children at your school anymore?
A.
 We want our schools to represent the City of Birmingham and the diverse backgrounds that our children might come from. We believe that there are clever children out there who just don’t have the same opportunity to succeed as those from more privileged backgrounds and we want to try to do something about that.’

It acknowledges the magnitude of the challenge ahead:

‘John Collins, Secretary to the Governors of the charity The Schools of King Edward VI in Birmingham said “This is a hugely challenging target which we do not expect to achieve in the first few years of the initiative, as currently there are relatively few free school meal pupils who apply to take the test. These low numbers are something we are trying to address with our “familiarisation” programme which seeks to encourage bright children from less privileged backgrounds to take the test.”’

Also in July the Government opened up the same possibility for grammar schools that are not academies by consulting on amendments to the Admissions Code to permit this.

In October this was confirmed in the Government’s response to the consultation which stressed it was being introduced as an option rather than a universal requirement.

.

Progress on 11+ Test Reform

The new-style 11-plus tests developed by CEM have not had a universally positive reception. Much of the attention has been focused on their adoption by Buckinghamshire grammar schools.

The GSHA’s May 2014 newsletter notes that ‘some schools in the Midlands’ have been using CEM tests for five years. From 2015, 40% of grammar schools will be using these tests, which are:

‘…designed to be immune to the influence of coaching’

adding:

‘The analysis of data from Buckinghamshire (a wholly selective area which has recently switched to the CEM Centre tests) will provide us in time with valuable hard data on the large scale impact of the change over time.’

Back in February 2014 an Observer article had already cited positive feedback from Buckinghamshire:

‘Last autumn, a handful of education authorities in England introduced an exam designed to test a wider range of abilities – ones that are already being taught in primary schools, rather than skills that can be mastered through home tutoring – to make the selection system fairer.

Provisional results indicate that a more diverse selection of pupils passed this test, and headteachers say they feel the change has made a difference.

Ros Rochefort, headteacher at Bledlow Ridge primary school in Buckinghamshire…said that this year, for the first time in her career, the test has delivered a fair result. “All the kids who got through were expected to pass and, as usual, there are a couple of appeals coming through. All our very able children were selected….

…. Philip Wayne, headteacher at Chesham grammar school and chairman of the Bucks Grammar School Heads Association, has welcomed the changes and says he is “very confident” that the new test will avoid the current situation, in which many pupils who won places at his school with the help of intensive tutoring struggle to keep up with lessons once they arrive.’

However, there were contemporary reports that the 2013 tests led to a 6% fall (110 fewer pupils) in the proportion of places awarded to children from in-county state primary schools, even though 300 more pupils applied.

In September this was further developed in a Guardian story:

‘According to the data, a child from a Buckinghamshire private school is now more than three and a half times more likely to pass the 11-plus than a child from one of its state primaries….

…FOI requests to the eight secondary schools in Wycombe, which includes some of the most deprived and diverse wards in the county, suggest that children on free school meals and of Pakistani heritage have been less successful this year. ‘

A local pressure group Local Equal and Excellent has been trying to gather and analyse the data from the initial rounds of testing in 2013 and 2014 (ie for admission in 2014 and 2015).

Their most recent analysis complains at refusals to publish the full test data and contains an analysis based on the limited material that has been released.

In November 2014, the matter was discussed at Buckinghamshire’s Education, Skills and Children’s Services Select Committee.

The ‘results and analysis’ paper prepared by Buckinghamshire’s grammar school headteachers contains many words and far too few numbers.

The section on ‘Closing the gap’ says:

‘One local group has claimed that children from poorer backgrounds and BME have ‘done worse’ in the new Secondary Transfer Test. It is not specified what ‘worse’ means; however it is not reliable to make statements about trends and patterns for specific groups from a single year’s data and as stated above the data that has been used to make such claims is a small subset of the total and unrepresentative. To substantiate such claims a detailed analysis of additional information such as the current attainment of the children concerned would be needed. We are currently considering how a longitudinal study might be achieved.’

This is overly defensive and insufficiently transparent.

There is some disagreement about whether or not the new test is less amenable to coaching.

The ‘results and analysis’ paper says:

‘There is no such thing as a ‘tutor proof’ test. However, the new tests are less susceptible to the impact of specific test tutoring because they are aligned to the National Curriculum which all children study. Additionally, the questions in the new test are less predictable than in the previous test because they cover a wider range of topics and there is a broader range of question types – points acknowledged and welcomed by primary headteachers’.

Conversely, the pressure group says:

‘The new 11-plus, devised by the Centre for Evaluation and Monitoring (CEM) at Durham University, is supposed to rely less heavily on verbal reasoning and be more closely allied to the primary curriculum. Practice papers for the CEM test are supposed to be less readily available…

But… the fact that it is modelled on what can be taught in schools means the CEM test is more amenable to coaching… if children can’t be taught to get better in maths, why are we teaching it in schools? Practice will make anyone better and I see no sign that tuition has tailed off at all.’

Elsewhere there is evidence that 11+ testing is not immune to financial pressures. North Yorkshire is presently consulting on a plan to scale back from a familiarisation test and two sets of two full tests, with the best results taken forward.

Instead there would be a single set of tests taken by all candidates on the same day at a single venue, plus sample booklets in place of the familiarisation test. A system of reviews, enabling parents to provide supporting evidence to explain under-performance, would also be discontinued.

The reason is explicit:

‘The cost of administering an overly bureaucratic system of testing is no longer sustainable in the light of very significant cuts in public expenditure.’

Even though the draft impact assessment says that the Council will consider applications for support with transport from rural areas and for those with low incomes, there is some unacknowledged risk that the new arrangements will be detrimental to efforts to increase the proportion of disadvantaged learners admitted to these schools.

.

How Best to Close Excellence Gaps

.

What to do with the status quo

The next Government will inherit:

  • The Access Grammar reform project, outlined above, which is making some progress in the right direction, but needs closer scrutiny and probably more central direction. There is an obvious tension between Laws’ aspiration that all grammar schools should ‘give preference to pupil premium pupils over the next few years’ and the GSHA position, which is that many schools do not need to change their policies. It will be important that the changes to admissions arrangements for the 163 schools are catalogued and their impact on admissions monitored and made public, so that we can see at a glance which schools are leading the pack and which are laggards. A published progress report against the Sutton Trust’s six recommendations would help to establish future priorities. Greater transparency about the project itself is also highly desirable.
  • A small cadre of selective 16-19 free schools. It will need to articulate its position on academic selection at 16+ and might need to take action to ensure a level playing field with existing sixth form colleges. It might consider raising expectations of both new and existing institutions in respect of the admission of disadvantaged learners, so securing consistency between 11+ selection and 16+ selection.
  • Flexibility within the Admissions Code for all grammar schools – academies and LA-maintained alike – to prioritise the admission of disadvantaged learners. It may need to consider whether it should move further towards compulsion in respect of grammar schools, particularly if the GSHA maintains its position that many do not need to broaden their intake in this fashion.
  • Flexibility for all grammar schools to increase Planned Admission Numbers and, potentially, to submit proposals for the establishment of Satellite institutions. The approval of such proposals rests with the local authority in the case of a maintained school but with the Secretary of State for Education in respect of academies. An incoming government may need to consider what limits and conditions should be imposed on such expansion, including requirements relating to the admission of disadvantaged learners.

It may be helpful to clarify the position on satellites. The Coalition Government has confirmed that they can be established:

‘It is possible for an existing maintained grammar school or academy with selective arrangements to expand the number of places they offer, including by extending on to another site…There are, however, limitations on that sort of expansion, meaning it could only be a continuation of the existing school. The school admissions code is written from a presumption that those schools with a split site are a single school’ (Hansard, 16 February 2012, Col. 184W).

In December 2013, a proposal to establish a grammar school annexe in Sevenoaks, Kent was rejected by the Secretary of State on the grounds that it would constitute a new school:

‘Mr Gove’s legal ruling hinged on the issue of a girls’ grammar school being the sponsor of a Sevenoaks annexe for both girls and boys. The planned entry of Sevenoaks boys to the annexe lead Mr Gove to rule that the annexe’s proposed admissions policy was sufficiently different to the sponsor school’s girls-only admissions policy to constitute a wholly new grammar school.’

But a revised proposal was submitted in November 2014 for a girls’ only annexe. Moreover, the local authority has committed to exploring whether another satellite could be established in Maidenhead, acknowledging that this would require the co-operation of an existing grammar school.

The timing of the decision on the revised Sevenoaks proposal ensures that selection will remain a live issue as we approach the General Election

Further options to promote between-school selection

There are several options for strengthening a pro-selection policy further that would not require the removal of statutory constraints on opening new 11-18 grammar schools, or permitting existing schools to change their character to permit selection.

For example:

  • Pursuing the Wilshavian notion of organising schools into geographical clusters, some with academic and others with vocational specialisms, and enabling learners to switch between them at 14+. In many areas these clusters will incorporate at least one grammar school; in others the ‘academic’ role would be undertaken by high-performing comprehensive schools with strong sixth forms. The practical difficulties associated with implementing this strategy ought not to be underplayed, however. For example, how much spare capacity would the system need to carry in order to respond to annual fluctuations in demand? How likely is it that students would wish to leave their grammar schools at 14 and what tests would incomers be expected to pass? Would the system also be able to accommodate those who still wished to change institution at age 16?
  • Vigorously expanding the cadre of post-16 selective free schools. There is presumably a largely unspent budget for up to twelve 16-19 maths free schools, though it will be vulnerable to cuts. It would be relatively straightforward to develop more, extending into other curricular specialisms and removing the obligatory university sponsorship requirement. Expansion could be focused on clones of the London Academy of Excellence and the Harris Westminster Sixth Form. But there should be standard minimum requirements for the admission of disadvantaged learners. A national network might be created which could help to drive improvements in neighbouring primary and secondary schools.
  • Permit successful selective post-16 institutions to admit high-attaining disadvantaged students at age 14, to an academic pathway, as a parallel initiative to that which enables successful colleges to take in 14 year-olds wishing to study vocational qualifications. It may be that the existing scheme already permits this, since the curriculum requirements do not seem to specify a vocational pathway.

UKIP’s policy, as presently articulated, is merely enabling: few existing schools are likely to want to change their character in this fashion.

One assumes that Tory advocates would be satisfied with legislation permitting the establishment of new free schools that select at age 11 or age 14. It seems unlikely that anyone will push for the nuclear option of ‘a grammar school in every town’… but Conservative Voice will imminently reveal their hand.

.

Further options to promote within-school selection

If the political preference is to pursue within-school provision as an alternative to between-school selection there are also several possibilities including:

  • Encouraging the development of more bilateral schools with parallel grammar and selective streams and/or fast-track grammar streams within standard comprehensive schools.
  • Requiring, incentivising or promoting more setting in secondary schools, potentially prioritising the core subjects.
  • Developing a wider understanding of more radical and innovative grouping practices, such as vertical and cluster grouping, and trialling the impact of these through the EEF.

It would of course be important to design such interventions to benefit all students, but especially disadvantaged high attainers.

The Government might achieve the necessary leverage through a ‘presumption’ built into Ofsted’s inspection guidance (schools are presumed to favour the specified approach unless they can demonstrate that an alternative leads consistently to higher pupil outcomes) or through a ‘flexible framework’ quality standard.

.

A national student support scheme

The most efficient method of supporting attainment and social mobility amongst disadvantaged high attainers is through a national scheme that helps them directly, rather than targeting the schools and colleges that they attend.

This need not be a structured national programme, centrally delivered by a single provider. It could operate within a framework that brings greater coherence to the existing market and actively promotes the introduction of new suppliers to fill gaps in coverage and/or compete on quality. A ‘managed market’ if you will.

The essential elements would include:

  • This supply-side framework, covering the full range of disadvantaged students’ learning and development needs, within which all suppliers – universities, third sector, commercial, schools-based – would position their services (or they would be excluded from the scheme).
  • A commitment on the part of all state-funded schools and colleges to implement the scheme with their disadvantaged high attainers (the qualifying criterion might be FSM or ‘ever 6’) – and to ensure continuity and progression when and if these students change institution, especially at 16+.
  • A coherent learning and development programme for each eligible student throughout Years 7-13. Provision in KS3 might be open access and light touch, designed principally to identify those willing and able to pursue the programme into KS4 and KS5. Provision in these latter stages would be tailored to individuals’ needs and continuation would be dependent on progress against challenging but realistic personal targets, including specified GCSE grades.
  • Schools and colleges would act as facilitators and guides, conducting periodic reviews of students’ needs; helping them to identify suitable services from the framework; ensuring that their overall learning programmes – the in-school/college provision together with the services secured from the framework – constitute a coherent learning experience; helping them to maintain learning profiles detailing their progress and achievement.
  • Each learner would have a personal budget to meet costs attached to delivering his learning programme, especially costs attached to services provided through the framework. This would be paid through an endowment fund, refreshed by an annual £50m topslice from the pupil premium budget (analogous to that for literacy and numeracy catch-up) and a matching topslice from universities’ outreach budgets for fair access.
  • Universities would be strongly encouraged to make unconditional offers on the basis of high quality learning profiles, submitted by students as part of their admissions process.
  • There would be annual national targets for improving the GCSE and A level attainment of students participating in the scheme and for admission to – and graduation from – selective universities. This would include challenging but realistic targets for improving FSM admission to Oxbridge.

.

Conclusion

The current political debate is overly fixated on aspects of the wider problem, rather than considering the issue in the round.

I have set out above the far wider range of options that should be under consideration. These are not necessarily mutually exclusive.

If I were advising any political party inclined to take this seriously, I would recommend four essential components:

  • An enhanced strategy to ensure that all existing selective schools (including 16+ institutions) take in a larger proportion of high-attaining disadvantaged learners. Approval for expansion and any new schools would be conditional on meeting specified fair access targets.
  • Development of the cadre of 163 grammar schools into a national network, with direct responsibility for leading national efforts to increase the supply of high-attaining disadvantaged learners emerging from primary schools. Selective independent schools might also join the network, to fill gaps in the coverage and fulfil partnership expectations.
  • A policy to promote in all schools effective and innovative approaches to pupil grouping, enabling them to identify the circumstances in which different methods might work optimally and how best to implement those methods to achieve success. Schools would be encouraged to develop, trial and evaluate novel and hybrid approaches, so as to broaden the range of potential methods available.
  • A national support scheme for disadvantaged high attainers aged 11-19 meeting the broad specification set out above.

Regrettably, I fear that party political points-scoring will stand in the way of a rational solution.

Grammar schools have acquired a curious symbolic value, almost entirely independent of their true purpose and largely unaffected by the evidence base.

They are much like a flag of convenience that any politician anxious to show off his right-wing credentials can wave provocatively in the face of his opponents. There is an equivalent flag for abolitionists.  Anyone who proposes an alternative position is typically ignored.

.

GP

November 2014

Excellence Gaps Quality Standard: Version 1


This post is the first stage of a potential development project.

letter-33809_640
It is my initial ‘aunt sally’ for a new best fit quality standard, intended to support schools and colleges to close performance gaps between high-achieving disadvantaged learners and their more advantaged peers.

It aims to integrate two separate educational G_letter_blue_whiteobjectives:

  • Improving the achievement of disadvantaged learners, specifically those eligible for Pupil Premium support; and
  • Improving the achievement of high attainers, by increasing the proportion that achieve highly and the levels at which they achieve.

High achievement embraces both high Blue_square_Qattainment and strong progress, but these terms are not defined or quantified on the face of the standard, so that it is applicable in primary, secondary and post-16 settings and under both the current and future assessment regimes.

I have adopted new design parameters for this fresh venture into quality standards:

  • The standard consists of twelve elements placed in what seems a logical order, but they White_Letter_S_on_Green_Backgroundare not grouped into categories. All settings should consider all twelve elements. Eleven are equally weighted, but the first ‘performance’ element is potentially more significant.
  • The baseline standard is called ‘Emerging’ and is broadly aligned with Ofsted’s ‘Requires Improvement’. I want it to capture only the essential ‘non-negotiables’ that all settings must observe or they would otherwise be inadequate. I have erred on the side of minimalism for this first effort.
  • The standard marking progress beyond the baseline is called ‘Improving’ and is (very) broadly aligned with Ofsted’s ‘Good’. I have separately defined only the learner performance expected, on the assumption that in other respects the standard marks a continuum. Settings will position themselves according to how far they exceed the baseline and to what extent they fall short of excellence.
  • The excellence standard is called ‘Exemplary’ and is broadly aligned with Ofsted’s ‘Outstanding’. I have deliberately tried to pitch this as highly as possible, so that it provides challenge for even the strongest settings. Here I have erred on the side of specificity.

The trick with quality standards is to find the right balance between over-prescription and vacuous ‘motherhood and apple pie’ statements.

There may be some variation in this respect between elements of the standard: the section on teaching and learning always seems to be more accommodating of diversity than others given the very different conceptions of what constitutes effective practice. (But I am also cautious of trespassing into territory that, as a non-practitioner, I may not fully understand.)

The standard uses terminology peculiar to English settings but the broad thrust should be applicable in other countries with only limited adaptation.

The terminology needn’t necessarily be appropriate in all respects to all settings, but it should have sufficient currency and sharpness to support meaningful interaction between them, including cross-phase interaction. It is normal for primary schools to find some of the language more appropriate to secondary schools.

It is important to emphasise the ‘best fit’ nature of such standards. Following discussion informed by interaction with the framework, settings will reach a reasoned and balanced judgement of their own performance across the twelve elements.

It is not necessary for all statements in all elements to be observed to the letter. If a setting finds all or part of a statement beyond the pale, it should establish why that is and, wherever possible, devise an alternative formulation to fit its context. But it should strive wherever possible to work within the framework, taking full advantage of the flexibility it permits.

Some of the terminology will be wanting, some important references will have been omitted while others will be over-egged. That is the nature of ‘aunt sallys’.

Feel free to propose amendments using the comments facility below.

The quality standard is immediately below.  To improve readability, I have not reproduced the middle column where it is empty. Those who prefer to see the full layout can access it via this PDF


Emerging (RI) Improving (G) Exemplary (O)
The setting meets essential minimum criteria In best fit terms the setting has progressed beyond entry level but is not yet exemplary The setting is a model for others to follow
Performance Attainment and progress of disadvantaged high achievers typically matches that of similar learners nationally, or is rapidly approaching this..Attainment and progress of advantaged and disadvantaged high achievers in the setting are both improving. Attainment and progress of disadvantaged high achievers consistently matches and sometimes exceeds that of similar learners nationally..Attainment and progress are improving steadily for advantaged and disadvantaged high achievers in the setting and performance gaps between them are closing. Attainment and progress of disadvantaged high achievers significantly and consistently exceeds that of similar learners nationally..

Attainment and progress matches but does not exceed that of advantaged learners within the setting, or is rapidly approaching this, and both attainment and progress are improving steadily, for advantaged and disadvantaged high achievers alike.


  Emerging (RI) The setting meets essential minimum criteria Exemplary (O) The setting is a model for others to follow
Policy/strategy There is a published policy to close excellence gaps, supported by improvement planning. Progress is carefully monitored. There is a comprehensive yet clear and succinct policy to close excellence gaps that is published and easily accessible. It is familiar to and understood by staff, parents and learners alike.

.

SMART action to close excellence gaps features prominently in improvement plans; targets are clear; resources and responsibilities are allocated; progress is monitored and action adjusted accordingly. Learners’ and parents’ feedback is routinely collected.

.

The setting invests in evidence-based research and fosters innovation to improve its own performance and contribute to system-wide improvement.

Classroom T&L Classroom practice consistently addresses the needs of disadvantaged high achievers, so improving their learning and performance. The relationship between teaching quality and closing excellence gaps is invariably reflected in classroom preparation and practice.

.

All teaching staff and paraprofessionals can explain how their practice addresses the needs of disadvantaged high achievers, and how this has improved their learning and performance.

.

All staff are encouraged to research, develop, deploy, evaluate and disseminate more effective strategies in a spirit of continuous improvement.

Out of class learning A menu of appropriate opportunities is accessible to all disadvantaged high achievers and there is a systematic process to match opportunities to needs. A full menu of appropriate opportunities – including independent online learning, coaching and mentoring as well as face-to-face activities – is continually updated. All disadvantaged high achievers are supported to participate.

.

All provision is integrated alongside classroom learning into a coherent, targeted educational programme. The pitch is appropriate, duplication is avoided and gaps are filled.

.

Staff ensure that: learners’ needs are regularly assessed; they access and complete opportunities that match their needs; participation and performance are monitored and compiled in a learning record.

Assessment/ tracking Systems for assessing, reporting and tracking attainment and progress provide disadvantaged high achievers, parents and staff with the information they need to improve performance Systems for assessing, tracking and reporting attainment and progress embody stretch, challenge and the highest expectations. They identify untapped potential in disadvantaged learners. They do not impose artificially restrictive ceilings on performance.

.

Learners (and their parents) know exactly how well they are performing, what they need to improve and how they should set about it. Assessment also reflects progress towards wider goals.

.

Frequent reports are issued and explained, enabling learners (and their parents) to understand exactly how their performance has changed over time and how it compares with their peers, identifying areas of relative strength and weakness.

.

All relevant staff have real-time access to the assessment records of disadvantaged high attainers and use these to inform their work.

.

Data informs institution-wide strategies to improve attainment and progress. Analysis includes comparison with similar settings.

Curriculum/organisation The needs and circumstances of disadvantaged high achievers explicitly inform the curriculum and curriculum development, as well as the selection of appropriate organisational strategies – eg sets and/or mixed ability classes. The curriculum is tailored to the needs of disadvantaged high achievers. Curriculum flexibility is utilised to this end. Curriculum development and planning take full account of this.

.

Rather than a ‘one size fits all’ approach, enrichment (breadth), extension (depth) and acceleration (pace) are combined appropriately to meet different learners’ needs.

.

Personal, social and learning skills development and the cultivation of social and cultural capital reflect the priority attached to closing excellence gaps and the contribution this can make to improving social mobility.

.

Organisational strategies – eg the choice of sets or mixed ability classes – are informed by reliable evidence of their likely impact on excellence gaps.

Ethos/pastoral The ethos is positive and supportive of disadvantaged high achievers. Excellence is valued by staff and learners alike. Bullying that undermines this is eradicated. The ethos embodies the highest expectations of learners, and of staff in respect of learners. Every learner counts equally.

.

Excellence is actively pursued and celebrated; competition is encouraged but not at the expense of motivation and self-esteem;hothousing is shunned.

.

High achievement is the norm and this is reflected in organisational culture; there is zero tolerance of associated bullying and a swift and proportional response to efforts to undermine this culture.

.

Strong but realistic aspirations are fostered. Role models are utilised. Social and emotional needs associated with excellence gaps are promptly and thoroughly addressed.

.

The impact of disadvantage is monitored carefully. Wherever possible, obstacles to achievement are removed.

Transition/progression The performance, needs and circumstances of disadvantaged high achievers are routinely addressed in transition between settings and in the provision of information, advice and guidance. Where possible, admissions arrangements prioritise learners from disadvantaged backgrounds – and high achievers are treated equally in this respect.

.

Receiving settings routinely collect information about the performance, needs and circumstances of disadvantaged high achievers. They routinely share such information when learners transfer to other settings.

.

Information, advice and guidance is tailored, balanced and thorough. It supports progression to settings that are consistent with the highest expectations and high aspirations while also meeting learners’ needs.

.

Destinations data is collected, published and used to inform monitoring.

.

Leadership, staffing, CPD A named member of staff is responsible – with senior leadership support – for co-ordinating and monitoring activity across the setting (and improvement against this standard)..Professional development needs associated with closing excellence gaps are identified and addressed The senior leadership team has an identified lead and champion for disadvantaged high achievers and the closing of excellence gaps.

.

A named member of staff is responsible for co-ordinating and monitoring activity across the setting (and improvement against this standard).

.

Closing excellence gaps is accepted as a collective responsibility of the whole staff and governing body. There is a named lead governor.

.

There is a regular audit of professional development needs associated with closing excellence gaps across the whole staff and governing body. A full menu of appropriate opportunities is continually updated and those with needs are supported to take part.

.

The critical significance of teaching quality in closing excellence gaps is instilled in all staff, accepted and understood.

Parents Parents and guardians understand how excellence gaps are tackled and are encouraged to support this process. Wherever possible, parents and guardians are actively engaged as partners in the process of closing excellence gaps. The setting may need to act as a surrogate. Other agencies are engaged as necessary.

.

Staff, parents and learners review progress together regularly. The division of responsibility is clear. Where necessary, the setting provides support through outreach and family learning.

.

This standard is used as the basis of a guarantee to parents and learners of the support that the school will provide, in return for parental engagement and learner commitment.

Resources Sufficient resources – staffing and funding – are allocated to improvement planning (and to the achievement of this standard)..Where available, Pupil Premium is used effectively to support disadvantaged high achievers. Sufficient resources – staffing and funding – are allocated to relevant actions in the improvement plan (and to the achievement of this standard).

.

The proportion of Pupil Premium (and/or alternative funding sources) allocated to closing excellence gaps is commensurate with their incidence in the setting.

.

The allocation of Pupil Premium (or equivalent resources) is not differentiated on the basis of prior achievement: high achievers are deemed to have equal needs.

.

Settings should evidence their commitment to these principles in published material (especially information required to be published about the use of Pupil Premium).

Partnership/collaboration The setting takes an active role in collaborative activity to close excellence gaps. Excellence gaps are addressed and progress is monitored in partnership with all relevant ‘feeder’ and ‘feeding’ settings in the locality.

.

The setting leads improvement across other settings within its networks, utilising the internal expertise it has developed to support others locally, regionally and nationally.

.

The setting uses collaboration strategically to build its own capacity and improve its expertise.


letter-33809_640G_letter_blue_whiteBlue_square_QWhite_Letter_S_on_Green_Background


Those who are not familiar with the quality standards approach may wish to know more.

Regular readers will know that I advocate what I call ‘flexible framework thinking’, a middle way between the equally unhelpful extremes of top-down prescription (one-size-fits-all) and full institutional autonomy (a thousand flowers blooming). Neither secures consistently high quality provision across all settings.

The autonomy paradigm is currently in the ascendant. We attempt to control quality through ever-more elaborate performance tables and an inspection regime that depends on fallible human inspectors and documentation that regulates towards convergence when it should be enabling diversity, albeit within defined parameters.

I see more value in supporting institutions through best-fit guidance of this kind.

My preferred model is a quality standard, flexible enough to be relevant to thousands of different settings, yet specific enough to provide meaningful guidance on effective practice and improvement priorities, regardless of the starting point.

I have written about the application of quality standards to gifted education and their benefits on several occasions:

Quality standards are emphatically not ‘tick box’ exercises and should never be deployed as such.

Rather they are non-prescriptive instruments for settings to use in self-evaluation, for reviewing their current performance and for planning their improvement priorities. They support professional development and lend themselves to collaborative peer assessment.

Quality standards can be used to marshal and organise resources and online support. They can provide the essential spine around which to build guidance documents and they provide a useful instrument for research and evaluation purposes.


GP

October 2014

Closing England’s Excellence Gaps: Part 2

This is the second part of an extended post considering what we know – and do not know – about high attainment gaps between learners from advantaged and disadvantaged backgrounds in England.

512px-Bakerloo_line_-_Waterloo_-_Mind_the_gap

Mind the Gap by Clicsouris

Part one provided an England-specific definition, articulated a provisional theoretical model for addressing excellence gaps and set out the published data about the size of excellence gaps at Key Stages 2,4 and 5, respectively.

Part two continues to review the evidence base for excellence gaps, covering the question whether high attainers remain so, international comparisons data and related research and excellence gaps analysis from the USA.

It also describes those elements of present government policy that impact directly on excellence gaps and offers some recommendations for strengthening our national emphasis on this important issue.


Whether disadvantaged high achievers remain so


The Characteristics of High Attainers

The Characteristics of high attainers (DfES 2007) includes investigation of:

  • whether pupils in the top 10% at KS4 in 2006 were also high attainers at KS3 in 2004 and KS2 in 2001, by matching back to their fine grade points scores; and
  • chances of being a KS4 high attainer given a range of pupil characteristics at KS2 and KS3.

On the first point it finds that 4% of all pupils remain in the top 10% throughout, while 83% of pupils are never in the top 10% group.

Some 63% of those who were high attainers at the end of KS2 are still high attainers at the end of KS3, while 72% of KS3 high attainers are still in that group at the end of KS4. Approximately half of high attainers at KS2 are high attainers at KS4.

The calculation is not repeated for advantaged and disadvantaged high attainers respectively, but this shows that – while there is relatively little movement between  the high attaining population and other learners (with only 17% of the overall population falling within scope at any point) – there is a sizeable ‘drop out’ amongst high attainers at each key stage.

Turning to the second point, logistic regression is used to calculate the odds of being a KS4 high attainer given different levels of prior attainment and a range of pupil characteristics. Results are controlled to isolate the impact of individual characteristics and for attainment.

The study finds that pupils with a KS2 average points score (APS) above 33 are more likely than not to be high attainers at KS4, and this probability increases as their KS2 APS increases. For those with an APS of 36, the odds are 23.73, meaning they have a 24/25 chance of being a KS4 high attainer.

For FSM-eligible learners though, the odds are 0.55, meaning that the chances of being a KS4 high attainer are 45% lower amongst FSM-eligible pupils, compared to  their non-FSM counterparts with similar prior attainment and characteristics.

The full set of findings for individual characteristics is reproduced below.

Ex gap Capture 7


An appendix supplies the exact ratios for each characteristic and the text points out that these can be multiplied to calculate odds ratios for different combinations:

The odds for different prior attainment levels and other characteristics combined with FSM eligibility are not worked through, but could easily be calculated. It would be extremely worthwhile to repeat this analysis using more recent data to see whether the results would be replicated for those completing KS4 in 2014.


Sutton Trust

In 2008, the Sutton Trust published ‘Wasted talent? Attrition rates of high achieving pupils between school and university’ which examines the attrition rates for FSM-eligible learners among the top 20% of performers at KS2, KS3 and KS4.

A footnote says that this calculation was ‘on the basis of their English and maths scores at age 11, and at later stages of schooling’, which is somewhat unclear. A single, unidentified cohort is tracked across key stages.

The report suggests ‘extremely high rates of ‘leakage’ amongst the least privileged pupils’. The key finding is that two-thirds of disadvantaged top performers at KS2 are not amongst the top performers at KS4, whereas 42% advantaged top performers are not.


EPPSE

Also in the longitudinal tradition ‘Performing against the odds: developmental trajectories of children in the EPPSE 3-16 study’ (Siraj-Blatchford et al, June 2011) investigated through interviews the factors that enabled a small group of disadvantaged learners to ‘succeed against the odds’.

Twenty learners were identified who were at the end of KS3 or at KS4 and who had achieved well above predicted levels in English and maths at the end of KS2. Achievement was predicted for the full sample of 2,800 children within the EPPSE study via multi-level modelling, generating:

‘…residual scores for each individual child, indicating the differences between predicted and attained achievement at age 11, while controlling for certain child characteristics (i.e., age, gender, birth weight, and the presence of developmental problems) and family characteristics (i.e., mothers’ education, fathers’ education, socio-economic status [SES] and family income). ‘

The 20 identified as succeeding against the odds had KS2 residual scores for both English and maths within the highest 20% of the sample. ‘Development trajectories’ were created for the group using a range of assessments conducted at age 3, 4, 5, 7, 11 and 14.

The highest job level held in the family when the children were aged 3-4 was manual, semi-skilled or unskilled, or the parent(s) had never worked.

The 20 were randomly selected from each gender – eight boys and 12 girls – while ensuring representation of ‘the bigger minority ethnic groups’. It included nine students characterised as White UK, five Black Caribbean, two Black African and one each of Indian (Sikh), Pakistani, Mixed Heritage and Indian (Hindu).

Interviews were conducted with children, parents and the teacher at their [present] secondary school the learners felt ‘knew them best’. Teacher interviews were secured for 11 of the 20.

Comparison of development trajectories showed significant gaps between this ‘low SES high attainment’ group and a comparative sample of ‘low SES, predicted attainment’ students. They were ahead from the outset and pulled further away.

They also exceeded a comparator group of high SES learners performing at predicted levels from entry to primary education until KS2. Even at KS3, 16 of the 20 were still performing above the mean of the high SES sample.

These profiles – illustrated in the two charts below – were very similar in English and maths respectively. In either case, Group 1 are those with ‘low SES, high attainment’, while Group 4 are ‘high SES predicted attainment’ students.


Supp exgap Eng Capture

Supp exgap Maths Capture


Interviews identified five factors that helped to explain this success:

  • The child’s perceived cognitive ability, strong motivation for school and learning and their hobbies and interests. Most parents and children regarded cognitive ability as ‘inherent to the child’, but they had experienced many opportunities to develop their abilities and received support in developing a ‘positive self-image’. Parenting ‘reflected a belief in the parent’s efficacy to positively influence the child’s learning’. Children also demonstrated ability to self-regulate and positive attitudes to homework. They had a positive attitude to learning and made frequent use of books and computers for this purpose. They used school and learning as distractions from wider family problems. Many were driven to learn, to succeed educationally and achieve future aspirations.
  • Home context – effective practical and emotional support with school and learning. Families undertook a wide range of learning activities, especially in the early years. These were perceived as enjoyable but also valuable preparation for subsequent schooling. During the primary years, almost all families actively stimulated their children to read. In the secondary years, many parents felt their efforts to regulate their children’s activities and set boundaries were significant. Parents also provided practical support with school and learning, taking an active interest and interacting with their child’s school. Their parenting style is described as ‘authoritative: warm, firm and accepting of their needs for psychological autonomy but demanding’. They set clear standards and boundaries for behaviour while granting extra autonomy as their children matured. They set high expectations and felt strongly responsible for their child’s education and attitude to learning. They believed in their capacity to influence their children positively. Some were motivated by the educational difficulties they had experienced.
  • (Pre-)School environment – teachers who are sensitive and responsive to the child’s needs and use ‘an authoritative approach to teaching and interactive teaching strategies’; and, additionally, supportive school policies. Parents had a positive perception of the value of pre-school education, though the value of highly effective pre-school provision was not clear cut with this sample. Moreover ‘very few clear patterns of association could be discerned between primary school effectiveness and development of rankings on trajectories’. That said both parents and children recognised that their schools had helped them address learning and behavioural difficulties. Success was attributed to the quality of teachers. ‘They thought that good quality teaching meant that teachers were able to explain things clearly, were enthusiastic about the subject they taught, were approachable when things were difficult to understand, were generally friendly, had control over the class and clearly communicated their expectations and boundaries.’
  • Peers providing practical, emotional and motivational support. Friends were especially valuable in helping them to respond to difficulties, helping in class, with homework and revision. Such support was often mutual, helping to build understanding and develop self-esteem, as a consequence of undertaking the role of teacher. Friends also provided role models and competitors.
  • Similar support provided by the extended family and wider social, cultural and religious communities. Parents encouraged their children to take part in extra-curricular activities and were often aware of their educational benefits. Family networks often provided additional learning experiences, particularly for Caribbean and some Asian families.


Ofsted

Ofsted’s The most able students: Are they doing as well as they should in our non-selective secondary schools? (2013) defines this population rather convolutedly as those:

‘…starting secondary school in Year 7 attaining level 5 or above, or having the potential to attain Level 5 and above, in English (reading and writing) and or mathematics at the end of Key Stage 2.’ (Footnote p6-7)

There is relatively little data in the report about the performance of high-attaining disadvantaged learners, other than the statement that only 58% of FSM students within the ‘most able’ population in KS2 and attending non-selective secondary schools go on to achieve A*-B GCSE grades in English and maths, compared with 75% of non-FSM pupils, giving a gap of 17 percentage points.

I have been unable to find national transition matrices for advantaged and disadvantaged learners, enabling us to compare the proportion of advantaged and disadvantaged pupils making and exceeding the expected progress between key stages.


Regression to the mean and efforts to circumvent it

Much prominence has been given to Feinstein’s 2003 finding that, whereas high-scoring children from advantaged and disadvantaged backgrounds (defined by parental occupation) perform at a broadly similar level when tested at 22 months, the disadvantaged group are subsequently overtaken by relatively low-scoring children from advantaged backgrounds during the primary school years.

The diagram that summarises this relationship has been reproduced widely and much used as the centrepiece of arguments justifying efforts to improve social mobility.

Feinstein Capture

But Feinstein’s finding were subsequently challenged on methodological grounds associated with the effects of regression to the mean.

Jerrim and Vignoles (2011) concluded:

‘There is currently an overwhelming view amongst academics and policymakers that highly able children from poor homes get overtaken by their affluent (but less able) peers before the end of primary school. Although this empirical finding is treated as a stylised fact, the methodology used to reach this conclusion is seriously flawed. After attempting to correct for the aforementioned statistical problem, we find little evidence that this is actually the case. Hence we strongly recommend that any future work on high ability–disadvantaged groups takes the problem of regression to the mean fully into account.’

On the other hand, Whitty and Anders comment:

‘Although some doubt has been raised regarding this analysis on account of the potential for regression to the mean to exaggerate the phenomenon (Jerrim and Vignoles, 2011), it is highly unlikely that this would overturn the core finding that high SES, lower ability children catch up with their low-SES, higher-ability peers.’

Their point is borne out by Progress made by high-attaining children from disadvantaged backgrounds (June 2014) suggesting that Vignoles, as part of the writing team, has changed her mind somewhat since 2011.

This research adopts a methodological route to minimise the impact of regression to the mean. This involves assigning learners to achievement groups using a different test to those used to follow their attainment trajectories and focusing principally on those trajectories from KS2 onwards.

The high attaining group is defined as those achieving Level 3 or above in KS1 writing, which selected in 12.6% of the sample. (For comparison, the same calculations are undertaken based on achieving L3 or above in KS1 maths.) These pupils are ranked and assigned a percentile on the basis of their performance on the remaining KS1 tests and at each subsequent key stage.

The chart summarising the outcomes in the period from KS1 to KS4 is reproduced below, showing the different trajectories of the ‘most deprived’ and ‘least deprived’. These are upper and lower quintile groups of state school students derived on the basis of FSM eligibility and a set of area-based measures of disadvantage and measures of socio-economic status derived from the census.


Ex gap 8 Capture

The trajectories do not alter significantly beyond KS4.

The study concludes:

‘…children from poorer backgrounds who are high attaining at age 7 are more likely to fall off a high attainment trajectory than children from richer backgrounds. We find that high-achieving children from the most deprived families perform worse than lower-achieving students from the least deprived families by Key Stage 4. Conversely, lower-achieving affluent children catch up with higher-achieving deprived children between Key Stage 2 and Key Stage 4.’

Hence:

‘The period between Key Stage 2 and Key Stage 4 appears to be a crucial time to ensure that higher-achieving pupils from poor backgrounds remain on a high achievement trajectory.’

In short, a Feinstein-like relationship is established but it operates at a somewhat later stage in the educational process.


International comparisons studies


PISA: Resilience

OECD PISA studies have recently begun to report on the performance of what they call ‘resilient’ learners.

Against the Odds: Disadvantaged Students Who Succeed in Schools (OECD, 2011) describes this population as those who fall within the bottom third of their country’s distribution by socio-economic background, but who achieve within the top third on PISA assessments across participating countries.

This publication uses PISA 2006 science results as the basis of its calculations. The relative position of different countries is shown in the chart reproduced below. Hong Kong tops the league at 24.8%, the UK is at 13.5%, slightly above the OECD average of 13%, while the USA is languishing at 9.9%.

Ex Gap Capture 9

The findings were discussed further in PISA in Focus 5 (OECD 2011), where PISA 2009 data is used to make the calculation. The methodology is also significantly adjusted so that includes a substantially smaller population:

‘A student is classified as resilient if he or she is in the bottom quarter of the PISA index of economic, social and cultural status (ESCS) in the country of assessment and performs in the top quarter across students from all countries after accounting for socio-economic background. The share of resilient students among all students has been multiplied by 4 so that the percentage values presented here reflect the proportion of resilient students among disadvantaged students (those in the bottom quarter of the PISA index of social, economic and cultural status.’

According to this measure, the UK is at 24% and the US has leapfrogged them at 28%. Both are below the OECD average of 31%, while Shanghai and Hong Kong stand at over 70%.

The Report on PISA 2012 (OECD 2013) retains the more demanding definition of resilience, but dispenses with multiplication by 4, so these results need to be so multiplied to be comparable with those for 2009.

This time round, Shanghai is at 19.2% (76.8%) and Hong Kong at 18.1% (72.4%). The OECD average is 6.4% (25.6%), the UK at 5.8% (23.2%) and the US at 5.2% (20.8%).

So the UK has lost a little ground compared with 2009, but is much close to the OECD average and has overtaken the US, which has fallen back by some seven percentage points.

I could find no commentary on these changes.

NFER has undertaken some work on resilience in Northern Ireland, using PISA 2009 reading results (and the original ‘one third’ methodology) as a base. This includes odds ratios for different characteristics of being resilient. This could be replicated for England using PISA 2012 data and the latest definition of resilience.


Research on socio-economic gradients

The Socio-Economic Gradient in Teenagers’ Reading Skills: How Does England Compare with Other Countries? (Jerrim 2012) compares the performance of students within the highest and lowest quintiles of the ISEI Index of Occupational Status on the PISA 2009 reading tests.

It quantifies the proportion of these two populations within each decile of  achievement, so generating a gradient, before reviewing how this gradient has changed between PISA 2000 and PISA 2009, comparing outcomes for England, Australia, Canada, Finland, Germany and the US.

Jerrim summarises his findings thus:

‘The difference between advantaged and disadvantaged children’s PISA 2009 reading test scores in England is similar (on average) to that in most other developed countries (including Australia, Germany and, to some extent, the US). This is in contrast to previous studies from the 1990s, which suggested that there was a particularly large socio-economic gap in English pupils’ academic achievement.

Yet the association between family background and high achievement seems to be stronger in England than elsewhere.

There is some evidence that the socio-economic achievement gradient has been reduced in England over the last decade, although not amongst the most able pupils from advantaged and disadvantaged homes.’

Jerrim finds that the link in England between family background and high achievement is stronger than in most other OECD countries, whereas this is not the case at the other end of the distribution.

He hypothises that this might be attributable to recent policy focus on reducing the ‘long tail’ while:

‘much less attention seems to be paid to helping disadvantaged children who are already doing reasonably well to push on and reach the top grades’.

He dismisses the notion that the difference is associated with the fact that  disadvantaged children are concentrated in lower-performing schools, since it persists even when controls for school effects are introduced.

In considering why PISA scores show the achievement gap in reading has reduced between 2000 and 2009 at the lower end of the attainment distribution but not at the top, he cites two possibilities: that Government policy has been disproportionately successful at the lower end; and that there has been a more substantial decline in achievement amongst learners from advantaged backgrounds than amongst their disadvantaged peers. He is unable to rule out the latter possibility.

He also notes in passing that PISA scores in maths do not generate the same pattern.

These arguments are further developed in ‘The Reading Gap: The socio-economic gap in children’s reading skills: A cross-national comparison using PISA 2009’ (Jerrim, 2013) which applies the same methodology.

This finds that high-achieving (top decile of the test distribution) boys from the most advantaged quintile in England are two years and seven months ahead of high-achieving boys from the most disadvantaged quintile, while the comparable gap for girls is slightly lower, at two years and four months.

The chart reproduced below illustrates international comparisons for boys. It shows that only Scotland has a larger high achievement gap than England. (The black lines indicate 99% confidence intervals – he associates the uncertainty to ‘sampling variation’.)

Gaps in countries at the bottom of the table are approximately half the size of those in England and Scotland.

Ex gap 10 capture


One of the report’s recommendations is that:

‘The coalition government has demonstrated its commitment to disadvantaged pupils by establishing the Education Endowment Foundation… A key part of this Foundation’s future work should be to ensure highly able children from disadvantaged backgrounds succeed in school and have the opportunity to enter top universities and professional jobs. The government should provide additional resources to the foundation to trial interventions that specifically target already high achieving children from disadvantaged homes. These should be evaluated using robust evaluation methodologies (e.g. randomised control trials) so that policymakers develop a better understanding of what schemes really have the potential to work.’

The study is published by the Sutton Trust whose Chairman – Sir Peter Lampl – is also chairman of the EEF.

In ‘Family background and access to high ‘status’ universities’ (2013) Jerrim provides a different chart showing estimates by country of disadvantaged high achieving learners. The measure of achievement is PISA Level 5 in reading and the measure of disadvantage remains quintiles derived from the ISEI index.

Ex Gap 12 Capture 

The underlying figures are not supplied.

Also in 2013, in ‘The mathematical skills of school children: how does England compare to the high-performing East Asian jurisdictions?’ Jerrim and Choi construct a similar gradient for maths, drawing on a mix of PISA and TIMSS assessments conducted between 2003 and 2009, so enabling them to consider variation according to the age at which assessment takes place.

The international tests selected are TIMSS 2003, 4th grade; TIMSS 2007, 8th grade and PISA 2009. The differences between what these tests measure are described as ‘slight’. The analysis of achievement relies on deciles of the achievement distribution.

Thirteen comparator countries are included, including six wealthy western economies, three ‘middle income’ western economies and four Asian Tigers (Hong Kong, Japan, Singapore and Taiwan).

This study applies as the best available proxy for socio-economic status the number of books in the family home, comparing the most advantaged (over 200 books) with the least (under 25 books). It acknowledges the limitations of this proxy, which Jerrim discusses elsewhere.

The evidence suggests that:

‘between primary school and the end of secondary school, the gap between the lowest achieving children in England and the lowest achieving children in East Asian countries is reduced’

but remains significant.

Conversely, results for the top 10% of the distribution:

‘suggest that the gap between the highest achieving children in England and the highest achieving children in East Asia increases between the end of primary school and the end of secondary school’.

The latter outcome is illustrated in the chart reproduced below

Ex gap 11 Capture


The authors do not consider variation by socio-economic background amongst the high-achieving cohort, presumably because the data still does not support the pattern they previously identified for reading.


US studies

In 2007 the Jack Kent Cooke Foundation published ‘Achievement Trap: How America is Failing Millions of High-Achieving Students from Low Income Backgrounds’ (Wyner, Bridgeland, Diiulio) The text was subsequently revised in 2009.

This focuses exclusively on gaps attributable to socio-economic status, by comparing the performance of those in the top and bottom halves of the family income distribution in the US, as adjusted for family size.

The achievement measure is top quartile performance on nationally normalised exams administered within two longitudinal studies: The National Education Longitudinal Study (NELS) and the Baccalaureate and Beyond Longitudinal Study (B&B).

The study reports that relatively few lower income students remain high achievers throughout their time in elementary and high school:

  • 56% remain high achievers in reading by Grade 5, compared with 69% of higher income students.
  • 25 percent fall out of the high achiever cohort in high school, compared with 16% of higher income students.
  • Higher income learners who are not high achievers in Grade 1 are more than twice as likely to be high achievers by Grade 5. The same is true between Grades 8 and 12.

2007 also saw the publication of ‘Overlooked Gems: A national perspective on low income promising learners’ (Van Tassel-Baska and Stambaugh). This is a compilation of the proceedings of a 2006 conference which does not attempt a single definition of the target group, but draws on a variety of different research studies and programmes, each with different starting points.

An influential 2009 McKinsey study ‘The Economic Impact of the Achievement Gap in America’s Schools’ acknowledges the existence of what it calls a ‘top gap’. They use this term with reference to:

  • the number of top performers and the level of top performance in the US compared with other countries and
  • the gap in the US between the proportion of Black/Latino students and the proportion of all students achieving top levels of performance.

The authors discuss the colossal economic costs of achievement gaps more generally, but fail to extend this analysis to the ‘top gap’ specifically.

In 2010 ‘Mind the Other Gap: The Growing Excellence Gap in K-12 Education’ (Plucker, Burroughs and Song) was published – and seems to have been the first study to use this term.

The authors define such gaps straightforwardly as

‘Differences between subgroups of students performing at the highest levels of achievement’

The measures of high achievement deployed are the advanced standards on US NAEP maths and reading tests, at Grades 4 and 8 respectively.

The study identifies gaps based on four sets of learner characteristics:

  • Socio-economic status (eligible or not for free or reduced price lunch).
  • Ethnic background (White versus Black and/or Hispanic).
  • English language proficiency (what we in England would call EAL, compared with non-EAL).
  • Gender (girls versus boys).

Each characteristic is dealt with in isolation, so there is no discussion of the gaps between – for example – disadvantaged Black/Hispanic and disadvantaged White boys.

In relation to socio-economic achievement gaps, Plucker et al find that:

  • In Grade 4 maths, from 1996 to 2007, the proportion of advantaged learners achieving the advanced level increased by 5.6 percentage points, while the proportion of disadvantaged learners doing so increased by 1.2 percentage points. In Grade 8 maths, these percentage point changes were 5.7 and 0.8 percentage points respectively. Allowing for changes in the size of the advantaged and disadvantaged cohorts, excellence gaps are estimated to have widened by 4.1 percentage points in Grade 4 (to 7.3%) and 4.9 percentage points in Grade 8 (to 8.2%).
  • In Grade 4 reading, from 1998 to 2007, the proportion of advantaged learners achieving the advanced level increased by 1.2 percentage points, while the proportion of disadvantaged students doing so increased by 0.8 percentage points. In Grade 8 reading, these percentage point changes were almost negligible for both groups. The Grade 4 excellence gap is estimated to have increased slightly, by 0.4 percentage points (to 9.4%) whereas Grade 8 gaps have increased minimally by 0.2 percentage points (to 3.1%).

They observe that the size of excellence gaps are, at best, only moderately correlated with those at lower levels of achievement.

There is a weak relationship between gaps at basic and advanced level – indeed ‘smaller achievement gaps among minimally competent students is related to larger gaps among advanced students’ – but there is some inter-relationship between those at proficient and advanced level.

They conclude that, whereas No Child Left Behind (NCLB) helped to narrow achievement gaps, this does not extend to high achievers.

There is no substantive evidence that the NCLB focus on lower achievers has increased the excellence gap, although the majority of states surveyed by the NAGC felt that NCLB had diverted attention and resource away from gifted education.

In 2011 ‘Do High Fliers Maintain their Altitude?’ (Xiang et al 2011) provides a US analysis of whether individual students remain high achievers throughout their school careers.

They do not report outcomes for disadvantaged high achievers, but do consider briefly those attending schools with high and low proportions respectively of students eligible for free and reduced price lunches.

For this section of the report, high achievement is defined as ‘those whose math or reading scores placed them within the top ten per cent of their individual grades and schools’. Learners were tracked from Grades 3 to 5 and Grades 6 to 8.

It is described as exploratory, because the sample was not representative.

However:

‘High-achieving students attending high-poverty schools made about the same amount of academic growth over time as their high-achieving peers in low-poverty schools…It appears that the relationship between a school’s poverty rate and the growth of its highest-achieving students is weak. In other words, attending a low-poverty school adds little to the average high achiever’s prospects for growth.’

The wider study was criticised in a review by the NEPC, in part on the grounds that the results may have been distorted by regression to the mean, a shortcoming only briefly discussed in an appendix..

The following year saw the publication of Unlocking Emergent Talent: Supporting High Achievement of Low-Income, High-Ability Students (Olszewski-Kubilius and Clarenbach, 2012).

This is the report of a national summit on the issue convened in that year by the NAGC.

It follows Plucker (one of the summit participants) in using as its starting point,the achievement of advanced level on selected NAEP assessments by learners eligible for free and reduced price lunches.

But it also reports some additional outcomes for Grade 12 and for assessments of civics and writing:

  • ‘Since 1998, 1% or fewer of 4th-, 8th-, and 12th-grade free or reduced lunch students, compared to between 5% and 6% of non-eligible students scored at the advanced level on the NAEP civics exam.
  • Since 1998, 1% or fewer of free and reduced lunch program-eligible students scored at the advanced level on the eighth-grade NAEP writing exam while the percentage of non-eligible students who achieved advanced scores increased from 1% to 3%.’

The bulk of the report is devoted to identifying barriers to progress and offering recommendations for improving policy, practice and research. I provided an extended analysis in this post from May 2013.

Finally, ‘Talent on the Sidelines: Excellence Gaps and America’s Persistent Talent Underclass’ (Plucker, Hardesty and Burroughs 2013) is a follow-up to ‘Mind the Other Gap’.

It updates the findings in that report, as set out above:

  • In Grade 4 maths, from 1996 to 2011, the proportion of advantaged students scoring at the advanced level increased by 8.3 percentage points, while the proportion of disadvantaged learners doing so increased by 1.5 percentage points. At Grade 8, the comparable changes were 8.5 percentage points and 1.5 percentage points respectively. Excellence gaps have increased by 6.8 percentage points at Grade 4 (to 9.6%) and by 7 percentage points at Grade 8 (to 10.3%).
  • In Grade 4 reading, from 1998 to 2011, the proportion of advantaged students scoring at the advanced level increased by 2.6 percentage points, compared with an increase of 0.9 percentage points amongst disadvantaged learners. Grade 8 saw equivalent increases of 1.8 and 0.9 percentage points respectively. Excellence gaps are estimated to have increased at Grade 4 by 1.7 percentage points (to 10.7%) and marginally increased at Grade 8 by 0.9 percentage points (to 4.2%).

In short, many excellence gaps remain large and most continue to grow. The report’s recommendations are substantively the same as those put forward in 2010.


How Government education policy impacts on excellence gaps

Although many aspects of Government education policy may be expected to have some longer-term impact on raising the achievement of all learners, advantaged and disadvantaged alike, relatively few interventions are focused exclusively and directly on closing attainment gaps between advantaged and disadvantaged learners – and so have the potential to makes a significant difference to excellence gaps.

The most significant of these include:


The Pupil Premium:

In November 2010, the IPPR voiced concerns that the benefits of the pupil premium might not reach all those learners who attract it.

Accordingly they recommended that pupil premium should be allocated directly to those learners through an individual Pupil Premium Entitlement which might be used to support a menu of approved activities, including ‘one-to-one teaching to stretch the most able low income pupils’.

The recommendation has not been repeated and the present Government shows no sign of restricting schools’ freedom to use the premium in this manner.

However, the Blunkett Labour Policy Review ‘Putting students and parents first’ recommends that Labour in government should:

‘Assess the level and use of the Pupil Premium to ensure value for money, and that it is targeted to enhance the life chances of children facing the biggest challenges, whether from special needs or from the nature of the background and societal impact they have experienced.’

In February 2013 Ofsted reported that schools spending the pupil premium successfully to improve achievement:

‘Never confused eligibility for the Pupil Premium with low ability, and focused on supporting their disadvantaged pupils to achieve the highest levels’.

Conversely, where schools were less successful in spending the funding, they:

‘focused on pupils attaining the nationally expected level at the end of the key stage…but did not go beyond these expectations, so some more able eligible pupils underachieved.’

In July 2013, DfE’s Evaluation of Pupil Premium reported that, when deciding which disadvantaged pupils to target for support, the top criterion was ‘low attainment’ and was applied in 91% of primary schools and 88% of secondary schools.

In June 2013, in ‘The Most Able Students’, Ofsted reported that:

‘Pupil Premium funding was used in only a few instances to support the most able students who were known to be eligible for free school meals. The funding was generally spent on providing support for all underachieving and low-attaining students rather than on the most able students from disadvantaged backgrounds.’

Accordingly, it gave a commitment that:

‘Ofsted will… consider in more detail during inspection how well the pupil premium is used to support the most able students from disadvantaged backgrounds.’

However, this was not translated into the school inspection guidance.

The latest edition of the School Inspection Handbook says only:

‘Inspectors should pay particular attention to whether more able pupils in general and the most able pupils in particular are achieving as well as they should. For example, does a large enough proportion of those pupils who had the highest attainment at the end of Key Stage 2 in English and mathematics achieve A*/A GCSE grades in these subjects by the age of 16?

Inspectors should summarise the achievements of the most able pupils in a separate paragraph of the inspection report.’

There is no reference to the most able in parallel references to the pupil premium.

There has, however, been some progress in giving learners eligible for the pupil premium priority in admission to selective schools.

In May 2014, the TES reported that:

‘Thirty [grammar] schools have been given permission by the Department for Education to change their admissions policies already. The vast majority of these will introduce the changes for children starting school in September 2015…A small number – five or six – have already introduced the reform.’

The National Grammar Schools Association confirmed that:

‘A significant number of schools 38 have either adopted an FSM priority or consulted about doing so in the last admissions round. A further 59 are considering doing so in the next admissions round.’

In July 2014, the Government launched a consultation on the School Admissions Code which proposes extending to all state-funded schools the option to give priority in their admission arrangements to learners eligible for the pupil premium. This was previously open to academies and free schools via their funding agreements.


The Education Endowment Foundation (EEF)

The EEF describes itself as:

‘An independent grant-making charity dedicated to breaking the link between family income and educational achievement, ensuring that children from all backgrounds can fulfil their potential and make the most of their talents.’

The 2010 press release announcing its formation emphasised its role in raising standards in underperforming schools. This was reinforced by the Chairman in a TES article from June 2011:

‘So the target group for EEF-funded projects in its first couple of years are pupils eligible for free school meals in primary and secondary schools underneath the Government’s floor standards at key stages 2 and 4. That’s roughly 1,500 schools up and down the country. Projects can benefit other schools and pupils, as long as there is a significant focus on this core target group of the most needy young people in the most challenging schools.’

I have been unable to trace any formal departure from this position, though it no longer appears in this form in the Foundation’s guidance. The Funding FAQs say only:

‘In the case of projects involving the whole school, rather than targeted interventions, we would expect applicants to be willing to work with schools where the proportion of FSM-eligible pupils is well above the national average and/or with schools where FSM-eligible pupils are under-performing academically.’

I can find no EEF-funded projects that are exclusively or primarily focused on high-attaining disadvantaged learners, though a handful of its reports do refer to the impact on this group.


Changes to School Accountability Measures

As we have seen in Part one, the School Performance Tables currently provide very limited information about the performance of disadvantaged high achievers.

The July 2013 consultation document on primary assessment and accountability reform included a commitment to publish a series of headline measures in the tables including:

‘How many of the school’s pupils are among the highest-attaining nationally, by…showing the percentage of pupils attaining a high scaled score in each subject.’

Moreover, it added:

‘We will publish all the headline measures to show the attainment and progress of pupils for whom the school is in receipt of the pupil premium.’

Putting two and two together, this should mean that, from 2016, we will be able to see the percentage of pupil premium-eligible students achieving a high scaled score, though we do not yet know what ‘high scaled score’ means, nor do we know whether the data will be for English and maths separately or combined.

The October 2013 response to the secondary assessment and accountability consultation document fails to say explicitly whether excellence gap measures will be published in School Performance Tables.

It mentions that:

‘Schools will now be held to account for (a) the attainment of their disadvantaged pupils, (b) the progress made by their disadvantaged pupils, and (c) the in-school gap in attainment between disadvantaged pupils and their peers.’

Meanwhile a planned data portal will contain:

‘the percentage of pupils achieving the top grades in GCSEs’

but the interaction between these two elements, if any, remains unclear.

The March 2014 response to the consultation on post-16 accountability and assessment says:

‘We intend to develop measures covering all five headline indicators for students in 16-19 education who were in receipt of pupil premium funding in year 11.’

The post-16 headline measures include a new progress measure and an attainment measure showing the average points score across all level 3 qualifications.

It is expected that a destination measure will also be provided, as long as the methodology can be made sufficiently robust. The response says:

‘A more detailed breakdown of destinations data, such as entry to particular groups of universities, will continue to be published below the headline. This will include data at local authority level, so that destinations for students in the same area can be compared.’

and this should continue to distinguish the destinations of disadvantaged students.

Additional A level attainment measures – the average grade across the best three A levels and the achievement of AAB grades with at least two in facilitating subjects seem unlikely to be differentiated according to disadvantage.

There remains a possibility that much more excellence gap data, for primary, secondary and post-16, will be made available through the planned school portal, but no specification had been made public at the time of writing.

More worryingly, recent news reports have suggested that the IT project developing the portal and the ‘data warehouse’ behind it has been abandoned. The statements refer to coninuing to deliver ‘the school performance tables and associated services’ but there is no clarification of whether this latter phrase includes the portal. Given the absence of an official statement, one suspects the worst.


The Social Mobility and Child Poverty Commission (SMCPC)

The Commission was established with the expectation that it would ‘hold the Government’s feet to the fire’ to encourage progress on these two topics.

It publishes annual ‘state of the nation’ reports that are laid before Parliament and also undertakes ‘social mobility advocacy’.

The first annual report – already referenced in Part one – was published in November 2013. The second is due in October 2014.

The Chairman of the Commission was less than complimentary about the quality of the Government’s response to its first report, which made no reference to its comments about attainment gaps at higher grades. It remains to be seen whether the second will be taken any more seriously.

The Commission has already shown significant interest in disadvantaged high achievers – in June 2014 it published the study ‘Progress made by high-attaining children from disadvantaged backgrounds’ referenced above – so there is every chance that the topic will feature again in the 2014 annual report.

The Commission is of course strongly interested in the social mobility indicators and progress made against them, so may also include recommendations for how they might be adjusted to reflect changes to the schools accountability regime set out above.


Recommended reforms to close excellence gaps

Several proposals emerge from the commentary on current Government policy above:

  • It would be helpful to have further evaluation of the pupil premium to check whether high-achieving disadvantaged learners are receiving commensurate support. Schools need further guidance on ways in which they can use the premium to support high achievers. This should also be a focus for the pupil premium Champion and in pupil premium reviews.
  • Ofsted’s school inspection handbook requires revision to fulfil its commitment to focus on the most able in receipt of the premium. Inspectors also need guidance (published so schools can see it) to ensure common expectations are applied across institutions. These provisions should be extended to the post-16 inspection regime.
  • All selective secondary schools should be invited to prioritise pupil premium recipients in their admissions criteria, with the Government reserving the right to impose this on schools that do not comply voluntarily.
  • The Education Endowment Foundation should undertake targeted studies of interventions to close excellence gaps, but should also ensure that the impact on excellence gaps is mainstreamed in all the studies they fund. (This should be straightforward since their Chairman has already called for action on this front.)
  • The Government should consider the case for the inclusion of data on excellence gaps in all the headline measures in the primary, secondary and post-16 performance tables. Failing that, such data (percentages and numbers) should be readily accessible from a new data portal as soon as feasible, together with historical data of the same nature. (If the full-scale portal is no longer deliverable, a suitable alternative openly accessible database should be provided.) It should also publish annually a statistical analysis of all excellence gaps and the progress made towards closing them. As much progress as possible should be made before the new assessment and accountability regime is introduced. At least one excellence gap measure should be incorporated into revised DfE impact indicators and the social mobility indicators.
  • The Social Mobility and Child Poverty Commission (SMCPC) should routinely consider the progress made in closing excellence gaps within its annual report – and the Government should commit to consider seriously any recommendations they offer to improve such progress.

This leaves the question whether there should be a national programme dedicated to closing excellence gaps, and so improving fair access to competitive universities. (It makes excellent sense to combine these twin objectives and to draw on the resources available to support the latter.)

Much of the research above – whether it originates in the US or UK – argues for dedicated state/national programmes to tackle excellence gaps.

More recently, the Sutton Trust has published a Social Mobility Manifesto for 2015 which recommends that the next government should:

‘Reintroduce ring-fenced government funding to support the most able learners (roughly the top ten per cent) in maintained schools and academies from key stage three upwards. This funding could go further if schools were required to provide some level of match funding.

Develop an evidence base of effective approaches for highly able pupils and ensure training and development for teachers on how to challenge their most able pupils most effectively.

Make a concerted effort to lever in additional support from universities and other partners with expertise in catering for the brightest pupils, including through creating a national programme for highly able learners, delivered through a network of universities and accessible to every state-funded secondary school serving areas of disadvantage.’

This is not as clear as it might be about the balance between support for the most able and the most able disadvantaged respectively.

I have written extensively about what shape such a programme should have, most recently in the final section of ‘Digging Beneath the Destination Measures’ (July 2014).

The core would be:

‘A light touch framework that will supply the essential minimum scaffolding necessary to support effective market operation on the demand and supply sides simultaneously…

The centrepiece of the framework would be a structured typology or curriculum comprising the full range of knowledge, skills and understanding required by disadvantaged students to equip them for progression to selective higher education

  • On the demand side this would enable educational settings to adopt a consistent approach to needs identification across the 11-19 age range. Provision from 11-14 might be open to any disadvantaged learner wishing it to access it, but provision from 14 onwards would depend on continued success against challenging attainment targets.
  • On the supply side this would enable the full range of providers – including students’ own educational settings – to adopt a consistent approach to defining which knowledge, skills and understanding their various programmes and services are designed to impart. They would be able to qualify their definitions according to the age, characteristics, selectivity of intended destination and/or geographical location of the students they serve.

With advice from their educational settings, students would periodically identify their learning needs, reviewing the progress they had made towards personal targets and adjusting their priorities accordingly. They would select the programmes and services best matched to their needs….

…Each learner within the programme would have a personal budget dedicated to purchasing programmes and services with a cost attached. This would be fed from several sources including:

  • Their annual Pupil Premium allocation (currently £935 per year) up to Year 11.
  • A national fund fed by selective higher education institutions. This would collect a fixed minimum topslice from each institution’s outreach budget, supplemented by an annual levy on those failing to meet demanding new fair access targets. (Institutions would also be incentivised to offer programmes and services with no cost attached.)
  • Philanthropic support, bursaries, scholarships, sponsorships and in-kind support sourced from business, charities, higher education, independent schools and parents. Economic conditions permitting, the Government might offer to match any income generated from these sources.’


Close

We know far too little than we should about the size of excellence gaps in England – and whether or not progress is being made in closing them.

I hope that this post makes some small contribution towards rectifying matters, even though the key finding is that the picture is fragmented and extremely sketchy.

Rudimentary as it is, this survey should provide a baseline of sorts, enabling us to judge more easily what additional information is required and how we might begin to frame effective practice, whether at institutional or national level.


GP

September 2014

Closing England’s Excellence Gaps: Part One

This post examines what we know – and do not know – about high attainment gaps between learners from advantaged and disadvantaged backgrounds in England.

Mind the Gap by Clicsouris

Mind the Gap by Clicsouris

It assesses the capacity of current national education policy to close these gaps and recommends further action to improve the prospects of doing so rapidly and efficiently.

Because the post is extremely long I have divided it into two parts.

Part one comprises:

  • A working definition for the English context, explanation of the significance of excellence gaps, description of how this post relates to earlier material and provisional development of the theoretical model articulated in those earlier posts.
  • A summary of the headline data on socio-economic attainment gaps in England, followed by a review of published data relevant to excellence gaps at primary, secondary and post-16 levels.

Part two contains:

  • A distillation of research evidence, including material on whether disadvantaged high attainers remain so, international comparisons studies and research derived from them, and literature covering excellence gaps in the USA.
  • A brief review of how present Government policy might be expected to impact directly on excellence gaps, especially via the Pupil Premium, school accountability measures, the Education Endowment Foundation (EEF) and the Social Mobility and Child Poverty Commission (SMCPC). I have left to one side the wider set of reforms that might have an indirect and/or longer-term impact.
  • Some recommendations for strengthening our collective capacity to quantify address and ultimately close excellence gaps.

The post is intended to synthesise, supplement and update earlier material, so providing a baseline for further analysis – and ultimately consideration of further national policy intervention, whether under the present Government or a subsequent administration.

It does not discuss the economic and social origins of educational disadvantage, or the merits of wider policy to eliminate poverty and strengthen social mobility.

It starts from the premiss that, while education reform cannot eliminate the effects of disadvantage, it can make a significant, positive contribution by improving significantly the life chances of disadvantaged learners.

It does not debate the fundamental principle that, when prioritising educational support to improve the life chances of learners from disadvantaged backgrounds, governments should not discriminate on the basis of ability or prior attainment.

It assumes that optimal policies will deliver improvement for all disadvantaged learners, regardless of their starting point. It suggests, however, that intervention strategies should aim for equilibrium, prioritising gaps that are furthest away from it and taking account of several different variables in the process.


A working definition for the English context

The literature in Part two reveals that there is no accepted universal definition of excellence gaps, so I have developed my own England-specific working definition for the purposes of this post.

An excellence gap is:

‘The difference between the percentage of disadvantaged learners who reach a specified age- or stage-related threshold of high achievement – or who secure the requisite progress between two such thresholds – and the percentage of all other eligible learners that do so.’

This demands further clarification of what typically constitutes a disadvantaged learner and a threshold of high achievement.

In the English context, the measures of disadvantage with the most currency are FSM eligibility (eligible for and receiving free school meals) and eligibility for the deprivation element of the pupil premium (eligible for and receiving FSM at some point in the preceding six years – often called ‘ever 6’).

Throughout this post, for the sake of clarity, I have given priority to the former over the latter, except where the former is not available.

The foregrounded characteristic is socio-economic disadvantage, but this does not preclude analysis of the differential achievement of sub-groups defined according to secondary characteristics including gender, ethnic background and learning English as an additional language (EAL) – as well as multiple combinations of these.

Some research is focused on ‘socio-economic gradients’, which show how gaps vary at different points of the achievement distribution on a given assessment.

The appropriate thresholds of high achievement are most likely to be measured through national assessments of pupil attainment, notably end of KS2 tests (typically Year 6, age 11), GCSE and equivalent examinations (typically Year 11, age 16) and A level and equivalent examinations (typically Year 13, age 18).

Alternative thresholds of high achievement may be derived from international assessments, such as PISA, TIMSS or PIRLS.

Occasionally – and especially in the case of these international studies – an achievement threshold is statistically derived, in the form of a percentile range of performance, rather than with reference to a particular grade, level or score. I have not allowed for this within the working definition.

Progress measures typically relate to the distance travelled between: baseline assessment (currently at the end of KS1 – Year 2, age 7 – but scheduled to move to Year R, age 4) and end of KS2 tests; or between KS2 tests and the end of KS4 (GCSE); or between GCSE and the end of KS5 (Level 3/A level).

Some studies extend the concept of progress between two thresholds to a longitudinal approach that traces how disadvantaged learners who achieve a particular threshold perform throughout their school careers – do they sustain early success, or fall away, and what proportion are ‘late bloomers’?


Why are excellence gaps important?

Excellence gaps are important for two different sets of reasons: those applying to all achievement gaps and those which apply more specifically or substantively to excellence gaps.

Under the first heading:

  • The goal of education should be to provide all learners, including disadvantaged learners, with the opportunity to maximise their educational potential, so eliminating ‘the soft bigotry of low expectations’.
  • Schools should be ‘engines of social mobility’, helping disadvantaged learners to overcome their backgrounds and compete equally with their more advantaged peers.
  • International comparisons studies reveal that the most successful education systems can and do raise attainment for all and close socio-economic achievement gaps simultaneously.
  • There is a strong economic case for reducing – and ideally eradicating – underachievement attributable to disadvantage.

Under the second heading:

  • An exclusive or predominant focus on gaps at the lower end of the attainment distribution is fundamentally inequitable and tends to reinforce the ‘soft bigotry of low expectations’.
  • Disadvantaged learners benefit from successful role models – predecessors or peers from a similar background who have achieved highly and are reaping the benefits.
  • An economic imperative to increase the supply of highly-skilled labour will place greater emphasis on the top end of the achievement distribution. Some argue that there is a ‘smart fraction’ tying national economic growth to a country’s stock of high achievers. There may be additional spin-off benefits from increasing the supply of scientists, writers, artists, or even politicians!
  • The most highly educated disadvantaged learners are least likely to confer disadvantage on their children, so improving the proportion of such learners may tend to improve inter-generational social mobility.

Excellence gaps are rarely identified as such – the term is not yet in common usage in UK education, though it has greater currency in the US. Regardless of terminology, they rarely receive attention, either as part of a wider set of achievement gaps, or separately in their own right.


Relationship with earlier posts

Since this blog was founded in April 2010 I have written extensively about excellence gaps and how to address them.

The most pertinent of my previous posts are:

I have also written about excellence gaps in New Zealand – Part 1 and Part 2 (June 2012) – but do not draw on that material here.

Gifted education (or apply your alternative term) is amongst those education policy areas most strongly influenced by political and ideological views on the preferred balance between excellence and equity. This is particularly true of decisions about how best to address excellence gaps.

The excellence-equity trade-off was identified in my first post (May 2010) as one of three fundamental polarities that determine the nature of gifted education and provide the basis for most discussion about what form it should take.

The Gifted Phoenix Manifesto for Gifted Education (March 2013) highlighted their significance thus:

‘Gifted education is about balancing excellence and equity. That means raising standards for all while also raising standards faster for those from disadvantaged backgrounds.

Through combined support for excellence and equity we can significantly increase our national stock of high level human capital and so improve economic growth…

…Excellence in gifted education is about maximising the proportion of high achievers reaching advanced international benchmarks (eg PISA, TIMSS and PIRLS) so increasing the ‘smart fraction’ which contributes to economic growth.

Equity in gifted education is about narrowing (and ideally eliminating) the excellence gap between high achievers from advantaged and disadvantaged backgrounds (which may be attributable in part to causes other than poverty). This also increases the proportion of high achievers, so building the ‘smart fraction’ and contributing to economic growth.’

More recently, one of the 10 draft core principles I set out in ‘Why Can’t We Have National Consensus on Educating High Attainers?’ (June 2014) said:

‘We must pursue simultaneously the twin priorities of raising standards and closing gaps. We must give higher priority to all disadvantaged learners, regardless of their prior achievement. Standards should continue to rise amongst all high achievers, but they should rise faster amongst disadvantaged high achievers. This makes a valuable contribution to social mobility.’


This model provisionally developed

Using my working definition as a starting point, this section describes a theoretical model showing how excellence and equity are brought to bear when considering excellence gaps – and then how best to address them.

This should be applicable at any level, from a single school to a national education system and all points in between.

The model depends on securing the optimal balance between excellence and equity where:

  • Excellence is focused on increasing the proportion of all learners who achieve highly and, where necessary, increasing the pitch of high achievement thresholds to remove unhelpful ceiling effects. The thresholds in question may be nationally or internationally determined and are most likely to register high attainment through a formal assessment process. (This may be extended so there is complementary emphasis on increasing the proportion of high-achieving learners who make sufficiently strong progress between two different age- or stage-related thresholds.)
  • Equity is focused on increasing the proportion of high-achieving disadvantaged learners (and/or the proportion of disadvantaged learners making sufficiently strong progress) at a comparatively faster rate, so they form a progressively larger proportion of the overall high-achieving population, up to the point of equilibrium, where advantaged and disadvantaged learners are equally likely to achieve the relevant thresholds (and/or progress measure). This must be secured without deliberately repressing improvement amongst advantaged learners – ie by introducing policies designed explicitly to limit their achievement and/or progress relative to disadvantaged learners – but a decision to do nothing or to redistribute resources in favour of disadvantage is entirely permissible.

The optimal policy response will depend on the starting position and the progress achieved over time.

If excellence gaps are widening, the model suggests that interventions and resources should be concentrated in favour of equity. Policies should be reviewed and adjusted, or strengthened where necessary, to meet the desired objectives.

If excellence gaps are widening rapidly, this reallocation and adjustment process will be relatively more substantial (and probably more urgent) than if they are widening more slowly.

Slowly widening gaps will demand more reallocation and adjustment than a situation where gaps are stubbornly resistant to improvement, or else closing too slowly. But even in the latter case there should be some reallocation and adjustment until equilibrium is achieved.

When excellence gaps are already closing rapidly – and there are no overt policies in place to deliberately repress improvement amongst high-achieving advantaged learners – it may be that unintended pressures in the system are inadvertently bringing this about. In that case, policy and resources should be adjusted to correct these pressures and so restore the correct twin-speed improvement.

The aim is to achieve and sustain equilibrium, even beyond the point when excellence gaps are eliminated, so that they are not permitted to reappear.

If ‘reverse gaps’ begin to materialise, where disadvantaged learners consistently outperform their more advantaged peers, this also threatens equilibrium and would suggest a proportionate redistribution of effort towards excellence.

Such scenarios are most likely to occur in settings where there are a large proportion of learners that, while not disadvantaged according to the ‘cliff edge’ definition required to make the distinction, are still relatively disadvantaged.

Close attention must therefore be paid to the distribution of achievement across the full spectrum of disadvantage, to ensure that success at the extreme of the distribution does not mask significant underachievement elsewhere.

One should be able to determine a more precise policy response by considering a restricted set of variables. These include:

  • The size of the gaps at the start of the process and, associated with this, the time limit allowed for equilibrium to be reached. Clearly larger gaps are more likely to take longer to close. Policy makers may conclude that steady improvement over several years is more manageable for the system than a rapid sprint towards equilibrium. On the other hand, there may be benefits associated with pace and momentum.
  • The rate at which overall high achievement is improving. If this is relatively fast, the rate of improvement amongst advantaged high achievers will be correspondingly strong, so the rate for disadvantaged high achievers must be stronger still.
  • The variance between excellence gaps at different ages/stages. If the gaps are larger at particular stages of education, the pursuit of equilibrium suggests disproportionate attention is given to those so gaps are closed consistently. If excellence gaps are small for relatively young learners and increase with age, priority should be given to the latter, but there may be other factors in play, such as evidence that closing relatively small gaps at an early stage will have a more substantial ‘knock-on’ effect later on.
  • The level at which high achievement thresholds are pitched. Obviously this will influence the size of the gaps that need to be closed. But, other things being equal, enabling a higher proportion of learners to achieve a relatively high threshold will demand more intensive support. On the other hand, relatively fewer learners – whether advantaged or disadvantaged – are likely to be successful. Does one need to move a few learners a big distance or a larger proportion a smaller one?
  • Whether or not gaps at lower achievement thresholds are smaller and/or closing at a faster rate. If so, there is a strong case for securing parity of progress at higher and lower thresholds alike. On the other hand, if excellence gaps are closing more quickly, it may be appropriate to reallocate resources away from them and towards lower levels of achievement.
  • The relative size of the overall disadvantaged population, the associated economic gap between advantage and disadvantage and (as suggested above) the distribution in relation to the cut-off. If the definition of disadvantage is pitched relatively low (ie somewhat disadvantaged), the disadvantaged population will be correspondingly large, but the economic gap between advantage and disadvantage will be relatively small. If the definition is pitched relatively high (ie very disadvantaged) the reverse will be true, giving a comparatively small disadvantaged population but a larger gap between advantage and disadvantage.
  • The proportion of the disadvantaged population that is realistically within reach of the specified high achievement benchmarks. This variable is a matter of educational philosophy. There is merit in an inclusive approach – indeed it seems preferable to overestimate this proportion than the reverse. Extreme care should be taken not to discourage late developers or close off opportunities on the basis of comparatively low current attainment, so reinforcing existing gaps through unhelpfully low expectations. On the other hand, supporting unrealistically high expectations may be equally damaging and ultimately waste scarce resources. There may be more evidence to support such distinctions with older learners than with their younger peers. 


How big are England’s headline attainment gaps and how fast are they closing?

Closing socio-economic achievement gaps has been central to English educational policy for the last two decades, including under the current Coalition Government and its Labour predecessor.

It will remain an important priority for the next Government, regardless of the outcome of the 2015 General Election.

The present Government cites ‘Raising the achievement of disadvantaged children’ as one of ten schools policies it is pursuing.

The policy description describes the issue thus:

‘Children from disadvantaged backgrounds are far less likely to get good GCSE results. Attainment statistics published in January 2014 show that in 2013 37.9% of pupils who qualified for free school meals got 5 GCSEs, including English and mathematics at A* to C, compared with 64.6% of pupils who do not qualify.

We believe it is unacceptable for children’s success to be determined by their social circumstances. We intend to raise levels of achievement for all disadvantaged pupils and to close the gap between disadvantaged children and their peers.’

The DfE’s input and impact indicators  – showing progress against the priorities set out in its business plan – do not feature the measure mentioned in the policy description (which is actually five or more GCSEs at Grades A*-C or equivalents, including GCSEs in English and maths).

The gap on this measure was 27.7% in 2009, improving to 26.7% in 2013, so there has been a small 1.0 percentage point improvement over five years, spanning the last half of the previous Government’s term in office and the first half of this Government’s term.

Instead the impact indicators include three narrower measures focused on closing the attainment gap between free school meal pupils and their peers, at 11, 16 and 19 respectively:

  • Impact Indicator 7 compares the percentages of FSM-eligible and all other pupils achieving level 4 or above in KS2 assessment of reading, writing and maths. The 2013 gap is 18.7%, down 0.4% from 19.1% in 2012.
  • Impact Indicator 8 compares the percentages of FSM-eligible and all other pupils achieving A*-C grades in GCSE maths and English. The 2013 gap is 26.5%, up 0.3% from 26.2% in 2012.
  • Impact Indicator 9 compares the percentages of learners who were FSM-eligible at age 15 and all other learners who attain a level 3 qualification by the end of the academic year in which they are 19. The 2013 gap is 24.3%, up 0.1% from 24.2% in 2012.

These small changes, not always pointing in the right direction, reflect the longer term narrative, as is evident from the Government’s Social Mobility Indicators which also incorporate these three measures.

  • In 2005-06 the KS2 L4 maths and English gap was 25.0%, so there has been a fairly substantial 6.3 percentage point reduction over seven years, but only about one quarter of the gap has been closed.
  • In 2007-08 the KS4 GCSE maths and English gap was 28.0%, so there has been a minimal 1.5 percentage point reduction over six years, equivalent to annual national progress of 0.25 percentage points per year. At that rate it will take another century to complete the process.
  • In 2004-05 the Level 3 qualification gap was 26.4%, so there has been a very similar 2.1 percentage point reduction over 8 years.

The DfE impact indicators also include a set of three destination measures that track the percentage of FSM learners progressing to Oxford and Cambridge, any Russell Group university and any university.

There is a significant time lag with all of these – the most recent available data relates to 2011/2012 – and only two years of data have been collected.

All show an upward trend. Oxbridge is up from 0.1% to 0.2%, Russell Group up from 3% to 4% and any university up from 45% to 47% – actually a 2.5 percentage point improvement.

The Oxbridge numbers are so small that a percentage measure is a rather misleading indicator of marginal improvement from a desperately low base.

It is important to note that forthcoming changes to the assessment regime will impose a different set of headline indicators at ages 11 and 16 that will not be comparable with these.

From 2014 significant methodological adjustments are being introduced to School Performance Tables that significantly restrict the range of qualifications equivalent to GCSEs. Only the first entry in each subject will count for Performance Table purposes, this applying to English Baccalaureate subjects in 2014 and then all subjects in 2015.

Both these factors will tend to depress overall results and may be expected to widen attainment gaps on the headline KS4 measure as well as the oft-cited 5+ GCSEs measure.

From 2016 new baseline assessments, the introduction of scaled scores at the end of KS2 and a new GCSE grading system will add a further layer of change.

As a consequence there will be substantial revisions to the headline measures in Primary, Secondary and Post-16 Performance Tables. The latter will include destination measures, provided they can be made methodologically sound.

At the time of writing, the Government has made negligible reference to the impact of these reforms on national measures of progress, including its own Impact Indicators and the parallel Social Mobility indicators, though the latter are reportedly under review.


Published data on English excellence gaps

The following sections summarise what data I can find in the public domain about excellence gaps at primary (KS2), secondary (KS4) and post-16 (KS5) respectively.

I have cited the most recent data derivable from Government statistical releases and performance tables, supplemented by other interesting findings gleaned from research and commentary.


Primary (KS2) 

The most recent national data is contained in SFR51/2013: National Curriculum Assessments at Key Stage 2: 2012 to 2013. This provides limited information about the differential performance of learners eligible for and receiving FSM (which I have referred to as ‘FSM’), and for those known to be eligible for FSM at any point from Years 1 to 6 (known as ‘ever 6’ and describing those in receipt of the Pupil Premium on grounds of deprivation).

There is also additional information in the 2013 Primary School Performance Tables, where the term ‘disadvantaged’ is used to describe ‘ever 6’ learners and ‘children looked after’.

There is comparably little variation between these different sets of figures at national level. In the analysis below (and in the subsequent section on KS4) I have used FSM data wherever possible, but have substituted ‘disadvantaged’ data where FSM is not available.  All figures apply to state-funded schools only.

I have used Level 5 and above as the best available proxy for high attainment. Some Level 6 data is available, but in percentages only, and these are all so small that comparisons are misleading.

The Performance Tables distinguish a subset of high attainers, on the basis of prior attainment (at KS1 for KS2 and at KS2 for KS4) but no information is provided about the differential performance of advantaged and disadvantaged high attainers.

In 2013:

  • 21% of all pupils achieved Level 5 or above in reading, writing and maths combined, but only 10% of FSM pupils did so, compared with 26% of others, giving an attainment gap of 16%. The comparable gap at Level 4B (in reading and maths and L4 in writing) was 18%. At Level 4 (across the board) it was 20%. In this case, the gaps are slightly larger at lower attainment levels but, whereas the L4 gap has narrowed by 1% since 2012, the L5 gap has widened by 1%.
  • In reading, 44% of all pupils achieved Level 5 and above, but only 21% of FSM pupils did so, compared with 48% of others, giving an attainment gap of 21%. The comparable gap at Level 4 and above was eight percentage points lower at 13%.
  • In writing (teacher assessment), 31% of all pupils achieved level 5 and above, but only 15% of FSM pupils did so, compared with 34% of others, giving an attainment gap of 19%. The comparable gap at Level 4 and above was three percentage points lower at 16%.
  • In grammar, punctuation and spelling (GPS), 47% of all pupils achieved Level 5 and above, but only 31% of FSM pupils did so, compared with 51% of others, giving an attainment gap of 20%. The comparable gap at Level 4 and above was two percentage points lower at 18%.
  • In maths, 41% of pupils in state-funded schools achieved Level 5 and above, up 2% on 2012. But only 24% of FSM pupils achieved this compared with 44% of others, giving an attainment gap of 20%. The comparable gap at level 4 and above is 13%.

Chart 1 shows these outcomes graphically. In four cases out of five, the gap at the higher attainment level is greater, substantially so in reading and maths. All the Level 5 gaps fall between 16% and 20%.


Ex gap table 1

Chart 1: Percentage point gaps between FSM and all other pupils’ attainment at KS2 L4 and above and KS2 L5 and above, 2013 


It is difficult to trace reliably the progress made in reducing these gaps in English, since the measures have changed frequently. There has been more stability in maths, however, and the data reveals that – whereas the FSM gap at Level 4 and above has reduced by 5 percentage points since 2008 (from 18 points to 13 points) – the FSM gap at Level 5 and above has remained between 19 and 20 points throughout. Hence the gap between L4+ and L5+ on this measure has increased in the last five years.

There is relatively little published about KS2 excellence gaps elsewhere, though one older Government publication, a DfES Statistical Bulletin: The characteristics of high attainers (2007) offers a small insight.

It defines KS2 high attainers as the top 10%, on the basis of finely grained average points scores across English, maths and science, so a more selective but wider-ranging definition than any of the descriptors of Level 5 performance above.

According to this measure, some 2.7% of FSM-eligible pupils were high attainers in 2006, compared with 11.6% of non-FSM pupils, giving a gap of 8.9 percentage points.

The Bulletin supplies further analysis of this population of high attainers, summarised in the table reproduced below.


EX Gap Capture 1 


Secondary (KS4) 

While Government statistical releases provide at least limited data about FSM performance at high levels in end of KS2 assessments, this is entirely absent from KS4 data, because there is no information about the achievement of GCSE grades above C, whether for single subjects or combinations.

The most recent publication: SFR05/2014: GCSE and equivalent attainment by pupil characteristics, offers a multitude of measures based on Grades G and above or C and above, many of which are set out in Chart 2, which illustrates the FSM gap on each, organised in order from the smallest gap to the biggest.

(The gap cited here for A*-C grades in English and maths GCSEs is very slightly different to the figure in the impact indicator.)


Ex gap table 2

Chart 2: Percentage point gaps between FSM and all other pupils’ attainment on different KS4 measures, 2013


In its State of the Nation Report 2013, the Social Mobility and Child Poverty Commission included a table comparing regional performance on a significantly more demanding ‘8+ GCSEs excluding equivalents and including English and maths’ measure. This uses ‘ever 6’ rather than FSM as the indicator of disadvantage.

The relevant table is reproduced below. It shows regional gaps of between 20 and 26 percentage points on the tougher measure, so a similar order of magnitude to the national indicators at the top end of Chart 2.


ExGap 2 Capture


Comparing the two measures, one can see that:

  • The percentages of ‘ever 6’ learners achieving the more demanding measure are very much lower than the comparable percentages achieving the 5+ GCSEs measure, but the same is also true of their more advantaged peers.
  • Consequently, in every region but London and the West Midlands, the attainment gap is actually larger for the less demanding measure.
  • In London, the gaps are much closer, at 19.1 percentage points on the 5+ measure and 20.9 percentage points on the 8+ measure. In the West Midlands, the gap on the 8+ measure is larger by five percentage points. In all other cases, the difference is at least six percentage points in the other direction.

We do not really understand the reasons why London and the West Midlands are atypical in this respect.

The Characteristics of High Attainers (2007) provides a comparable analysis for KS4 to that already referenced at KS2. In this case, the top 10% of high attainers is derived on the basis of capped GCSE scores.

This gives a gap of 8.8 percentage points between the proportion of non-FSM (11.2%) and FSM (2.4%) students within the defined population, very similar to the parallel calculation at KS2.

Other variables within this population are set out in the table reproduced below.


ExGap Capture 3

Finally, miscellaneous data has also appeared from time to time in the answers to Parliamentary Questions. For example:

  • In 2003, 1.0% of FSM-eligible learners achieved five or more GCSEs at A*/A including English and maths but excluding equivalents, compared with 6.8% of those not eligible, giving a gap of 5.8 percentage points. By 2009 the comparable percentages were 1.7% and 9.0% respectively, resulting in an increased gap of 7.3 percentage points (Col 568W)
  • In 2006/07, the percentage of FSM-eligible pupils securing A*/A grades at GCSE in different subjects, compared with the percentage of all pupils in maintained schools doing so were as shown in the table below (Col 808W)
FSM All pupils Gap
Maths 3.7 15.6 11.9
Eng lit 4.1 20.0 15.9
Eng lang 3.5 16.4 12.9
Physics 2.2 49.0 46.8
Chemistry 2.5 48.4 45.9
Biology 2.5 46.8 44.3
French 3.5 22.9 19.4
German 2.8 23.2 20.4

Table 1: Percentage of FSM-eligible and all pupils achieving GCSE A*/A grades in different GCSE subjects in 2007

  • In 2008, 1% of FSM-eligible learners in maintained schools achieved A* in GCSE maths compared with 4% of all pupils in maintained schools. The comparable percentages for Grade A were 3% and 10% respectively, giving an A*/A gap of 10 percentage points (Col 488W)


Post-16 (KS5)

The most recent post-16 attainment data is provided in SFR10/2014: Level 2 and 3 attainment by young people aged 19 in 2013 and SFR02/14: A level and other level 3 results: academic year 2012 to 2013.

The latter contains a variety of high attainment measures – 3+ A*/A grades;  AAB grades or better; AAB grades or better with at least two in facilitating subjects;  AAB grades or better, all in facilitating subjects – yet none of them distinguish success rates for advantaged and disadvantaged learners.

The former does includes a table which provides a time series of gaps for achievement of Level 3 at age 19 through 2 A levels or the International Baccalaureate. The measure of disadvantage is FSM-eligibility in Year 11. The gap was 22.0 percentage points in 2013, virtually unchanged from 22.7 percentage points in 2005.

In (How) did New Labour narrow the achievement and participation gap (Whitty and Anders, 2014) the authors reproduce a chart from a DfE roundtable event held in March 2013 (on page 44).

This is designed to show how FSM gaps vary across key stages and also provides ‘odds ratios’ – the relative chances of FSM and other pupils achieving each measure. It relies on 2012 outcomes.

The quality of the reproduction is poor, but it seems to suggest that, using the AAB+ in at least two facilitating subjects measure, there is a five percentage point gap between FSM students and others (3% versus 8%), while the odds ratio shows that non-FSM students are 2.9 times more likely than FSM students to achieve this outcome.

Once again, occasional replies to Parliamentary Questions provide some supplementary information:

  • In 2007, 189 FSM-eligible students (3.7%) in maintained mainstream schools (so excluding sixth form colleges and FE colleges) achieved 3 A grades at A level. This compared with 13,467 other students (9.5%) giving a gap of 5.8 percentage points (Source: Parliamentary Question, 26 November 2008, Hansard (Col 1859W)
  • In 2008, 160 students (3.5%) eligible for FSM achieved that outcome. This compares with 14,431 (10.5%) of those not eligible for FSM, giving a gap of 7.0 percentage points. The figures relate to 16-18 year-olds, in maintained schools only, who were eligible for FSM at age 16. They do not include students in FE sector colleges (including sixth form colleges) who were previously eligible for FSM. Only students who entered at least one A level, applied A level or double award qualification are counted. (Parliamentary Question, 6 April 2010, Hansard (Col 1346W))
  • Of pupils entering at least one A level in 2010/11 and eligible for FSM at the end of Year 11, 546 (4.1%) achieved 3 or more GCE A levels at A*-A compared with 22,353 other pupils (10.6%) so giving a gap of 6.5 percentage points. These figures include students in both the schools and FE sectors. (Parliamentary Question, 9 July 2012, Hansard (Col 35W)) 

 In September 2014, a DfE response to a Freedom of Information request provided some additional data about FSM gaps at A level over the period from 2009 to 2013. This is set out in the table below, which records the gaps between FSM and all other pupils, presumably for all schools and colleges, whether or not state-funded.

Apart from the atypical result for the top indicator in 2010, all these percentages fall in the range 6.0% to 10%, so are in line with the sources above.


2009 2010 2011 2012 2013
3+ grades at A*/A or applied single/double award 9.0 12.8 9.3 8.7 8.3
AAB+ grades in facilitating subjects 6.3 6.2
AAB+ grades at least 2 in facilitating subjects 9.8


Additional evidence of Key Stage excellence gaps from a sample born in 1991

In Progress made by high-achieving children from disadvantaged backgrounds (Crawford, Macmillan and Vignoles, 2014) provides useful data on the size of excellence gaps at different key stages, as well as analysis of whether disadvantaged high achievers remain so through their school careers.

The latter appears in Part two, but the first set of findings provides a useful supplement to the broad picture set out above.

This study is based on a sample of learners born in 1991/1992, so they would presumably have taken end of KS2 tests in 2002, GCSEs in 2007 and A levels in 2009. It includes all children who attended a state primary school, including those who subsequently attended an independent secondary school.

It utilises a variety of measures of disadvantage, including whether learners were always FSM-eligible (in Years 7-11), or ‘ever FSM’ during that period. This summary focuses on the distinction between ‘always FSM’ and ‘never FSM’.

It selects a basket of high attainment measures spread across the key stages, including:

  • At KS1, achieving Level 3 or above in reading and maths.
  • At KS2, achieving Level 5 or above in English and maths.
  • At KS4, achieving six or more GCSEs at grades A*-C in EBacc subjects (as well as five or more).
  • At KS5, achieving two or more (and three or more) A levels at grades A-B in any subjects.
  • Also at KS5, achieving two or more (and three or more) A levels at grades A-B in facilitating subjects.

The choice of measures at KS2 and KS5 is reasonable, reflecting the data available at the time. For example, one assumes that A* grades at A level do not feature in the KS5 measures since they were not introduced until 2010).

At KS4, the selection is rather more puzzling and idiosyncratic. It would have been preferable to have included at least one measure based on performance across a range of GCSEs at grades A*-B or A*/A.

The authors justify their decision on the basis that ‘there is no consensus on what is considered high attainment’, even though most commentators would expect this to reflect higher grade performance, while few are likely to define it solely in terms of breadth of study across a prescribed set of ‘mainstream’ subjects.

Outcomes for ‘always FSM’ and ‘never FSM’ on the eight measures listed above are presented in Chart 3.

Ex gap Table 3

Chart 3: Achievement of ‘always FSM’ and ‘never FSM’ on a basket of high attainment measures for pupils born in 1991/92


This reveals gaps of 12 to 13 percentage points at Key Stages 1 and 2, somewhat smaller than several of those described above.

It is particularly notable that the 2013 gap for KS2 L5 reading, writing and maths is 16 percentage points, whereas the almost comparable 2002 (?) gap for KS2 English and maths amongst this sample is 13.5%. Even allowing for comparability issues, there may tentative evidence here to suggest widening excellence gaps at KS2 over the last decade.

The KS4 gaps are significantly larger than those existing at KS1/2, at 27 and 18 percentage points respectively. But comparison with the previous evidence reinforces the point that the size of the gaps in this sample is attributable to subject mix: this must be the case since the grade expectation is no higher than C.

The data for A*/A performance on five or more GCSEs set out above, which does not insist on coverage of EBacc subjects other than English and maths, suggests a gap of around seven percentage points. But it also demonstrates big gaps – again at A*/A – for achievement in single subjects, especially the separate sciences.

The KS5 gaps on this sample range from 2.5 to 13 percentage points. We cited data above suggesting a five percentage point gap in 2012 for AAB+, at least two in facilitating subjects. These findings do not seem wildly out of kilter with that, or with the evidence of gaps of around six to seven percentage points for AAA grades or higher.


Overall pattern 

The published data provides a beguiling glimpse of the size of excellence gaps and how they compare with FSM gaps on the key national benchmarks.

But discerning the pattern is like trying to understand the picture on a jigsaw when the majority of pieces are missing.

The received wisdom is capture in the observation by Whitty and Anders that:

‘Even though the attainment gap in schools has narrowed overall, it is largest for the elite measures’

and the SMCPC’s comment that:

‘…the system is better at lifting children eligible for FSM above a basic competence level (getting 5A*–C) than getting them above a tougher level of attainment likely to secure access to top universities.’

This seems broadly true, but the detailed picture is rather more complicated.

  • At KS2 there are gaps at L5 and above of around 16-20 percentage points, the majority higher than the comparable gaps at L4. But the gaps for core subjects combined are smaller than for each assessment. There is tentative evidence that the former may be widening.
  • At KS4 there are very significant differences between results in individual subjects. When it comes to multi-subject indicators, differences in the choice of subject mix – as well as choice of grade – make it extremely difficult to draw even the most tentative conclusions about the size of excellence gaps and how they relate to benchmark-related gaps at KS4 and excellence gaps at KS2.
  • At KS5, the limited evidence suggests that A level excellence gaps at the highest grades are broadly similar to those at GCSE A*/A. If anything, gaps seem to narrow slightly compared with KS4. But the confusion over KS4 measures makes this impossible to verify.

We desperately need access to a more complete dataset so we can understand these relationships more clearly.

This is the end of Part one. In Part two, we move on to consider evidence about whether high attainers remain so, before examining international comparisons data and related research, followed by excellence gaps analysis from the USA.

Part two concludes with a short review of how present government policy impacts on excellence gaps and some recommendations for strengthening the present arrangements.


GP

September 2014