.
 This post takes a closer look at Maths Hubs, exploring the nature of the model, their early history and performance to date.
It reflects on their potential contribution to the education of the ‘mathematically most able’ and considers whether a similar model might support ‘most able education’.
.
.
Background
.
Origins of this post
The post was prompted by the potential connection between two separate stimuli:
- A little-noticed commitment in the Conservative Election Manifesto:
‘We aim to make Britain the best place in the world to study maths, science and engineering, measured by improved performance in the PISA league tables….We will make sure that all students are pushed to achieve their potential and create more opportunities to stretch the most able.’
- My own recent post on Missing Talent (June 2015) which discussed the Sutton Trust/education datalab recommendation that:
‘Schools where highly able pupils currently underperform should be supported through the designation of another local exemplar school…
Exemplar schools…should be invited to consider whether they are able to deliver a programme of extra-curricular support to raise horizons and aspirations for children living in the wider area.’
The second led to a brief Twitter discussion about parallels with an earlier initiative during which Maths Hubs were mentioned.
.
.
Links to previous posts
I touched on Maths Hubs once before, in the final section of 16-19 Maths Free Schools Revisited (October 2014) which dealt with ‘prospects for the national maths talent pipeline’.
This reviewed the panoply of bodies involved in maths education at national level and the potential advantages of investing in a network with genuinely national reach, rather than in a handful of new institutions with small localised intakes and limited capacity for outreach:
‘Not to put to finer point on it, there are too many cooks. No single body is in charge; none has lead responsibility for developing the talent pipeline…
The recent introduction of maths hubs might have been intended to bring some much-needed clarity to a complex set of relationships at local, regional and national levels. But the hubs seem to be adding to the complexity by running even more new projects, starting with a Shanghai Teacher Exchange Programme.
A network-driven approach to talent development might just work…but it must be designed to deliver a set of shared strategic objectives. Someone authoritative needs to hold the ring.
What a pity there wasn’t a mechanism to vire the £72m capital budget for 12 free schools into a pot devoted to this end. For, as things stand, it seems that up to £12m will have been spent on two institutions with a combined annual cohort of 120 students, while a further £60m may have to be surrendered back to the Treasury.’
Two further posts are less directly relevant but ought to be mentioned in passing:
- Maths Mastery: Evidence versus spin (February 2015) and
- A digression on breadth, depth, pace and mastery (April 2015)
The second in particular raises questions about the suitability of NCETM’s version of mastery for our high attaining learners, arguing that essential groundwork has been neglected and that the present approach to ‘stretch and challenge’ is unnecessarily narrow and restrictive.
.
Structure of this post
The remainder of this post is divided into three principal sections:
- Material about the introduction of Maths Hubs and a detailed exploration of the model. This takes up approximately half of the post.
- A review of the Hubs’ work programme and the progress they have made during their first year of operation.
- Proposals for Maths Hubs to take the lead in improving the education of mathematically able learners and for the potential introduction of ‘most able hubs’ to support high attainers more generally. I stop short of potential reform of the entire ‘national maths talent pipeline’ since that is beyond the scope of this post.
Since readers may not be equally interested in all these sections I have supplied the customary page jumps from each of the bullet points above and to the Conclusion, for those who prefer to cut to the chase.
.
The introduction of the Maths Hubs model
.
Initial vision
Maths Hubs were first announced in a DfE press release published in December 2013.
The opening paragraph describes the core purpose as improving teacher quality:
‘Education Minister Elizabeth Truss today announced £11 million for new maths hubs to drive up the quality of maths teachers – as international test results showed England’s performance had stagnated.’
The press release explains the Coalition Government’s plans to introduce a national network of some 30 ‘mathematics education strategic hubs’ (MESH) each led by a teaching school.
A variety of local strategic partners will be drawn into each hub, including teaching school alliances, other ‘school and college groupings’, university faculties, subject associations, ‘appropriate’ local employers and local representatives of national maths initiatives.
There is an expectation that all phases of education will be engaged, particularly ‘early years to post-16’.
National co-ordination will fall to the National Centre for Excellence in the Teaching of Mathematics (NCETM), currently run under contract to DfE by a consortium comprising Tribal Education, the UCL Institute of Education, Mathematics in Education and Industry (MEI) and Myscience.
(A 2014 PQ reply gives the value of this contract as £6.827m, although this probably reflects a 3-year award made in 2012. It must have been extended by a further year, but will almost certainly have to be retendered for the next spending review period, beginning in April 2016.
The £11m budget for Maths Hubs is separate and additional. It is not clear whether part of this sum has also been awarded to NCETM through a single tender. There is more information about funding mid-way through this post.)
The press release describes the Hubs as both a national and a school-led model:
‘The network will bring together the emerging national leaders of mathematics education and aim to make school-led national subject improvement a reality.’
These emerging national leaders are assumed to be located in the lead schools and not elsewhere in the system, at NCETM or in other national organisations.
The policy design is broadly consistent with my personal preference for a ‘managed market’ approach, midway between a ‘bottom-up’ market-driven solution and a centralised and prescriptive ‘top-down’ model
But it embodies a fundamental tension, arising from the need to reconcile the Government’s national priorities with a parallel local agenda.
In order to work smoothly, one set of priorities will almost certainly take precedence over the other (and it won’t be the local agenda).
The model is also expected to:
‘…ensure that all the support provided…is grounded in evidence about what works, both in terms of mathematics teaching and the development of teachers of mathematics.’
Each Hub will be expected to provide support for maths education across all other schools in the area, taking in the full spectrum of provision:
- ‘recruitment of maths specialists into teaching
- initial training of maths teachers and converting existing teachers into maths [sic]
- co-ordinating and delivering a wide range of maths continuing professional development (CPD) and school-to-school support
- ensuring maths leadership is developed, eg running a programme for aspiring heads of maths departments
- helping maths enrichment programmes to reach a large number of pupils from primary school onwards’.
This is a particularly tall order, both in terms of the breadth of Hubs’ responsibilities and the sheer number of institutions which they are expected to support. It is over-ambitious given the budget allocated for the purpose and, as we shall see, was scaled back in later material.
The press release says that NCETM has already tested the model with five pathfinders.
It adds:
‘The main programme will be robustly evaluated, and if it proves successful in raising the standards of mathematics teaching it may be continued in 2016 to 2017, contingent on future spending review outcomes.’
What constitutes ‘the main programme’ is unclear, though it presumably includes the Hubs’ contribution to national projects, if not their local priorities.
Note that continuation from 2016 onwards is conditional on the outcomes of this evaluation, specifically a directly attributable and measurable improvement in maths teaching standards.
I have been unable to trace a contract for the evaluation, which would suggest that one has not been commissioned. This is rather a serious oversight.
We do not know how NCETM is monitoring the performance of the Hubs, nor do we know what evidence will inform a decision about whether to continue with the programme as a whole.
We have only the most basic details of national programmes in AY2015/16 and no information at all about the Hubs’ longer term prospects.
I asked the Maths Hubs Twitter feed about evaluation and was eventually referred to NCETM’s Comms Director.
I have not made contact because:
- It is a point of principle that these posts rely exclusively on material already available online and so in the public domain. (This reflects a personal commitment to transparency in educational policy.)
- The Comms Director wouldn’t have to be involved unless NCETM felt that the information was sensitive and had to be ‘managed’ in some way – and that tells me all I need to know.
- I am not disposed to pursue NCETM for clarification since they have shown zero interest in engaging with me over previous posts, even though I have expressly invited their views.
.
Selection of the Hubs
Three months later, in March 2014, further details were published as part of the process of selecting the Hubs.
The document has two stabs at describing the aims of the project. The first emphasises local delivery:
‘The aim is to enable every school and college in England, from early years to the post-16 sector, to access locally-tailored and quality support in all areas of maths teaching and learning.’
This continues to imply full national reach, although one might argue that ‘enabling access’ is achieved by providing a Hub within reasonable distance of each institution and does not demand the active engagement of every school and college.
The second strives to balance national priorities and local delivery:
‘The aim of the national network of Maths Hubs will be to ensure that all schools have access to excellent maths support that is relevant to their specific needs and that is designed and managed locally. They will also be responsible for the coordinated implementation of national projects to stimulate improvement and innovation in maths education.’
Note that these national priorities have now become associated with innovation as well as improvement. This is ‘top-down’ rather than ‘school-led’ innovation – there is no specific push for innovative local projects.
At this stage the Hubs’ initial (national) priorities are given as:
- Leading the Shanghai Teacher Exchange Programme
- Supporting implementation of the new maths national curriculum from September 2014 and
- Supporting introduction of new maths GCSEs and Core Maths qualifications in 2015.
The guidance specifies that:
‘Each Maths Hub will operate at a sub-regional or city regional level. The hubs will work with any group of schools or colleges in the area that request support, or who are referred to the hub for support.’
So responsibility for seeking assistance is placed on other schools and colleges and on third parties (perhaps Ofsted or Regional School Commissioners?) making referrals – Hubs will not be expected to reach out proactively to every institution in their catchment.
The competition is no longer confined to teaching schools. Any school that meets the initial eligibility criteria may submit an expression of interest. But the text is clear that only schools need apply – colleges are seemingly ineligible.
Moreover, schools must be state-funded and rated Outstanding by Ofsted for Overall Effectiveness, Pupil Achievement, Quality of Teaching and Leadership and Management.
Teaching schools are not expected to submit Ofsted inspection evidence – their designation is sufficient.
The guidance says:
‘We may choose to prioritise expression of interest applications based on school performance, geographical spread and innovative practice in maths education.’
NCETM reported subsequently that over 270 expressions of interest were received and about 80 schools were invited to submit full proposals.
The evidence used to select between these is set out in the guidance. There are four main components:
- Attainment and progress data (primary or secondary and post-16 where relevant) including attainment data (but not progress data) for FSM pupils (as opposed to ‘ever 6 FSM’).
- Support for improvement and professional development
- Leadership quality and commitment
- Record and capacity for partnership and collaboration
The full text is reproduced below
.


 .
.
It is instructive to compare the original version with the assessment criteria set out for the limited Autumn 2015 competition (see below).
In the updated version applicants can be either colleges or schools. Applicants will be invited to presentation days during which their commitment to mastery will be tested:
‘Applicants will be asked to set out…How they will support the development of mastery approaches to teaching mathematics, learning particularly from practice in Shanghai and Singapore.’
The Maths Hub model may be locally-driven but only institutions that support the preferred approach need apply.
The criteria cover broadly the same areas but they have been beefed up significantly.
The original version indicated that full proposals would require evidence of ‘school business expertise’ and ‘informed innovation in maths education’, but these expectations are now spelled out in the criteria.
Applicants must:
‘Provide evidence of a strong track record of taking accountability for funding and contracting other schools/organisations to deliver projects, including value for money, appropriate use of public funding, and impact.’
They must also:
‘Provide two or three examples of how you have led evidence-informed innovation in maths teaching. Include details of evaluation outcomes.
Provide information about the key strategies you would expect the hub to employ to support effective innovation.
Provide evidence of how you propose to test and implement the teaching maths for mastery approach within the hub. Show how effective approaches will be embedded across all school phases.’
Note that this innovative capacity is linked explicitly with the roll-out of mastery, a national priority.
The new guide explains that action plans prepared by the successful applicants will be ‘agreed by the NCETM and submitted to the DfE for approval’. This two-stage process might suggest that NCETM’s decision-making is not fully trusted. Alternatively, it might have something to do with the funding flows.
No further information was released about issues arising during the original selection process. It seems probable that some parts of the country submitted several strong bids while others generated relatively few or none at all.
It will have been necessary to balance the comparative strength of bids against their geographical distribution, and probably to ‘adjust’ the territories of Hubs where two or more particularly strong bids were received from schools in relatively close proximity.
It is not clear whether the NCETM’s five pathfinders were automatically included.
Successful bidders were confirmed in early June 2014, so the competition took approximately three months to complete.
One contemporary TSA source says that Hubs were ‘introduced at a frantic pace’. A 2-day introductory conference took place in Manchester on 18-19 June, prior to the formal launch in London in July.
Hubs had to submit their action plans for approval by the end of the summer term and to establish links with key partners in readiness to become operational ‘from the autumn term 2014’. (The TSA source says ‘in September’).
.
The Hubs are announced
A further DfE press release issued on 1 July 2014 identified 32 Hubs. Two more were added during the autumn term, bringing the total to 34, although the FAQs on the Maths Hubs website still say that there were only 32 ‘in the first wave’.
This implies that a second ‘wave’ is (or was) anticipated.
An earlier NCETM presentation indicated that 35 hubs were planned but it took a full year for the final vacancy to be advertised.
As noted above, in July 2015, an application form and guide were issued ‘for schools and colleges that want to lead a maths hub in south-east London and Cumbria or north Lancashire.’
The guide explains:
‘There are currently 34 Maths Hubs across England with funding available for a 35th Maths Hub in the North West of England. There is a geographical gap in Cumbria and North Lancashire where previously we were unsuccessful in identifying a suitable school or college to lead a Maths Hub in this area. In addition, after establishing the Maths Hub in first year, the lead school for the London South-East Maths Hub has decided to step down from its role.’
As far as I can establish this is the first time that the original failure to recruit the final Hub in the North-West has been mentioned publicly.
No reason is given for the decision by another lead school to drop out. The school in question is Woolwich Polytechnic School.
The two new Hubs are expected to be operational by November 2015. Applications will be judged by an unidentified panel.
Had the first tranche of Hubs proved extremely successful, one assumes that the second wave would have been introduced in readiness for academic year 2015/16, but perhaps it is necessary to await the outcome of the forthcoming spending review, enabling the second wave to be introduced from September 2016.
The embedded spreadsheet below gives details of all 34 Hubs currently operating.
.
.
Most lead institutions are schools, the majority of them secondary academies. A couple of grammar schools are involved as well as several church schools. Catholic institutions are particularly well represented.
Two of the London Hubs are led by singleton primary schools and a third by two primary schools working together. Elsewhere one Hub is based in a 14-19 tertiary college and another is led jointly by a 16-19 free school.
Some are hosted by various forms of school partnership. These include notable multi-academy trusts including the Harris Federation, Outwood Grange Academies Trust and Cabot Learning Federation.
The difference in capacity between a single primary school and a large MAT is enormous, but the expectations of each are identical, as are the resources made available to implement the work programme. One would expect there to be some correlation between capacity and quality with smaller institutions struggling to match their larger peers.
No doubt the MATs take care to ensure that all their schools are direct beneficiaries of their Hubs – and the initiative gives them an opportunity to exert influence beyond their own members, potentially even to scout possible additions to the fold.
Fewer than half of the lead schools satisfy the initial eligibility requirements for ‘outstanding’ inspection reports (and sub-grades). In most cases this is because they are academies and have not yet been inspected in that guise.
One lead school – Bishop Challoner Catholic College – received ‘Good’ ratings from its most recent inspection in 2012. Another – Sir Isaac Newton Sixth Form – has been rated ‘Good’ since becoming a lead school.
We do not know why these institutions were included in the original shortlist but, perhaps fortunately, there was no public backlash from better qualified competitors upset at being overlooked.
This map (taken from a presentation available online) shows the geographical distribution of the original 32 Hubs. It is a more accurate representation than the regional map on the Maths Hub website.
Even with the addition of the two latecomers in November 2014 – one in Kent/Medway, the other in Leicestershire – it is evident that some parts of the country are much better served than others.
There is an obvious gap along the East Coast, stretching from the Wash up to Teesside, and another in the far North-West that the new competition is belatedly intended to fill. The huge South-West area is also relatively poorly served.
.
 .
.
If the Hubs were evenly distributed to reflect the incidence of schools and colleges nationally, each would serve a constituency of about 100 state-funded secondary schools and 500 state-funded primary schools, so 600 primary and secondary schools in total, not to mention 10 or so post-16 institutions.
Although there is little evidence on which to base a judgement, it seems unlikely that any of the Hubs will have achieved anything approaching this kind of reach within their first year of operation. One wonders whether it is feasible even in the longer term.
But the relatively uneven geographical distribution of the Hubs suggests that the size of their constituencies will vary.
Since schools and colleges are expected to approach their Hubs – and are free to align with any Hub – the level of demand will also vary.
It would be helpful to see some basic statistics comparing the size and reach of different Hubs, setting out how many institutions they have already engaged actively in their work programmes and what proportion are not yet engaged.
It seems likely that several more hubs will be needed to achieve truly national reach. It might be more feasible with a ratio of 300 schools per hub, but that would require twice as many hubs. The limited supply of high quality candidates may act as an additional brake on expansion, on top of the availability of funding.
.
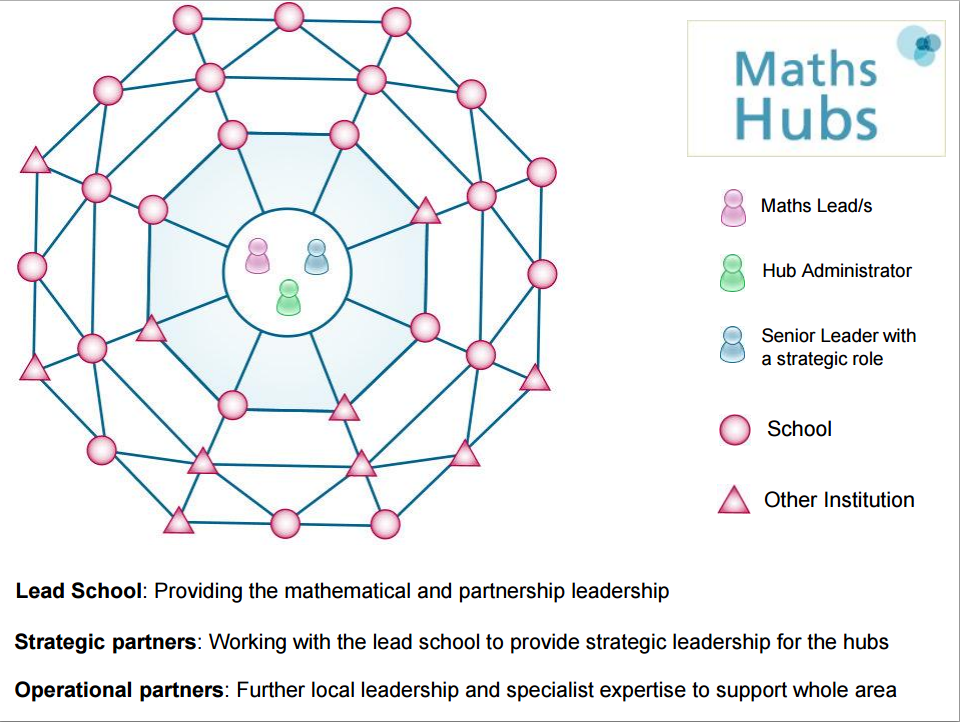
Hub structure
A presentation given on 27 June 2014 by John Westwell – NCETM’s ‘Director of Strategy Maths Hubs’ – explains Hub structure through this diagram
.
 .
.
There is a distinction – though perhaps not very clearly expressed – between the roles of:
- Strategic partners supporting the lead school with strategic leadership and
- Operational partners providing ‘further local leadership and specialist expertise to support [the] whole area’.
It seems that the former are directly involved in planning and evaluating the work programme while the latter are restricted to supporting delivery.
The spreadsheet shows that one of the Hubs – Salop and Herefordshire – fails to mention any strategic partners while another – Jurassic – refers to most of its partners in general terms (eg ‘primary schools, secondary schools’).
The remainder identify between four and 16 strategic partners each. Great North and Bucks, Berks and Oxon are at the lower end of the spectrum. Archimedes NE and Matrix Essex and Herts are at the upper end.
One assumes that it can be a disadvantage either to have too few or too many strategic partners, the former generating too little capacity; the latter too many cooks.
All but five Hubs have at least one higher education partner but of course there is no information about the level and intensity of their involvement, which is likely to vary considerably.
Eighteen mention the FMSP, but only five include the CMSP. Six list MEI as a strategic partner and, curiously, three nominate NCETM. It is unclear whether these enjoy a different relationship with the national co-ordinating body as a consequence.
To date, only the London Central and West Hub is allied with Mathematics Mastery, the Ark-sponsored programme.
However, NCETM says:
‘…a growing number of schools around the country are following teaching programmes from Mathematics Mastery an organisation (separate from the NCETM) whose work, as the name suggests, is wholly devoted to this style of learning and teaching. Mathematics Mastery is, in some geographical areas, developing partnership working arrangements with the Maths Hubs programme.’
Mathematics Mastery also describes itself as ‘a national partner of Maths Hubs’.
.
Work Groups
Hubs plan on the basis of a standard unit of delivery described as a ‘work group’.
Each work group is characterised by:
- a clear rationale for its existence and activity
- well defined intended outcomes
- local leadership supported by expert partners
- a mixture of different activities over time
- value for money and
- systematic evidence collection.
The process is supported by something called the NCETM ‘Work Group Quality Framework’ which I have been unable to trace. This should also be published.
The most recent description of the Hubs’ role is provided by the Maths Hubs Website which was did not appear until November 2014.
The description of ‘What Maths Hubs Are Doing’ reinforces the distinction between:
- ‘National Collaborative Projects, where all hubs work in a common way to address a programme priority area and
- Local projects, where hubs work independently on locally tailored projects to address the programme priorities.’
The earlier material includes a third variant:
- Local priorities funded by other means
But these are not mentioned on the website and it is not clear whether they count as part of the Hubs’ official activity programme.
The spreadsheet shows that the number of work groups operated by each Hub varies considerably.
Four of them – North West One, White Rose, South Yorkshire and London South East – fail to identify any work groups at all.
In the case of White Rose there are links to courses and a conference, but the others include only a generic description of their work programme.
Two further Hubs – Enigma and Cambridge – refer readers to their websites, neither of which contain substantive detail about the Work Groups they have established (though Enigma lists a range of maths CPD opportunities and courses).
Otherwise the number of work groups varies between two (East Midlands South) and 11 (Surrey Plus). Fifteen of the Hubs have six or fewer work groups while nine have eight or more.
This suggests that some Hubs are far more productive and efficient than others, although the number of work groups is not always a reliable indicator, since some Hubs appear to categorise one-off events as work groups, while others use it to describe only longer term projects.
Maybe the Quality Framework needs attention, or perhaps some Hubs are not following it properly.
.
The network defined
To coincide with the launch NCETM published its own information page on Maths Hubs, now available only via archive.
This describes in more detail how the Hubs will be expected to function as a network:
‘…the Maths Hubs will also work together in a national network co-ordinated by the NCETM. The network will ensure that effective practice from within particular hubs is shared widely. It will also provide a setting for Maths Hubs and the NCETM to collaboratively develop new forms of support as needed.
The national network will also come together, once a term, in a regular Maths Hubs Forum, where there will be opportunity to evaluate progress, plan for the future, and to engage with other national voices in maths education, such as the Joint Mathematical Council, the Advisory Committee on Mathematics Education (ACME), the DfE, and Ofsted. As shown in the diagram below’:
.
 ..
..
Whether this is genuinely ‘school-led system-wide improvement’ is open to question, relying as it does on central co-ordination and a funding stream provided by central government. It is more accurately a hybrid model that aims to pursue national and local priorities simultaneously.
Essentially Hubs have a tripartite responsibility:
- To develop and co-ordinate practice within their own Hub.
- To collaborate effectively with other Hubs.
- Collectively to contribute to the national leadership of maths education
The sheer complexity of this role – and the level of expectation placed on the Hubs – should not be under-estimated.
The archived NCETM page identifies three core tasks for the Hubs as they operate locally:
- ‘Identify needs and agree priorities for support in their area. This could involve pro-active surveying of schools; responding to requests and referrals; and considering the implications of national evidence.
- Co-ordinate a range of high quality specialist mathematics support to address the needs. This could include communicating existing support and extending its reach; commissioning external organisations to provide bespoke support; developing and enabling new forms of support and collaboration.
- Critically evaluate the quality and impact of the support provided. This could include gathering immediate, medium-term and long-term feedback from participants engaging with support; and more detailed evaluative research used to test innovations.’
We have no information about the extent and quality of cross-fertilisation between Hubs. This seems to depend mainly on the termly attendance of the leads at the Forum meetings, supported through social media interaction via Twitter. There is also some evidence of regional collaboration, though this seems much better developed in some regions than others.
The July 2015 newsletter on the Maths Hub Website says:
‘An added feature of the second year of the Maths Hubs programme will be more collaboration between Maths Hubs, typically bringing a small group of hubs together to pool experience, maybe in the development of a new project, or in the wider implementation of something that’s already worked well in a single hub.’
This may suggest that the collaborative dimension has been rather underplayed during the first year of operation. If it is to be expanded it may well demand additional teacher time and funding.
In the Westwell presentation the model is described as a ‘fully meshed network’ (as opposed to a hub and spoke model) in which ‘all the nodes are hubs’.
Unusually – and in contrast to the DfE press releases – there is explicit recognition that the Hubs’ core purpose is to improve pupil outcomes:
‘Resolute focus on pupils’ maths outcomes:
- improved levels of achievement
- increased levels of participation
- improved attitudes to learning
- closing the gaps between groups’
They also support school/college improvement:
‘Determined support for all schools/colleges to improve:
- the teaching of mathematics
- the leadership of mathematics
- the school’s mathematics curriculum ‘
Any evaluation would need to assess the impact of each Hub against each of these seven measures. Once again, the level of expectation is self-evident.
.
Termly Forums and Hub leads
Very little information is made available about the proceedings of the termly Maths Hub Forum, where the 34 Hub leads convene with national partners.
The Maths Hubs website says:
‘At the national level, the Maths Hubs programme, led by the NCETM, is developing partnership working arrangements with organisations that can support across the Maths Hubs network. At the moment, these include:
Other partnership arrangements will be developed in due course.’
There is no further information about these national partnership agreements, especially the benefits accruing to each partner as a consequence.
We know that one Forum took place in October 2014, another in February 2015. We do not know the full list of national partners on the invitation list.
There should be another Forum before the end of summer term 2015, unless the London Maths Hub Conference was intended to serve as a replacement.
The guide to the competition for two new Hubs mentions that the Autumn 2015 Forum will take place in York on 4/5 November.
The July Bespoke newsletter says:
‘…the 34 Maths Hub Leads, who meet termly, will continue to pool their thoughts and experiences, developing a growing and influential voice for mathematics education at a national level.’
It is hard to understand how the Forum can become ‘an influential voice’ without a significantly higher profile and much greater transparency over proceedings.
The Maths Hubs website should have a discrete section for the termly forums which contains all key documents and presentations.
In March 2015, NCETM’s Westwell published a post on the NCTL Blog claiming early signs of success for the Hubs:
‘Even though we are less than 2 terms into embedding a new, collaborative way of working, we are seeing encouraging signs that leadership in mathematics education can be shared and spread within geographical areas.’
He continues:
‘Our vision is of a national, collective group of leaders exerting new, subject-specific influence across school phases and across geographical boundaries.
The essential professional characteristics of this group are that they know, from first-hand experience:
- how maths is best taught, and learnt
- how good maths teachers are nurtured
- how high-quality ongoing professional development can help good teachers become excellent ones
They have shown the capacity to lead others in all of these areas.’
And he adds:
‘The maths hub leads also come together in a regular national forum, which allows them to exchange practice but also provides a platform for them to enter into dialogue with policy makers and key national bodies. Over time, we expect that maths hub leads will come to be recognised nationally as leaders of mathematics education.’
This highlights the critical importance of the Maths Hub leads to the success of the model. One assumes that the post-holders are typically serving maths teachers who undertake this role alongside their classroom and middle management responsibilities.
It seems highly likely that most Hub leads will not remain in post for more than two or three years. All will be developing highly transferrable skills. Many will rightly see the role as a stepping stone to senior leadership roles.
Unless they can offer strong incentives to Hub leads to remain in post, NCETM will find turnover a persistent problem.
.
Funding
There is no information about funding on the Maths Hubs Website and details are extremely hard to find, apart from the total budget of £11m, which covers the cost of Hubs up to the end of FY2015-16.
Each Hub receives core operational funding as well as ‘funding on a project basis for local and national initiatives’.
I found an example of an action plan online. The notes provide some details of the annual budget for last financial year:
‘For the financial year 2014/15, each hub will receive £36,000 to cover the structural costs of the hub including the cost of: the Maths Lead time (expected minimum 1 day/week) and Hub Administrator time (expected minimum 1.5 days/week); the time provided by the Senior Lead Support and the strategic leadership group; identifying and developing operational partner capacity; engaging schools/colleges and identifying their support needs. It is possible to transfer some of the £36,000 to support hub initiated activities.
For the financial year 2014/15, Maths Hubs will receive £40,000 to support hub-initiated activity. As explained at the forum we are using the term “Work Groups” to cover all hub-initiated activity…The cost of the exchange element with the Shanghai teachers will be paid from central national project funds and is outside of the £40,000 budget.’
Another source (a presentation given at the launch of the Norfolk and Suffolk Hub) suggests that in 2014-15 Hubs also received a further £20,000 for national projects.
Hence the maximum budget per Hub in FY2014/15 was £96,000. Assuming all 34 received that sum the total cost was £3.264m (34 x £96K).
We do not know how much more was set aside for central costs, although DfE’s Supplementary Estimates for 2014-15 hint that the total budget might have been £3.7m, which would suggest a balance of £0.436m was spent on central administration.
The NCETM website presently lists a Director and no fewer than six Assistant Directors responsible for Maths Hubs, giving a ratio of one director for every seven hubs. On the face of it, this does not fit the image as a school-led network. Indeed it suggests that the Hubs require intensive central support.
I could find nothing at all about the size of the budget for 2015-16. The Norfolk and Suffolk launch presentation indicates that Hubs will enjoy additional funding for both running costs and projects but does not quantify this statement. Another source suggests that the time allocation for Hub leads will be increased to 0.5FTE.
There is no information about funding levels in the guide to the autumn 2015 competition, although it suggests that the money will come in two separate streams:
‘Each Maths Hub will receive direct funding for structural operational purposes and funding on a project basis for local and national projects.’
It may be that the operational funding is paid via NCTL and the project funding via NCETM.
One assumes that operational funding will need to be uprated by at least 33% for 2015-16 since it will cover a full financial year rather than July to March inclusive (9 months only).
If the funding for local and national projects is increased by the same amount, that would bring the sum per Hub in FY2015-16 to approximately £128,000 and the total budget to something like £5m.
It would be helpful to have rather more transparency about Hub budgets and the total sum available to support them in each financial year.
If the NCETM operation needs retendering for FY2016-17 onwards, one assumes that national co-ordination of the Hubs will form part of the specification. One might expect to see a tender early next academic year.
.
Hubs’ Current Activity
.
Developing role
The press release marking the launch was strongly focused on Hubs’ role in leading what was then called the Shanghai Teacher Exchange Programme:
‘A national network of maths hubs that will seek to match the standards achieved in top-performing east Asian countries – including Japan, Singapore and China – was launched today by Education Minister Elizabeth Truss…
These ‘pace-setters’ will implement the Asian-style mastery approach to maths which has achieved world-leading success….Hubs will develop this programme with academics from Shanghai Normal University and England’s National Centre for Excellence in the Teaching of Maths (NCETM)….
… The Shanghai Teacher Exchange programme will see up to 60 English-speaking maths teachers from China embedded in the 30 maths hubs, starting this autumn term.
The Chinese teachers will run master classes for local schools and provide subject-specific on-the-job teacher training.
Two leading English maths teachers from each of the 30 maths hubs will work in schools in China for at least a month, to learn their world-class teaching approaches. The teachers will then put into practice in England what they have learnt and spread this widely to their peers.’
It also mentioned that the Hubs would be supporting the Your Life campaign to inspire young people, especially girls, to study maths and physics.
‘The campaign, led by businesses, aims to increase the number of students taking maths and physics A level by 50% over the next 3 years.’
Moreover:
‘They will also work with new maths and physics chairs, PhD graduates being recruited to become teachers to take their expertise into the classroom and transform the way the maths and physics are taught.’
The Website describes three National Collaborative Projects in slightly different terms:
- England-China is the new title for the Shanghai Teacher Exchange. Primary sector exchanges took place in 2014/15 and secondary exchanges are scheduled for 2015/16.
The aim of the project is described thus:
‘The aim, as far as the English schools are concerned, is to learn lessons from how maths is taught in Shanghai, with particular focus on the mastery approach, and then research and develop ways in which similar teaching approaches can be used in English classrooms…
…The long-term aim of the project is for the participating English schools first to develop a secure mastery approach to maths teaching themselves, and then to spread it around partner schools.’
- Textbooks and Professional Development involves two primary schools from each Maths Hub trialling adapted versions of Singapore textbooks with their Year 1 classes.
Each school has chosen one of two mastery-focused textbooks: ‘Inspire Maths’ and ‘Maths – No Problem’. Teachers have five days’ workshop support.
- Post-16 Participation is intended to increase participation rates in A level maths and further maths courses as well as Core Maths and other Level 3 qualifications. Some hubs are particularly focused on girls’ participation.
The initial phase of the project involves identifying schools and colleges that are successful in this respect, itemising the successful strategies they have deployed and exploring how those might be implemented in schools and colleges that have been rather less successful.
.
Progress to date on National Collaborative Projects
Coverage of the National Projects on the Hubs website is heavily biased towards the England-China project, telling us comparatively little about the other national priorities.
A group of 71 primary teachers visited Shanghai in September 2014. Return visits from 59 Shanghai teachers took place in two waves, in November 2014 and February/March 2015.
A list of 47 participating schools is supplied including the hubs to which they belong.
There is also a Mid-Exchange Report published in November 2014, a press release from February 2015 marking the arrival of the second wave and the first edition of Bespoke, a Maths Hub newsletter dating from April 2015, which is exclusively focused on mastery.
The latter describes the exchanges as:
‘…the start of a long-term research project, across all of the Maths Hubs, to investigate ways in which mastery approaches can be introduced to maths lessons, to the way teachers design lessons, and to how schools organise time-tables, and the deployment of teachers and teaching assistants.’
These descriptions suggest something rather different to the slavish replication of Shanghai-style mastery, anticipating a ‘secure mastery approach’ that might nevertheless have some distinctive English features.
But NCETM has already set out in some detail the principles and key features of the model they would like to see introduced, so rather less is expected of the Hubs than one might anticipate. They are essentially a testbed and a mechanism for the roll-out of a national strategy.
The website also indicates that, before the end of summer term 2015:
‘…the NCETM, working through the Maths Hubs will publish support materials for assessment of the depth of pupils’ knowledge within the context of a mastery curriculum.’
NCETM describes the materials as a collaborative venture involving several partners:
‘Recording progress without levels requires recording evidence of depth of understanding of curriculum content, rather than merely showing pupils can ‘get the answers right’.
The NCETM, working with other maths experts and primary maths specialists from the Maths Hubs, is currently producing guidance on how to do this for the primary maths National Curriculum. For each curriculum statement, the guidance will show how to identify when a pupil has ‘mastered’ the curriculum content (meaning he or she is meeting national expectations and so ready to progress) and when a pupil is ‘working deeper’ (meaning he or she is exceeding national expectations in terms of depth of understanding).’
This is not yet published and, if NCETM is sensible, it will wait to see the outcomes of the parallel Commission on Assessment Without Levels.
The Bespoke newsletter mentions in passing that further research is needed into the application of mastery teaching in mixed age classes, but no further details are forthcoming.
Information about the planned secondary exchange is also rather thin on the ground.
NCETM said in June that the programme would focus on teaching at the KS2/3 transition.
The second edition of Bespoke, published in July 2015 adds:
‘Primary schools that hosted Shanghai teachers in 2014/15 will continue to develop and embed teaching for mastery approaches, and, in addition, two teachers from secondary schools in each Maths Hub will visit Shanghai in September, with their counterparts returning to work in Key Stage 3 classrooms in November 2015.’
The same is true of the Textbooks project, which was announced in a ministerial speech given in November 2014. Very little detail has been added since.
The July edition of Bespoke says that the project:
‘…will be expanded, to take in more schools and more classes, including Year 2 pupils’
while another section offers the briefest commentary on progress in the first year, twice!:
.
 .
.
Coverage of the Post-16 Participation project is similarly sparse, though this may be because the lead lies with the Further Mathematics Support Programme and Core Maths Support Programme.
July’s Bespoke says of Year 2:
‘Work to help schools and colleges increase the numbers of Year 12 and Year 13 students taking A level maths, and, among them, more girls, will continue. Approaches that bore fruit in some hubs this year will be implemented in other areas.’
The sketchiness of this material causes one to suspect that – leaving aside the Shanghai exchanges – progress on these national projects has been less than spectacular during the first year of the Hubs’ existence.
Even with the England-China project there is no published specification for the long-term research project that is to follow on from the exchanges.
Those working outside the Hubs need more information to understand and appreciate what value the Hubs are adding.
.
New National Collaborative Projects
The July edition of Bespoke confirms two further National Projects.
One is snappily called ‘Developing 140 new Primary Mathematics Teaching for Mastery specialists’:
‘Closely linked to other work on mastery, this project will involve the training of four teachers in each Maths Hub area to become experts in teaching for mastery in their own classrooms, and in supporting the similar development of teachers in partner schools.’
This project appeared a national-programme-in-waiting when it was first announced in April 2015.
A subsequent NCETM press release confirmed that there were over 600 applicants for the available places.
The further details provided by NCETM reveal that participants will pursue a two-year course. Year One combines three two-day residential events with the leadership of teacher research groups, both in the teacher’s own school and for groups of teachers in neighbouring schools. Year Two is devoted exclusively to these external teacher research groups.
The material explains that a research group is:
‘…a professional development activity attended by a group of teachers, with a specific focus on the design, delivery and learning within a jointly evaluated mathematics lesson.’
A FAQ document explains that a typical research group meeting is a half-day session with discussion taking place before and after a lesson observation.
The four external group meetings in Year One will together constitute a pilot exercise. In Year Two participants will lead up to five such groups, each meeting on six occasions. Groups will typically comprise five pairs of teachers drawn from five different schools.
Release time is 12 days in Year One and up to 30 days in Year Two (assuming the participant leads the maximum five research groups).
Training and supply costs are covered in Year One but in Year Two they are to be met by charging the other participants in the research groups, so a first indication that Hubs will be expected to generate their own income stream from the services they provide. (NCETM will provide ‘guidance’ on fee levels.)
Participants are expected to develop:
- ‘Understanding of the principles of mastery within the context of teaching mathematics.
- Deep subject knowledge of primary mathematics to support teaching for mastery.
- The development of effective teaching techniques to support pupils in developing mastery of mathematics.
- The ability to assess pupils for mastery.
- The ability to support other teachers, and lead teacher research groups.’
The intention is that teachers completing the course will roll out further phases of professional development and:
‘Over time, this will spread the understanding of, and expertise in, teaching maths for mastery widely across the primary school system.’
The second new national project is called ‘Mathematical Reasoning’. Bespoke is typically uninformative:
‘A new project will start in September 2015, to trial ways of developing mathematical reasoning skills in Key Stage 3 pupils.’
This may or may not be related to a NCETM Multiplicative Reasoning Professional Development Programme which took place in 2013/14 with the assistance of the Hubs.
This:
‘focused on developing teachers’ understanding and capacity to teach topics that involved multiplicative reasoning to Key Stage 3 (KS3) pupils. Multiplicative reasoning refers to the mathematical understanding and capability to solve problems arising from proportional situations often involving an understanding and application of fractions as well as decimals, percentages, ratios and proportions.’
Some 60 teachers from 30 schools were organised into three regional professional development networks, each with a professional development lead and support from university researchers. Project materials were created by a central curriculum development team. The regional networks were hosted by Maths Hubs, presumably in their pilot phase.
In June 2015 DfE published a project Evaluation featuring a Randomised Control Trial (RCT). Unfortunately, this did not reveal any significant impact on pupil attainment:
‘During the timescale of the trial (13 October 2014 to May 2015) the programme did not have any statistically significant impacts on general mathematical attainment as measured by PiM tests or on items on the tests specifically associated with multiplicative reasoning’.
One of the Report’s recommendations is:
‘For the NCETM to make available MRP materials and approaches to teaching MR through the Maths Hub network’
Another:
‘That the NCETM seeks further opportunities to engage curriculum developers with Maths Hubs and other NCETM activities and potentially to develop future curriculum design projects that address the needs of teachers, schools and pupils’.
With five national collaborative projects rather than three, the work programme in each Hub during Academic Year 2015/16 will be more heavily biased towards the Government’s agenda, unless there is also additional funding to increase the number of local projects. There is no hint in the latest Bespoke newsletter that this is the case.
.
Local projects
Unfortunately, Hub-specific pages on the Maths Hubs Website do not distinguish national from local projects.
A regional breakdown offers some insight into the typical distribution between the two and the range of issues being addressed.
The embedded spreadsheet provides further details, including links to additional information on each work group where the Hubs have made this available.
- South West: The four Hubs between them identify 27 work groups. Each Hub has a work group for each of the three initial national collaborative projects. Relatively unusual topics include maths challenge and innovation days and improving primary maths enrichment experiences. The Jurassic Hub includes amongst its list of generic focus areas ‘developing access for the most able’, but there is no associated work group.
- West Midlands: Two of the three hubs have six work groups and the third has seven. Here there is rather less adherence to the national priorities with only the North Midlands and Peaks Hub noticeably engaged with the mastery agenda. One work group is addressing ‘strategies for preventing (closing) the gap’ in maths. It is disturbing that this is unique across the entire programme – no other region appears concerned enough to make this a priority, nor is it a national project in its own right.
- North West: Of the three Hubs, one has provided no details of its work groups, one lists six and the other nine. Perhaps the most interesting is North West Two’s Maths App Competition. This involves Y5 and 6 pupils creating ‘a maths-based app for a particular area of weakness that they have identified’.
- North East: The two North East Hubs have nine and eight work groups respectively. Both address all three initial national priorities. In one the remaining groups are designed to cover the primary, secondary and post-16 sectors respectively. In the other there is a very strong mastery bias with two further work groups devoted to it.
- Yorkshire and Humberside: Only two of the four Hubs provide details of their work groups in the standard format. One offers eight, the other four. The less ambitious Yorkshire and the Humber Hub does not include any of the three national priorities but addresses some topics not found elsewhere including Same Day Intervention and Differentiation. In contrast, Yorkshire Ridings covers all three national priorities and a local project offering £500 bursaries for small-scale action research projects.
- East Midlands: Two of the Hubs identify six work groups but the third – one of the two late additions – has only two, neither of them focused on the national priorities. Elsewhere, only East Midlands East has a work group built around the Shanghai exchanges. Otherwise, network focused work groups – whether for primary specialists, subject leaders or SLEs – are dominant.
- East: Two of the four Hubs provide links to their own websites, which are not particularly informative. The others name nine and five work groups respectively. The former – Matrix Essex and Herts – includes all three initial national priorities, but the latter – Norfolk and Suffolk – includes only increasing post-16 participation. Matrix has a local project to enhance the subject knowledge of teaching assistants.
- South East: The five Hubs vary considerably in the number of work groups they operate, ranging between three and 11. Bucks, Berks and Oxon is the least prolific, naming only the three national priorities. At the other extreme, Surrey Plus is the most active of all 34 Hubs, though several of its groups appear to relate to courses, conferences and other one-off meetings. One is providing ‘inspiration days for KS2, KS3 and KS4 students in schools looking to improve attitudes towards maths’.
- London: Of the six London Hubs, one has provided no information about its work groups. Two of the remaining five have only three work groups. Of these, London Central and NW lists the three national priorities. The other – London Central and West – mentions the two mastery-related national programmes and then (intriguingly) a third project called ‘Project 4’! London Thames includes a Student Commission Project:
‘Students will become researchers over two days and will explore the difference between depth and acceleration in terms of students’ perceptions of progress. There will be support from an expert researcher to support them in bringing together their findings. They will present their findings at the Specialist Schools and Academy’s Trust (SSAT) Conference and other forums where they can share their experience.’
Unfortunately, the presentation given at this event suggests the students were unable to produce a balanced treatment, carefully weighing up the advantages and disadvantages of each approach and considering how they might be combined to good effect. Naturally they came up with the ‘right’ answer for NCETM!
The variation in the productivity of Hubs is something of a surprise. So are the different levels of commitment they display towards the NCETM’s mastery-focused agenda.
Does NCETM push the laggards to work harder and conform to its priorities, or does it continue to permit this level of variance, even though it will inevitably compromise the overall efficiency of the Maths Hub programme?
.
Supporting the Most Able
.
Through the Maths Hubs
In 2013, NCETM published guidance on High Attaining Pupils in Primary Schools (one has to register with NCETM to access these materials).
This is strongly influenced by ACME’s Report ‘Raising the bar: developing able young mathematicians’ (December 2012) which defines its target group as:
‘…those students aged 5-16 who have the potential to successfully study mathematics at A level or equivalent’.
ACME bases its report on three principles:
- ‘Potential heavy users of mathematics should experience a deep, rich, rigorous and challenging mathematics education, rather than being accelerated through the school curriculum.
- Accountability measures should allow, support and reward an approach focused on depth of learning, rather than rewarding early progression to the next Key Stage.
- Investment in a substantial fraction of 5-16 year olds with the potential to excel in mathematics, rather than focussing attention on the top 1% (or so), is needed to increase the number of 16+ students choosing to study mathematics-based subjects or careers.’
ACME in turn cites Mathematical Association advice from the previous year on provision for the most able in secondary schools.
It is fascinating – though beyond the scope of this post – to trace through these publications and subsequent NCETM policy the evolution of an increasingly narrow and impoverished concept of top-end differentiation
The line taken in NCETM’s 2013 guidance is still relatively balanced:
‘It’s probably not helpful to think in terms of either enrichment or acceleration, but to consider the balance between these two approaches. Approaches may vary depending on the age of children, or the mathematics topics, while there may be extra-curricular opportunities to meet the needs of high attaining children in other ways. In addition to considerations of which approach supports the best learning, there are practical issues to consider.’
This is a far cry from the more extreme position now being articulated by NCETM, as discussed in my earlier post ‘A digression on breadth, depth, pace and mastery’.
There is in my view a pressing need to rediscover a richer and more sophisticated vision of ‘stretch and challenge’ for high attaining learners in maths and, by doing so, to help to achieve the Conservative manifesto commitment above. This need not be inconsistent with an Anglicised mastery model, indeed it ought to strengthen it significantly.
One obvious strategy is to introduce a new National Collaborative Project, ensuring that all 34 Hubs are engaged in developing this vision and building national consensus around it.
Here are some suggested design parameters:
- Focus explicitly on improving attainment and progress, reducing underachievement by high attaining learners and closing gaps between disadvantaged high attainers and their peers.
- Develop interventions targeted directly at learners, as well as professional development, whole school improvement and capacity building to strengthen school-led collaborative support.
- Emphasise cross-phase provision encompassing primary, secondary and post-16, devoting particular attention to primary/secondary and secondary/post-16 transition.
- Develop and disseminate effective practice in meeting the needs of the most able within and alongside the new national curriculum, including differentiated support for those capable of achieving at or beyond KS2 L6 in scaled score terms and at or beyond Grade 9 GCSE.at KS4.
- Develop, test and disseminate effective practice in meeting the needs of the most able through a mastery-driven approach, exemplifying how breadth, depth and pace can be combined in different proportions to reflect high attainers’ varying needs and circumstances.
.
Through ‘Most Able Hubs’
Compared with Maths Hubs, the Sutton Trust’s recommendation – that designated schools should support those that are underperforming with the most able and consider providing a localised extra-curricular enrichment programme – is markedly unambitious.
And of course the Maths Hubs cannot be expected to help achieve Conservative ambitions for the other elements of STEM (let alone STEAM).
Why not introduce a parallel network of Most Able Hubs (MAHs)? These would follow the same design parameters as those above, except that the last would embrace a whole/school college and whole curriculum perspective.
But, in the light of the analysis above, I propose some subtle changes to the model.
- Number of hubs
Thirty-four is not enough for genuine national reach. But the supply of potential hubs is constrained by the budget and the number of lead institutions capable of meeting the prescribed quality criteria.
Assuming that the initial budget is limited, one might design a long-term programme that introduces the network in two or even three phases. The first tranche would help to build capacity, improving the capability of those intending to follow in their footsteps.
The ideal long-term outcome would be to introduce approximately 100 MAHs, at least 10 per region and sufficient for each to support some 200 primary and secondary schools (170 primary plus 30 secondary) and all the post-16 institutions in the locality.
That might be achieved in two phases of 50 hubs apiece or three of 33-34 hubs apiece.
- Quality threshold
In the first instance, MAHs would be selected on the basis of Ofsted evaluation – Outstanding overall and for the same sub-categories as Maths Hubs – and high-attaining pupil performance data, relating to attainment, progress and destinations. This should demonstrate a strong record of success with disadvantaged high attainers.
One of the inaugural national collaborative projects (see below) would be to develop and trial a succinct Quality Measure and efficient peer assessment process, suitable for all potential lead institutions regardless of phase or status.
This would be used to accredit all new MAHs, but also to re-accredit existing MAHs every three years. Those failing to meet the requisite standard would be supported to improve.
- Three tiers and specialism
MAHs would operate at local and national level but would also collaborate regionally. They might take it in turns to undertake regional co-ordination.
Each would pursue a mix of national, regional and local priorities. The regional and local priorities would not replicate national priorities but MAHs would otherwise have free rein in determining them, subject to the approval of action plans (see below).
Each MAH would also be invited to develop a broader specialism which it would pursue in national and regional settings. MAHs from different regions with the same specialism would form a collaborative. The selected specialism might be expected to inform to some extent the choice of local priorities.
- Strategic partnerships
Each MAH would develop a variety of local strategic partnerships, drawing in other local school and college networks, including TSAs, MATs, local authority networks, maths and music hubs; local universities, their faculties and schools of education; nearby independent schools; local commercial and third sector providers; and local businesses with an interest in the supply of highly skilled labour. Some partners might prefer to engage at a regional level.
SLEs with a ‘most able’ specialism would be involved as a matter of course and would be expected to play a leading role.
National bodies would serve as national strategic partners, sitting on a National Advisory Group and contributing to the termly national forum.
Participating national bodies would include: central government and its agencies; national organisations, whether third sector or commercial, supporting the most able; and other relevant national education organisations, including subject associations and representative bodies.
Termly forums would be used to monitor progress, resolve issues and plan collaborative ventures. All non-sensitive proceedings would be published online. Indeed a single website would publish as much detail as possible about the MAHs: transparency would be the watchword.
- Work Groups
Each MAH would agree an annual action plan applying the work group methodology to its national, regional and local priorities. Each priority would entail a substantive work programme requiring significant co-ordinated activity over at least two terms.
An additional work group would capture any smaller-scale local activities (and MAHs might be permitted to use a maximum of 10% of their programme budget for this purpose).
MAHs’ progress against their action plans – including top level output and outcome targets – would be assessed annually and the results used to inform the re-accreditation process.
The programme as a whole would be independently evaluated and adjusted if necessary to reflect the findings from formative evaluation.
- Staffing and funding
MAHs would operate with the same combination of co-ordinator, SLT sponsor and administrator roles, but with the flexibility to distribute these roles between individuals as appropriate. Hubs would be encouraged to make the lead role a full-time appointment.
Co-ordinators would constitute a ‘network within a network’, meeting at termly forums and supporting each other through an online community (including weekly Twitter chats) and a shared resource base.
Co-ordinators would be responsible for devising and running their own induction and professional development programme and ensuring that new appointees complete it satisfactorily. Additional funding would be available for this purpose. The programme would be accredited at Masters level.
Assuming a full year budget of £160K per MAH (£60K for structural costs; £100K for work groups), plus 10% for central administration, the total steady-state cost of a 100-MAH network would be £17.6m per year, not much more than the £15m that Labour committed during the General Election campaign. If the programme was phased in over three years, the annual cost would be significantly lower during that period.
MAHs might be encouraged to generate income to offset against their structural costs. The co-ordinators’ salary and on-costs might be the first priority. In time Hubs might be expected to meet these entirely from income generated, so reducing the overall cost by almost a third.
In an ideal world, MAHs would also support a parallel programme providing long-term intensive support to disadvantaged high attainers funded through a £50m pupil premium topslice.
The overall cost is significant, but bears comparison with the substantial sums invested in some selective 16-19 free schools, or the £50m recently set aside for School Cadet Forces. Maybe funding for MAHs should also be drawn from the fines levied on the banks!
MAHs would support learners from YR-Y13 and have a genuinely national reach, while free schools can only ever impact significantly on a very limited annual intake plus those fortunate enough to benefit from any localised outreach activity. In short MAHs offer better value for money.
.
Conclusion
The principal findings from this review are that:
- Maths Hubs offer a potentially workable model for system-wide improvement in the quality of maths education which could help to secure higher standards, stronger attainment and progress. But expectations of the Hubs are set too high given the limited resource available. It is doubtful whether the present infrastructure is strong enough to support the Government’s ambition to make England the best place in the world to study maths (in effect by 2020).
- Given the dearth of information it is very difficult to offer a reliable assessment of the progress made by Maths Hubs in their first year of operation. The network has managed to establish itself from scratch within a relatively short time and with limited resources, but progress appears inconsistent, with some Hubs taking on and achieving much more than others. Two of the first three national collaborative projects still seem embryonic and the England-China project seems to be making steady rather than spectacular progress.
- There are some tensions and weaknesses inherent in the model. In particular it relies on the successful reconciliation of potentially competing national and local priorities. There is evidence to suggest that national priorities are dominating at present. The model also depends critically on the capability of a small group of part-time co-ordinators. Several are likely to have limited experience and support, as well as insufficiently generous time allocations. Many will inevitably progress to school leadership positions so turnover will be a problem. An independent evaluation with a formative aspect would have been helpful in refining the model, ironing out the shortcomings and minimising the tensions. The apparent failure to commission an evaluation could become increasingly problematic as the expectations placed on the Hubs are steadily ratcheted upwards.
- The supply of information is strictly rationed; the profile of Maths Hubs is far too low. Because the quality and quantity of information is so limited, those not working inside the network will infer that there is something to hide. Institutions that have not so far engaged with the Hubs will be less inclined to do so. If external communication is wanting, that may suggest that intra-Hub communication is equally shaky. Effective communication is critical to the success of such networks and ought to be given much higher priority. The Maths Hub website ought to be a ‘one stop shop’ for all stakeholders’ information needs, but it is infrequently updated and poorly stocked. Transparency should be the default position.
- If the Government is to ‘create more opportunities to stretch the most able’ while ensuring that all high attainers ‘are pushed to achieve their potential’, then Maths Hubs will need to be at the forefront of a collective national improvement effort. NCETM should be making the case for an additional national collaborative project with this purpose. More attention must be given to shaping how the evolving English model of maths mastery provides stretch and challenge to high attainers, otherwise there is a real risk that mastery will perpetuate underachievement, so undermining the Government’s ambitions. In PISA 2012, 3.1% of English participants achieved Level 6 compared with 30.8% of those from Shanghai, while the comparative percentages for Levels 5 and 6 were 12.4% and 55.4% respectively. NCETM should specify now what they would consider acceptable outcomes for England in PISA 2015 and 2018 respectively.
- Maths Hubs cannot extend their remit into the wider realm of STEM (or potentially STEAM if arts are permitted to feature). But, as Ofsted has shown, there are widespread shortcomings in the quality of ‘most able education’ more generally, not least for those from disadvantaged backgrounds. I have already made the case for a targeted support programme to support disadvantaged high attainers from Year 7 upwards, funded primarily through an annual pupil premium topslice. But the parallel business of school and college improvement might be spearheaded by a national network of Most Able Hubs with a whole school/college remit. I have offered some suggestions for how the Maths Hubs precedent might be improved upon. The annual cost would be similar to the £15m committed by Labour pre-election.
If such a network were introduced from next academic year then, by 2020, the next set of election manifestos might reasonably aim to make Britain the best place in the world for high attaining learners, especially high attaining learners from disadvantaged backgrounds.
And, with a generation of sustained effort across three or four successive governments and universal commitment in every educational setting, we might just make it….
What do you think the chances are of that happening?
Me too.
.
GP
July 2015


 It explores the nature of excellence gaps, which I have