How strong is Oxbridge access?

.

This post assesses how well Oxford and Cambridge Universities support fair access for students from disadvantaged backgrounds attending state-funded schools and colleges.

courtesy of Wellcome Images

courtesy of Wellcome Images

It sets out an evidence base to inform and support an Access Lecture I have been asked to give at Brasenose College, Oxford on 28 April 2015.

The outline for that Lecture is as follows:

‘If national efforts:

  • by state-funded schools and colleges to close high attainment gaps between learners from advantaged and disadvantaged backgrounds
  • by selective higher education institutions to secure fair access for students from disadvantaged backgrounds

could be integrated more effectively, much more substantial progress could be achieved on both fronts.

There is scope for reform in both sectors, to ensure a closer fit between the ‘push’ from schools and colleges and the ‘pull’ from higher education.

Faster progress will be achieved through a national framework that brings greater coherence to the market on both the demand and supply sides. It should be feasible to focus all support directly on learners, regardless of their educational setting.

Oxford and Cambridge should position themselves at the forefront of such efforts, serving as beacons of excellence and exemplary practice.’

This is a companion piece to two previous posts:

The first of these explores the issue from first principles, considering measures, targets and data before outlining a 10-point improvement plan. The second advances a simplified version of this plan.

This post concentrates principally on description of the access-related activities of these two universities, placing those in the wider context of updated material about national policy developments and the relatively disappointing outcomes achieved to date.

It is organised into five main sections:

  • A review of key changes to the national access effort since November 2013.
  • A note on outcomes, which questions whether Oxbridge reflects the positive trends reported for selective higher education as a whole.
  • In depth analysis of how fair access work has developed, at Oxford and Cambridge respectively, as revealed by their successive access agreements.
  • Analysis of signature access programmes at Oxford and Cambridge, featuring their rival residential summer schools and efforts to develop a longer term relationship with disadvantaged students, as recommended by Offa.
  • My personal assessment of strengths and areas for development, including a slightly revised version of the improvement strategy I have proposed in earlier posts.

Given the length of the post I have inserted page jumps to each section.

.

Recent developments in national fair access policy

My November 2013 post supplies considerable detail about the regulation of fair access to English universities which I shall not repeat here.

Amongst other things, it deals with:

  • Published data on high attainment by disadvantaged students and their progression to Oxbridge – and how this has not always been used appropriately.

This section describes briefly the principal changes to the national fair access mechanisms introduced by and subsequent to the National Strategy – and explains how access agreements fit into these mechanisms.

.

National Strategy for Access and Student Success

The National Strategy sets out a ‘student lifecycle approach’ in which access forms the first of three main stages.

It seeks to address:

‘…the wide gap in participation rates between people from advantaged and disadvantaged backgrounds in society, and between students with different characteristics, particularly at the most selective institutions.’

There are six key actions:

  • Introduce a national approach to collaborative outreach that will foster new collaborative partnerships, reduce duplication and support the tracking of students who have undertaken outreach activities. Hefce will fund the national roll-out of a tracking system.
  • Secure a more coherent approach to the provision of information, advice and guidance. HE outreach activity and schools policy will be ‘joined up’.
  • Develop a national evaluation framework, so universities can evaluate their activities more effectively and provide comparable national data. Hefce and Offa will examine the feasibility of sector-wide evaluation measures and publish good practice guidance by January 2015.
  • Co-ordinate national research into access, build the evidence base for effective outreach and share good practice.
  • Introduce a joint HEFCE-Offa approach to requesting information from institutions and
  • Encourage institutions to re-balance their funding from financial support towards outreach and collaborative outreach’.

The new national approach to collaborative outreach will be derived from a set of principles (the emboldening is mine):

  • ‘Outreach is most effective when delivered as a progressive, sustained programme of activity and engagement over time.
  • Outreach programmes need to be directed towards young people at different stages of their educational career and begin at primary level.
  • The effective delivery of outreach programmes requires the full, adequately resourced involvement and engagement of HEIs, FECs and schools.
  • The collaborative provision of outreach delivers significant benefits in terms of scale, engagement, co-ordination and impartiality.
  • Progression pathways for learners with non-traditional or vocational qualifications need to be clearly articulated.
  • Outreach to mature learners depends on good links with FECs, employers and the community.
  • Without good advice and guidance, outreach is impoverished and less effective.’

In November 2013, institutions were advised that they would be expected to prepare their own Strategies for Access and Student Success (SASS), which would replace Offa’s access agreements and Hefce’s widening participation strategic statements.

These would cover the period 2014-19, incorporating the information and commitments that would otherwise have featured in 2015-16 access agreements. In future these arrangements would be updated each spring. Full guidance was promised by late January 2014.

However, further guidance was issued in February 2014 stating that separate returns would continue because:

‘…of the Department for Business, Innovation and Skills’ unexpected delay in sending HEFCE’s grant letter, and because we appreciate that institutions need to make progress with their access and student success plans, which must be approved by the Director of Fair Access to Higher Education. Separating our information requirements is the most pragmatic approach at this time.’

Hefce now says:

‘We are no longer requesting widening participation strategic statements from institutions and are moving towards an outcomes framework for 2014-15 onwards.’

It appears that the SASS concept has been set aside permanently. Certainly Offa’s 2016-17 guidance (February 2015) envisages the continuation of separate access agreements, although there is now a single monitoring return to Offa and Hefce.

Initiatives prompted by the National Strategy

The outcomes framework will be informed by two research projects, one developing a data return, the other designed to establish how an outcomes framework ‘could lead us to understand the relative impact of a wider range of access and student success activities and expenditure’.

As far as I can establish there has been nothing further on evaluation. Hefce’s website mentions guidance, but the link is to material published in 2010

However, the current work programme does include rolling out a Higher Education Access Tracker (HEAT) which helps universities track outreach participants through to HE entry. Hefce is funding this to the tune of £3m over 2014-17, but institutions must also pay a subscription – and only 21 are currently signed up.

The strategy is also establishing National Networks for Collaborative Outreach (NNCOs) which, it is claimed:

‘will deliver a nationally coordinated approach to working with schools, universities and colleges to help people access HE’.

In fact, the purpose of the networks is almost exclusively the provision of information.

They will supply a single point of contact providing information for teachers and advisers about outreach activity in their area, as well as general advice about progression to HE. They will undertake this through websites to be available ‘in early spring 2015’.

At the time of writing, Hefce’s website merely lists the institutions participating in each network – there are no links to live websites for any of these.

There is a budget of £22m for the networks over academic years 2014/15 and 2015/16. Each network receives £120,000 per year and there is also a small additional allocation for each institution.

Three of the networks have national reach, one of them to support students wishing to progress to Oxbridge. This is called the Oxford and Cambridge Collaborative Network. Oxford is the lead institution.

A Google search confirms no web presence at the time of writing. However Oxford’s press release says:

‘Oxford will lead the Oxford and Cambridge NNCO, which will aim to offer specific support to students hoping to study at Oxford and Cambridge by reaching out to students and teachers in more than 1,600 schools across England. The collaboration will build on the current information and advice already offered to students and teachers, but enhanced by activities including a new interactive website, online webinars with admissions staff from Oxford and Cambridge, and more resources for activities in local schools linked to Oxford and Cambridge colleges….

… Online webinars with admissions staff from both universities will make it easier to make contact with students and schools from hard to reach geographic areas, and those schools with limited numbers of high-achieving students each year.

The new network will aim to work with state schools across England with particular emphasis on those in areas that currently have little engagement with Oxford and Cambridge outreach; those in schools offering post-16 (GCSE) education; those from schools with low progression to Oxford or Cambridge, or from areas of socioeconomic disadvantage.’

Offa guidance and strategic plan

Offa’s latest access agreement guidance (for 2016-17 agreements) sets out future priorities that are consistent with the national strategy. These include:

  • Greater emphasis on long-term outreach: ‘Evidence suggests that targeted, longterm outreach which boosts achievement and aspirations among disadvantaged people is a more effective way of widening access than institutional financial support. Where appropriate, you should therefore consider how you can strengthen your work to raise the aspiration and attainment of potential students of all ages, from primary school pupils through to adults.’
  • More effective collaboration: ‘Collaboration between institutions providing outreach is not limited to alliances of higher education institutions (HEIs). We would normally expect collaborative outreach to include many stakeholders rather than to be between a single HEI and schools, colleges or other stakeholders receiving outreach. For example, collaboration may be between one HEI and further education colleges (FECs), other higher education providers, employers, third sector organisations, schools, colleges, training providers, local authorities and so on.’
  • Stretching targets for achieving faster progress: ‘we now ask you to review and set new stretching targets which set out the desired outcomes of the work set out in your access agreement. When reviewing your targets, we expect all institutions, particularly those with relatively low proportions of students from under-represented groups, to demonstrate how they intend to make faster progress in improving access, success and/or progression for these students. This is in line with the aims expressed in our forthcoming strategic plan, which is informed by guidance from Ministers.’

This strategic plan was published in February 2015. It notes that, while some progress has been made in improving access for disadvantaged students to selective higher education, there is much more still to do.

‘Despite these improvements, the gaps between the most advantaged and most disadvantaged people remain unacceptably large. The latest UCAS data shows that, on average, the most advantaged 20 per cent of young people are 2.5 times more likely to go to higher education than the most disadvantaged 20 per cent. At the most selective institutions this ratio increases – with the most advantaged young people on average 6.8 times more likely to attend one of these institutions compared to the most disadvantaged young people.’

One of Offa’s targets (described as ‘Sector Outcome Objectives’) is:

‘To make faster progress to increase the entry rate of students from underrepresented and disadvantaged groups entering more selective institutions, and narrow the participation gap between people from the most and least advantaged backgrounds at such institutions.’

The measure selected is English 18-year-old entry rates by POLAR 2 for higher tariff providers. The targets are:

‘….for the entry rate from quintile 1 to increase from 3.2 per cent in 2014-15 to 5 per cent by 2019-20, and from 5.1 per cent in 2014-15 to 7 per cent by 2019-20 for quintile 2. To reduce the gap in participation, our target is for the quintile 5: quintile 1 ratio to decrease from 6.8 in 2014-15 to 5.0 by 2019-20.’

.

A Note on Outcomes

High tariff HEIs

As Offa suggests, there is some cause for optimism about wider progress towards fair access, albeit from an exceedingly low base.

The UCAS End of Cycle Report 2014 indicates that:

  • Students from POLAR Quintile 1 are 40% more likely to enter a high-tariff institution than in 2011, though the percentage achieving this is still tiny (it has increased from 2.3% to 3.2%).
  • FSM-eligible students (the Report doesn’t indicate whether they were ‘ever 6 FSM’ or FSM in Year 11) are 50% more likely to enter a higher tariff institution than in 2011, but the 2014 success rate is still only 2.1%.

As noted above, Offa’s Strategic Plan for 2015-20 includes a target to increase the POLAR Quintile 1 success rate from 3.2% to 5% by 2019-20.

This is an increase of 56% in the six years between 2014 and 2020, compared with an increase of 40% in the three years between 2011 and 2014. Looked at in this way it is relatively unambitious.

But what of Oxbridge? How does its performance compare with other high-tariff institutions?

Oxbridge argues that it is a special case – because of its higher entrance requirements – so should not be judged by the same criteria as other high tariff institutions. It is for this reason that Oxford and Cambridge are reluctant to be assessed against HESA’s Performance Indicators.

Offa’s access agreement methodology enables universities to set targets that reflect their different circumstances, but its own KPIs are framed according to national measures which might not be appropriate to some.

There is no separate Offa target to improve Oxbridge access. When it comes to system-wide performance measures, only DfE’s Impact Indicator 12: Percentage of children on free school meals progressing to Oxford or Cambridge University is specific to Oxbridge.

This is based on the DfE’s experimental Destination Measures statistics. FSM eligibility is determined in Year 11 rather than via the ‘ever 6’ methodology.

The Indicator reports an increase from 0.1% in 2010/11 to 0.2% in 2011/12. (This compares with a reported increase in FSM progression to Russell Group universities from 3.0% to 4.0%)

However, as I have pointed out:

  • The 2010/11 intake was 30 and the 2011/12 intake 50.
  • The 2011/12 intake comprised 40 students from state-funded schools and 10 from state-funded colleges, but both numbers are rounded to the nearest 10.
  • The 2012/13 intake, not yet incorporated into the Indicator, is unchanged from 2010-11, both numbers again rounded to the nearest 10, so any improvement achieved in 2011/12 stalled completely in 2012/13.

The most recent data reported to Offa by Oxford and Cambridge also relates to 2012/13.

.

Cambridge

Cambridge uses the POLAR Quintile 1 measure, also a HESA benchmark, though adjusted downwards to reflect its high attainment threshold. It is aiming for a target of 4.0% by 2016/17, against a 2009/10 baseline of 3.1%.

The 2011/12 outcome is given as 2.5%. The 2012/13 line is blank, on the grounds that HESA has not yet reported it. We can now see that the outcome was in fact 3.5% (POLAR2), so a significant improvement, more than catching up the decline the previous year. HESA has recently published the 2013/14 outcome, which is 3.6%, a very slight improvement on the previous year

HESA’s own benchmarks for Cambridge (again POLAR2) were 4.4% in 2011/12, 4.7% in 2012/13 and 4.6% in 2013/14, so it continues to undershoot these quite significantly.

In its latest 2015/16 agreement, Cambridge’s 2017/18 target is unchanged at 4.0% (but now transferred to POLAR3 quintile 1). It has not set a target for 2018/19.

Given Offa’s commitment to achieving a 5.0% outcome by 2019/20, it will be interesting to see where Cambridge pitches its own target in its 2016-17 access agreement. Will it, too, aim for 5%, or will it scale back its own target on the grounds that the attainment profile of its intake is atypically high?

.

Oxford

Oxford opts for a different measure. It only reports outcomes for POLAR Quintiles 1 and 2 combined, which is insufficiently specific, using a measure based on ACORN postcode analysis as its principal indicator of access for disadvantaged students.

On this second measure, it reports a target of 9.0% by 2016/17 against a 2009/10 baseline of 6.1% and, more recently, has projected this forward to 10% by 2018/19.

The 2011/12 outcome is 7.6% and the 2012/13 outcome is 6.7%. This fall of 0.9% is annotated ‘Progress made – but less than anticipated’.

If we were to apply the POLAR2 HESA Quintile 1 measure to Oxford, it would have registered 2.6% in 2011/12 (against a HESA benchmark of 4.7%), 3.0% in 2012/13 (against a benchmark of 4.9%) and only 2.4% in 2013/14 (against a benchmark of 4.8%).

The reason is presumably the atypical attainment threshold for admission to Oxford.

Oxford does not have the benefit of an Offa marker against which to pitch its ACORN target for 2019-20.

Comparing Oxford and Cambridge

Graph 1, below, illustrates progress against each university’s principal measure of fair access, as well as the trend implied by its targets.

.

Oxbridge graph 1

Graph 1: Oxford and Cambridge: Progress against principal fair access target and projected outcomes for future years

The graph shows inconsistent progress to 2012/13. Oxford’s trend is broadly positive, but Cambridge has not yet caught up where it was in 2008/09. The trajectory implied by Oxford’s targets is more ambitious than Cambridge’s.

Graph 2, below provides further analysis of Oxford’s outcomes, based on data provided in the most recent 2015-16 access agreement. Unfortunately Cambridge is less transparent in this respect.

Graph 2 shows the same pattern of progress against the ACORN target as in Graph 1, except that the 2013 figure is an actual outcome (6.8%) rather than a target (7.5%).

It also shows for each year the percentage of all applicants from ACORN 4/5 postcodes who applied successfully. These compare with a success rate for all applicants of around 20%, giving a gap of three or four percentage points to make up. Progress on this measure has also fluctuated, falling back significantly in 2010 and not yet returning to the mark achieved in 2009.

Preliminary data for 2014 suggests a significant improvement, however. The agreement says that 320 conditional offers have been made, giving an estimated figure for acceptances of 275 (my estimate, not Oxford’s) and a corresponding success rate of 19.2%. If confirmed, this will be a significant step forward.

.

Oxbridge graph 2

Graph 2:  The percentage of all successful applicants drawn from ACORN 4/5 postcodes and the percentage of all applicants from ACORN 4/5 postcodes who are successful, 2008-2013

.

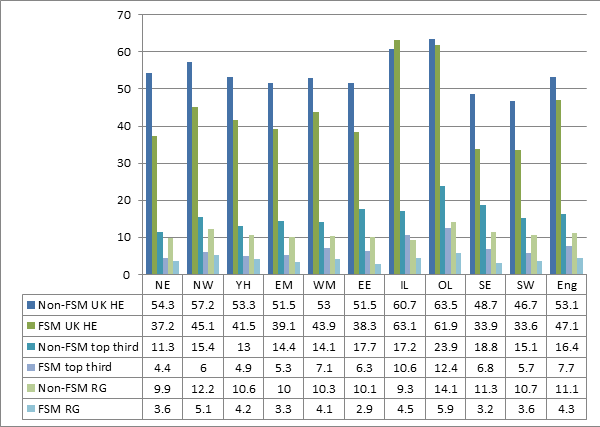
Graph 3, below is derived from the data underpinning the DfE’s experimental KS5 destination statistics for 2010 to 2011, 2011 to 2012 and 2012 to 2013. It provides, for each year, the percentage of admissions to Oxbridge, Russell Group, Top Third and all HEIs accounted for by FSM students.

.

Additional Oxbridge graphGraph 3: Percentage of admissions to Oxbridge, RG, Top third and all HEIs accounted for by FSM students, 2010/11 to 2012/13 (From DfE destination statistics, underlying data)

.

The Oxbridge data, especially, must be treated with a degree of caution, since all figures are derived from separate totals for state-funded schools and colleges, each rounded to the nearest 10. Consequently, changes from year to year may be inflated or deflated by the generous rounding.

Nevertheless, one can see that FSM admission to Oxbridge continues to lag well behind the rates for admission to selective higher education more generally. Although one might argue that Oxbridge is improving at a faster rate, it is doing so from a significantly lower base and, in the most recent year (2012/13), the improvement in all other respects is not mirrored in the Oxbridge figures.

Although the rounded number of FSM admissions to Oxbridge in 2012/13 remained unchanged from 2011/12 (at 50) the number of non-FSM admissions increased by 190, so dragging down the percentage.

To summarise:

  • There is an unhelpful two-year lag in outcomes data and limited commonality in the basis of the measures used to set targets, making comparison much more difficult than it needs to be.
  • Neither university routinely releases details of the number of FSM or ‘ever 6’ FSM students within its intake, but DfE destinations data, also affected by a two-year lag, shows that FSM admissions to Oxbridge are significantly lower than to selective HE more generally. The actual number of FSM students admitted has been more or less stalled at 50 or fewer for a decade.
  • Fair access to Oxbridge is improving slightly, but not consistently. Cambridge has not yet caught up where it was in 2008/09. Oxford’s progress is more secure than Cambridge’s, and Oxford’s target is more challenging.

Access Agreements

Access agreements are approved annually by Offa, which issues annual guidance to inform the review process.

It looks particularly at the nature of the access measures adopted, the resources allocated and whether targets and milestones are suitably challenging.

Offa archives old access agreements on its website as well as universities’ self-assessments. The latter should:

  • ‘assess their progress against each target they set themselves in their agreements
  • provide data showing their progress against targets for each academic year since 2006-07 and
  • provide a commentary setting their access work in context, highlighting any particular challenges they have faced, and, if they have not made as wished, explaining the reasons for this.’

The archive includes:

  • Access agreements for Oxford and Cambridge for 2006-07 through to 2015-16 and
  • Self -assessments for Oxford and Cambridge for 2010-11 through to 2012-13

Self-assessments for 2013-14 were due during January 2015 but have not yet been published. In previous years they have not appeared until July.

Access agreements for 2016-17 are due for submission during April 2015. They too are unlikely to appear before July.

Analysis of how access agreements have changed over time provides a valuable insight into the evolution of institutional policies, including the extent to which these have been modified in line with Offa’s guidance.

Comparison between Oxford and Cambridge’s access agreements also helps to draw out key differences between their respective access policies, as well as comparative strengths and weaknesses and areas in which they might potentially learn from each other.

The sections below explore the chronological development of each university’s access agreement under four headings:

  • Budget: The total budget devoted to activity within scope of the agreement, and the balance between funding for bursaries and outreach respectively
  • Bursaries: The bursaries provided to students from the most disadvantaged backgrounds
  • Outreach: The range of activities undertaken 
  • Targets: The targets and milestones set and progress against those not already discussed above.

I have also included a section of Commentary, intended to capture observations that throw additional light on the institution’s approach and attitude to access.

It is important to note that the two universities now adopt a somewhat different approach to the nature of access agreements.

The agreements for 2006-07 were nine (Oxford) and eight (Cambridge) pages in length. Cambridge’s 2015-16 agreement is slightly longer, at 11 pages, but Oxford’s is 48 pages long.

In recent years, Oxford’s agreement has consistently been much more detailed and more informative. This distinction will be apparent from the analysis below.

Moreover, Cambridge’s agreement was unchanged from 2006-07 to 2009-10, whereas Oxford’s changed somewhat in this period. Both universities submitted single agreements for 2010-11 and 2011-12, but both have changed their agreements – at least to some degree – each year since then.

.

Budget (£m pa)

Costs are not always as clearly expressed as one would wish, nor are they always fully comparable. This is despite the fact that Offa now produces a template for the purpose.

There is very limited information in Cambridge’s most recent agreement, whereas Oxford supplies extensive detail, including (at Offa’s behest) what is and is not ‘Offa-countable’:

‘When calculating your progression spend, please note that OFFA’s remit only extends to students and courses that are fee-regulated. This means that only measures targeted at undergraduate students (or postgraduate ITT students) from under-represented and disadvantaged groups should be included in your OFFA-countable spend. For example, you should not include spend on financial support for postgraduate students in your OFFA-countable expenditure, although you may include this in your total expenditure on progression.’ (Offa, 2015-16 Resource Plan)

The tables below represent my best effort at harvesting comparable figures. The first table summarises Cambridge’s budget, the second Oxford’s.

Year Bursaries Outreach Total Notes
2006-10 £7.0m £1.15m £8.15m Bursary cost in steady state..£0.425m of outreach budget from AimHigher and Hefce funds.
2010-12 £7.5m £1.15m £8.65m Bursary cost in steady state..£0.45m of outreach budget from AimHigher and Hefce funds.
2012-13 £8.3m £4.2m £12.5m Bursary cost in steady state and includes £1.2m steady state assumption for NSP..Total outreach cost includes £2.7m current expenditure plus £1.5m from fee income.
2013-14 £8.3m £4.2m £12.5m As above.
2014-15 £8.0m £4.66m £12.66m Bursary cost in steady state and includes £0.9m for NSP..Total outreach cost includes £2.7m current expenditure plus £1.96m fee income (of which £0.258m is redirected from NSP).
2015-16 £6.9m £3.0m £9.9m Bursary cost in steady state..Total outreach cost includes unspecified fee income.

Table 1: Summary of costs in Cambridge’s access agreements, 2006-2016

.

Year Bursaries Outreach Total Notes
2006-07 £6.8m £1.35m £8.15m Bursary cost in steady state..An additional £3m is provided through college support.
2007-08 £6.8m £1.35m £8.15m Bursary cost in steady state..An additional £3m is provided through college support.
2008-09 £6.3m £1.075m £7.375m Bursary cost in steady state.
2009-10 £6.4m £0.968m £7.368m Bursary cost in steady state.
2010-11 £6.4m £0.968m £7.368m Bursary cost in steady state.
2011-12 £6.6m £1.415m £8.015m
2012-13 £8.8m £2.6m £11.65m Bursary total included £2.2m for tuition fee waivers..Plus additional £0.25m for retention, support and employability.Includes NSP allocation of £0.4m
2013-14 £9.4m.(£9.4m) £4.52m.(£2.44m) £13.92m Bursary total includes £2.9m for tuition fee waivers..Plus additional £0.41m for retention, support and employability.Includes NSP allocation of £0.79m

.

Figures in brackets are ‘offa-countable’

.

2014-15 £11.32m.(£11.05m) £5.23m.(£2.92m) £16.55m Bursary includes £4.06m for tuition fee waivers..Plus additional £0.54m for retention, support and employability.Includes NSP allocation of £0.34m

.

Figures in brackets are ‘offa-countable’

 .

2015-16 £10.89m.(£10.6m) £5.67m.(£3.24m) £16.56m Bursary includes £3.63m for tuition fee waivers..Plus additional £0.71m for retention, support and employability.Of total only £13.81m is ‘offa-countable’

 .

Table 2: Summary of costs in Oxford’s access agreements, 2006-2016

These suggest that:

  • Total combined expenditure in 2006-07 was £16.3m, but by 2015-16, this had increased to £23.74m (excluding Oxford’s ‘non-offa countable’ expenditure, an increase of around 46%.
  • Whereas in 2006-07, both Universities were spending exactly the same, by 2015-16, total expenditure at Cambridge had increased by some 21%, while total Offa-countable expenditure at Oxford had increased by about 70%.
  • In 2005-06, the percentage of total funding spent on bursaries was 86% at Cambridge and 83% at Oxford. By 2015-16, the comparable percentages are 70% and 77%. Hence Cambridge has reduced the proportion spent on bursaries more substantively than Oxford, but both Universities continue to direct their funding predominantly towards bursaries.
  • In 2005-06, expenditure on bursaries by each university was very similar. Although the total devoted to bursaries by Cambridge increased slightly in the intervening years, by 2015-16 it was almost the same as in 2005-06. However, expenditure on bursaries at Oxford is some 56% above what it was in 2005-06.
  • Since 2005-06, both Oxford and Cambridge have more than doubled their expenditure on outreach. Taken together, the two universities expect to spend some £6.24m on outreach in 2015-16. Cambridge’s ratio of bursary to outreach spend is approaching 2:1, whereas Oxford’s is more than 3:1.
  • Although the sums they now spend on outreach (offa-countable in Oxford’s case) are relatively similar, Cambridge spends 30% of its total expenditure on outreach while Oxford spends 23%. However, Cambridge spends significantly less than it did at its peak in 2014-15, while Oxford’s expenditure has increased steadily since 2010-11.

Bursaries

Bursary arrangements have shifted subtly, especially as NSP fee waivers have arrived and then disappeared. The details below relate only to the most generous bursary rates for students with the lowest residual household incomes.

Cambridge’s access agreements suggest that:

  • For 2006-10 Cambridge’s bursary offer for students eligible for a full maintenance grant – with a residual household income of £16,000 or below – is £3,000 per year. It estimates that some 10% of its full fee-paying undergraduates – around 955 students – will qualify.
  • For 2010-12 the maximum bursary is £3,400 for all students qualifying for a full maintenance grant – now equivalent to a residual household income of £25,000 or below – and about 1,100 students (13% of Cambridge’s UK undergraduates) will qualify.
  • For 2012-13 the maximum bursary is £3,500 for those with a full maintenance grant. There is an additional fee waiver of £6,000 in the first year of study for such students who are also from ‘particularly disadvantaged backgrounds’ including those formerly in receipt of FSM. (The University points out that these are the Government’s criteria).
  • For 2013-14 the same arrangements apply.
  • For 2014-15 the same arrangements apply, except that recipients can no longer allocate part of their bursary towards an additional fee waiver.
  • For 2015-16 only the bursary of £3,500 remains in place for those with a full maintenance grant.

Oxford’s access agreements reveal that:

  • In 2006-07, students whose residual household income is below £17,500 receive a bursary of £3,000 per year, plus an additional £1,000 in the first year of the course. About 1,200 students are expected to benefit.
  • From 2007-08, these rates increase to £3,070 and £1,025 extra in the first year.
  • From 2008-09, new entrants with a residual household income below £25,000 receive a bursary of £3,150, but all those with an income below £18,000 will receive an extra £850 in the first year of their course.
  • In 2009-10, these rates increase to £3,225 and £875 respectively. This is unchanged for 2010-11.
  • In 2012-13, students with a residual household income below £16,000 a year will receive a bursary of £3,300 per year, plus a tuition fee waiver of £5,500 in the first year of the course and £3,000 in subsequent years.
  • In 2013-14, these arrangements are unchanged.
  • In 2014-15, the bursary rate remains at £3,300, but the fee waiver is reduced to £3,000 a year.
  • In 2015-16, the bursary rate increases substantively to £4,500 per year. A more select group of Moritz-Heyman scholars (with residual income below £16,000 but also ‘flagged on a number of contextual data disadvantage indicators’ ) also receive an annual tuition fee waiver of £3,000

In more recent agreements, Cambridge’s maximum rate of bursary is available for all students below a residual income of £25,000, whereas at Oxford it is confined to students with a residual income of less than £16,000.

Hence Cambridge is comparatively more generous to students with a residual income above £16,000 but below £25,000.

Until 2015-16, the maximum bursary rates were broadly similar, but Oxford has now added a significant increase, offering £1,000 more than Cambridge. Moreover, a fee waiver remains in place for the most disadvantaged students.

Hence Oxford is now more generous to students with a residual income below £16,000. Oxford argues:

‘The University will be monitoring the level of students from households with income of less than £16,000. It is considered that these are the most financially disadvantaged in society, and it is below this threshold that some qualify for receipt of free schools meals, and consideration for the proposed pupil premium. The University does not consider that identifying simply those students who have actually been in receipt of free school meals provides a suitably robust indicator of disadvantage as they are not available in every school or college with post-16 provision, nor does every eligible student choose to receive them.’

The 2014-15 agreement states that 30% of 2012 entrants in receipt of the full bursary – and so with a household income of £16,000 or less – were educated in the independent sector. These students would of course be ineligible for FSM and pupil premium.

The 2015-16 agreement adds that roughly 10% of Home/EU full time undergraduates would qualify for such a bursary. This is supported by the University’s published admissions statistics for 2013, which give the percentage as 9.9% and the number of students as 297.

In 2013, we know that 2,510 admissions were from England, so we can estimate the number of English full bursary holders at approximately 250, of which some 175 were educated in the maintained sector.

But DfE’s destination indicators suggest that only some 25 of these were FSM-eligible.

And other DfE research suggests that only some 14% of students entitled to FSM are not claiming (though that rises to 22% for 15 year-olds).

Taking the latter figure, one might conclude that roughly 30 of the 175 were FSM eligible or non-claimants, so what of the remaining 145 (some 83%)?

It seems likely that they were drawn into residual household income of £16,000 or lower by some combination of:

  • Allowances for additional dependent children (£1,130 per dependent child)
  • Allowances for AVCs and other pension contributions
  • Other allowable expenses.

Interestingly Oxford’s 2013 admissions data shows that the proportion of its intake with incomes between £16,000 and £25,000 was roughly half that of the group with incomes below £16,000.

. 

Outreach

Cambridge

For 2006-2012, Cambridge divides its outreach provision into three categories:

  • Activity to encourage applications from under-represented groups to Cambridge. This is targeted at students in the first generation in their families to attend HE; those who attend schools or colleges with low or below average GCSE and A level performance; and those attending schools or colleges with little recent history of sending students to Cambridge. Three sub-categories are identified: information events for teachers and parents, residential Easter and summer schools and a miscellany of visits to Cambridge, visits to schools, masterclasses, workshops, study days etc.
  • Collaborative activities with other HE partners to raise aspirations and encourage participation. This includes regional Aimhigher projects and gifted and talented events provided through NAGTY.
  • General aspiration-raising activities for the HE sector generally. These are predominantly subject-based and online activities.

For 2012-16, Cambridge continues to describe its provision under the first and third of these categories, adding that both involve collaborative work. It also identifies a wider range of target groups:

‘These include children in care; students eligible for free school meals [NB]; Black, Asian and minority ethnicity students; mature learners; students educated in further education colleges; and bright students in schools and colleges which have not historically sent students to the University of Cambridge.’

‘Or previously eligible’ is added to FSM eligibility in later iterations.

The description of provision is short, mentioning a national programme of visits and events provided by colleges through an Area Links Scheme plus centrally provided summer schools and taster events.

Five priorities are identified:

  • Increasing the number of places available on events with demonstrable impact, particularly summer schools, taster days and events for teachers.
  • Preserving the legacy of local Aimhigher work.
  • Providing a sustained programme of advice and activities for younger students in local secondary schools.
  • Developing initiatives to encourage state school students to choose appropriate subject combinations and apply to selective universities and.
  • Working closely with Oxford

A sixth priority is added in 2013-14 – ensuring PGCE intakes reflect the population from which Cambridge recruits and building networks of graduate teachers to support wider outreach activity.

In 2014-15 these priorities are unchanged, except that the second and third are conflated into one. There is also an added reference to the long-term nature of some of this work:

‘A number of our initiatives engage with younger age groups and consist of a series of sustained engagements over a number of years. For example, our work in Cambridgeshire and with looked-after children involves secondary school students of all ages, whilst our core programme for black, Asian and minority ethnicity students is delivered to each cohort over a three year period.’

.

Oxford

Oxford’s outreach activity is harder to synthesise, because the agreements vary more often and some of more recent are so much more detailed.

In its 2006-07 Agreement, Oxford establishes a distinction between activities designed to encourage applications to the University and more general aspiration-raising activities.

However, these are not separately identified in the list it provides, which includes:

  • Hosting Aspiration Days for students from Years 9-11 drawn from ‘Oxford’s specific “target areas”’
  • A HEFCE specialist summer school for 150 Year 11 students from under-represented groups
  • Local Aimhigher provision
  • A programme of some 500 annual outreach visits targeting schools and colleges with little history of sending students to Oxford or into HE more generally
  • A Year 12 Sutton Trust Summer School for 250 students from non-traditional backgrounds
  • A programme of regional events to encourage applications from non-traditional backgrounds
  • A programme of events for teachers from schools with little history of sending students to Oxford, supporting some 100 teachers a year
  • Support for student-led programmes including the Oxford Access Scheme (for students from inner city schools) and a Target Schools Scheme run by the Student Union
  • A Further Education Access Initiative reaching 100 colleges a year and
  • Subject-specific enrichment activities.

In the following year, the items on the list change slightly. The University is said to be undertaking a thorough audit of these activities.

By 2008-09, Oxford describes the objective of its access work as increasing representation from: state school students, students from lower socio-economic groups, students from BME groups and care leavers.

It is focused on two areas: increasing the number of high quality applications from target groups and ensuring fair admissions processes. It undertakes wider aspirations-raising work on top of this.

The list of central access initiatives annexed to the agreement is missing.

For 2009-10 and 2010-11, the agreement refers to ‘detailed operational plans’ being developed to achieve its objectives.

By 2011-12, Oxford has added a third area of focus to the two immediately above: ensuring that teachers and advisers are able to support intending applicants.

Detailed operational plans are still under development. However, the subsequent agreements introduce several key elements:

  • UNIQ residential summer schools for Year 12 students. Participants are selected on the basis of GCSE A* performance compared with their average school attainment, ACORN postcode, school’s history of sending pupils to Oxford and any care history. A personal statement is also required. There were 380 participants in 2009, rising to 500 in 2010. Capacity is projected to increase to 650 in 2011, 700 in 2012, 850 in 2013, and 1000 participants in 2014.
  • By 2012-13, two other ‘flagship programmes’ are identified: a programme of seven regional one-day teacher conferences and a link programme connecting every local authority with a named college. Participants in the teacher conferences are drawn from schools and colleges with low numbers of students achieving high grades or limited success in achieving offers. Oxford’s target is a 15% success rate for applications from these teachers’ schools.
  • In 2013-14, there is the first reference to a Pathways Programme – longitudinal provision for students across Years 10-13 in schools with little history of engagement with Oxford. By 2014-15 this has expanded to accommodate 500 Year 12 students attending study days and 1,800 Year 10 students attending a taster day. In the 2015-16 agreement there is reference to 3,000 participants.
  • The 2012-13 agreement also outlines a system of access flags attached to certain student applicants, denoting educational and social disadvantage. Some 500 applicants were flagged in 2009/10, 630 in 2010/11 and 928 in 2011/12. The intention is that flagged candidates will achieve the same success rate in receiving offers as all applicants from the same sector. (The sectors specified are comprehensive, grammar, FEC, 6FC and independent). A flag for students from low participation neighbourhoods is incorporated from 2011-12 and one for students from schools and colleges with historically low progression to Oxford is introduced in 2012-13. The 2014-15 agreement notes that the proportion of flagged students achieving an offer and subsequently admitted has risen from 15.6% in 2010-11 to 17.2% in 2011-12. The gap between the success rate of flagged applicants and all UK-domiciled applicants has also fallen from 6.4% to 5.6%. In the 2015-16 agreement, the offer rate for flagged candidates is reported as being 19.1% in 2012-13 and 21.9% in 2013-14 However, there is no comparison with the sector-specific data for all applicants.

The 2012-13 agreement is the first to mention the preparation of an Oxford Common Framework for Access but this is not ready until the publication of the 2014-15 agreement.

In that agreement, Oxford describes a four-fold approach it has developed for targeting different types of schools:

  • The large proportion producing few students with the necessary attainment to apply to Oxford – highly tailored individual activities such as UNIQ, school-cluster visits and the student union’s student shadowing scheme.
  • Schools with little history of sending students to Oxford or students who have been relatively unsuccessful – application and interview preparation workshops and awareness-raising events.
  • Schools where there are many high-attaining students but little history of sending students to Oxford – increase understanding of the application process and break down myths.
  • Schools who have significant numbers of successful applicants – maintain a working relationship.

Targets

.

Cambridge

Cambridge begins by adopting selected HESA benchmarks, even though these have:

‘severe limitations in a Cambridge context, in that they take insufficient account of the University’s entry requirements, both in terms of subject combinations and of levels of qualification. We hope in due course to develop our own internally derived milestones or, alternatively, consider the applicability of any milestones which OFFA might develop.’

Three targets are adopted:

  • Increasing the proportion of UK undergraduates from state schools or colleges to between 60% and 63%, compared with a HESA benchmark for 2001-02 of 65%.
  • Increasing the proportion of students admitted whose parental occupation falls within NS-SEC 4-7 to 13-14%, compared with a HESA benchmark for 2001-02 of 13%.
  • Increasing the proportion of students from low participation neighbourhoods to approximately 8-9% compared with the HESA 2001-02 benchmark of 7%.

For 2010-12, the third of these targets is lowered to 5-6% because HESA has changed the basis of its calculation, reducing Cambridge’s benchmark by 33%.

By 2012-13, the first of these targets is described as the University’s ‘principal objective’, so it is deemed more important than improving fair access for disadvantaged students. This statement is subsequently removed, however.

The third objective is again recalibrated downwards, this time to 4%, because:

‘Currently HESA performance indicators and other national datasets relating to socio-economic background do not take adequate account of the entry requirements of individual institutions. Whilst they take some account of attainment, they do not do so in sufficient detail for highly selective institutions such as Cambridge where the average candidate admitted has 2.5 A* grades with specific subject entry requirements. For the present we have adjusted our HESA low participation neighbourhood benchmark in line with the results of our research in relation to state school entry and will use this as our five-year target….We will seek data through HESA or otherwise to amend or update our target in relation to socio-economic background in a revised access agreement next year.’

A paper is available explaining the recalibration (applying a scaling factor of 0.88)

Two new targets are also introduced: a retention benchmark and a process target relating to the minimum number of summer school places.  There will be a minimum of 600 places a year for the next five years.

The substantive details are unchanged in all subsequent agreements.

Oxford

In its 2006-07 access agreement, Oxford discusses setting a performance indicator for recruitment from the maintained sector, adding that from 2006 it will begin to collect data on recruitment from lower socio-economic groups.

In 2007-08 it notes that recruitment from SEG 4-7 ‘increased by 7% and drew the University closer to its benchmark’.

In 2008-09, Oxford is continuing to monitor participation by SEG 4-7 and planning to introduce an internally developed benchmark, adjusted to reflect the high attainment required for entry to Oxford. By 2009-10/2010-11, work is still ongoing to develop such a benchmark.

In 2011-12 it seems still not to be ready, but in 2012-13 Oxford introduces its current indicators:

  • Increase the percentage of UK undergraduates at Oxford from schools and colleges which historically have had limited progression to Oxford.
  • Increase the percentage of UK undergraduate students at Oxford from disadvantaged socio-economic backgrounds. ACORN is adopted because:

‘The University has found the ACORN information to be the most accurate source of verifiable information to highlight socioeconomic factors that may signify disadvantage, and has used it as a contextual flag in the undergraduate admissions process since 2008-9, and also as a factor when selecting participants for the UNIQ summer schools programmes.’

  • Increase the percentage of UK undergraduate students at Oxford from neighbourhoods with low participation in higher education. This utilises POLAR quintiles 1 and 2 ‘in line with HEFCE and OFFA recommendations’.
  • Meet the HEFCE benchmark on disabled students at Oxford.

It supplements these with three ‘activity targets and outcomes’:

  • 60% of those participating in the UNIQ summer schools make an application to Oxford, and 30% of those applying to receive an offer of a place.
  • Improve the participation, application, and success levels from schools and colleges who have had teachers attend the Regional Teacher Conferences, where these schools and college have either a limited numbers of qualified candidates or where there historically has been limited success in securing offers.
  • Using contextual information in the admissions process to identify candidates who may be suitable to be interviewed on the basis of either time in care, or socio-economic and educational disadvantage. The expectation is that identified candidates would then achieve the same success rate in receiving offers as all applicants to Oxford from equivalent school or college sectors.

These are unchanged in subsequent agreements though, as we have seen, there is no reporting of flagged applicants’ success compared with all students in their respective sectors, only compared with all applicants.

Commentary

There are, within the series of access agreements, valuable insights into the thinking within Oxford and Cambridge about such issues. Here is an annotated selection, presented in broadly chronological order:

  • Improvement will take time: ‘Cambridge will continue to strive to encourage applications from qualified applicants from groups currently under-represented and to admit a greater proportion of them within the context of our admissions policies and without compromising entry standards. Experience has, however, demonstrated that outreach activity takes time to alter the composition of the student population.’ (Cambridge, 2006-10)
  • Partnership and collaboration is necessary: ‘In setting itself these objectives, the University recognises that the problems relating to access to higher education are complex and deep-seated, and beyond the capability of the University to solve by itself. They require the input of all parts of the organisation to address, and indeed the input of agencies external to the University. Oxford is committed to playing its part in addressing these issues…’ (Oxford, 2008-09)
  • Increases in intake are unlikely: ‘Because, in part, of the full-time, residential nature of Cambridge’s undergraduate courses, it is unlikely that the university’s undergraduate intake will significantly increase over the next five years.’ (In 2012-13, this is qualified by the addition of the phrase ‘…beyond the colleges’ capacity to admit them’, but this is dropped again the following year.) (Cambridge 2006-10 and 2012-13)
  • Access is focused on application rather than admission: ‘The selection process aims to identify the most able, by subject, from among a very highly qualified field of candidates. While the purpose of our access work is to ensure that all students who are likely to be able to meet the required standards have the opportunity to apply, our admissions procedures aim to select those candidates who best meet our published selection criteria.’ (Oxford, 2012-13)
  • The balance of expenditure in favour of bursaries is justified: Whilst mindful of OFFA guidance on this subject, we do not believe that there is a sufficient body of evidence that greater benefit would be derived from different proportions of expenditure. As suggested above…we believe that our financial support has a significant bearing on retention. We have also taken full account of student feedback in the formulation of the present scheme. Students have confirmed during the current year that they do not want to see a reduction in bursary levels. It should be noted that the level of expenditure on outreach activity outlined in this agreement is supplemented from very substantial funding through other sources, and so we believe our commitment in this area to be considerable and appropriate.’ (Cambridge 2013-14)
  • This balance of expenditure in favour of bursaries is open to challenge: ‘Our package of financial support to undergraduate students, through both tuition charge waivers and maintenance bursaries, is expected to contribute in broad terms to meeting the targets and outcomes. As yet, however, the evidence for a demonstrable connection between financial support for students and improvements in access to higher education amongst under-represented groups is unclear. We will continue to review our position on the basis of further evidence and analysis.’ (Oxford, 2012-13)
  • Explanations of limited progress: Progress against these targets in 2012 has proved extremely challenging, particularly against the backdrop of the new funding regime combined with a demographic decline in the number of school leavers. In relation to the three targets dealing with educational, social and economic disadvantage, Oxford has seen both a decline in applicants and a decline in the number of students that have been admitted…Oxford will continue to focus its outreach efforts and resources on recruiting and encouraging a wider range of student to apply successfully to the University (Oxford 2014-15)
  • Student funding reforms have depressed performance: ‘The 2011, 2012 and 2013 entry cycles proved atypical, given the extensive changes to student funding, and this was reflected in the limited success against the targets…The provisional figures for 2014 entry, however, indicate that we have made headway across the board, particularly in regard to candidates who are from postcodes with high levels of socio-economic disadvantage using the Acorn (A Classification Of Residential Neighbourhoods) postcode classification. …Sustained long term outreach activity takes time to show in the admissions process, and the need to allow a five year period to assess progress has been reiterated by Oxford on a regular basis.’ (Oxford 2015-16)
  • Potentially negative impact of A level reform: ‘We are concerned that current proposals for A-level reform would significantly reduce student choice and flexibility; in particular, the lack of formal end of Year 12 examinations will adversely affect student confidence and the quality of the advice they receive about higher education options, and also prevent institutions such as Cambridge from accurately assessing current academic performance and trajectory. If effected these proposed reforms could have a significant bearing on our ability to make progress on access measures.’ (In 2015-16 there is also concern ‘…that proposed funding arrangements would effectively restrict students in many state schools to three A-levels, meaning that the opportunity to study extremely valuable fourth subjects such as Further Mathematics would be lost.) (Cambridge, 2014-15 and 2015-16 
  • There is an evidence base for effective practice ‘There is also increasing evidence that sustained work with students over a longer period of time is more effective than one-off interventions, particularly if this work is tailored to the requirements of each age group.’ and ‘Research into access activities has identified that, provided they have a sufficient depth of content, summer schools are a particularly valuable experience for students who have higher academic achievements and aspirations than others in their peer group.’ (Oxford 2014-15 and 2015-16)
  • Universities’ role in raising attainment: There is a larger question about the role of universities in raising attainment rates within schools. Universities can, and Oxford does, work in partnership with schools, local authorities, and third parties to form collaborative networks that can work together to raise the attainment rates of students from the most deprived backgrounds’ (Oxford 2014-15)

Some of these issues will be picked up again in the final section of this post.

.

Oxbridge’s Signature Access Programmes

This section reviews information about key programmes within each university’s access portfolio that reflect their long-term commitment to residential programmes and a more recent focus on longer-term partnership programmes targeting secondary students from disadvantaged backgrounds.

Before engaging with these specific programmes, it is important to give a sense of the full range of activity presently under way. In Oxford’s case, the most recent 2015-16 access agreement provides the basis for this. In Cambridge’s case, I have drawn on online material and an online brochure.

Cambridge’s Access Portfolio 

Cambridge’s Outreach and Access webpages provide details of:

  • Insight supporting students attracting the Pupil Premium in Year 9 through to Year 13 (see below)
  • Experience Cambridge, a 3-week subject-specific academic project, undertaken predominantly through the University’s VLE.
  • HE+, a pilot programme involving regional consortia of state schools and colleges working with their link Cambridge College to enable their academically able students to make competitive applications to selective universities including Cambridge.
  • HE Partnership, an aspiration-raising initiative targeting Year 9-11 students in Cambridgeshire and Peterborough schools with lower than average progression rates – and particularly students attending them with no family background of attending higher education.

A separate Raising Aspirations booklet mentions, in addition:

  • The Subject Matters, events for Year 11 students to support their A level subject choice
  • Year 12 subject masterclasses
  • A Black Asian and minority ethnicity (BAME) outreach programme
  • Further education and mature student outreach
  • Various examples of outreach by University Departments
  • Activity under the College Area Links Scheme
  • The CUSU Shadowing Scheme
  • Open Days
  • Oxford and Cambridge student conferences
  • Participation in higher education conventions

Oxford’s Access Portfolio

Oxford’s 2015-16 access agreement describes:

  • Briefings for Teach First and PGCE students which typically attract 150 students annually.
  • An annual programme of school and college visits, which involved over 3,300 UK schools and colleges in 2012-13. These are undertaken through Link Colleges (see below).
  • Target Schools, an OUSU programme involving undergraduate visits and student Shadowing Scheme.
  • A variety of Departmental and subject-specific outreach activities

Cambridge: Sutton Trust Summer Schools 

Sutton Trust summer schools are subject-specific residential courses for Year 12 students. They are currently provided at ten institutions including Cambridge. There are about 2,000 places nationally and Cambridge accounts for 550 of them.

Cambridge offers 26 five-day courses in July and August, hosted by six of its colleges. They are free to attend. The providers meet all costs including travel to and from the venue, food and accommodation.

Successful applicants must meet most or all of the following eligibility criteria:

  • In the first generation of their family to attend university (in fact this means neither parent has a first degree or equivalent)
  • Eligible for FSM [not pupil premium] during secondary education
  • Have achieved at least 5A*/A grades at GCSE or equivalent and be taking subjects relevant to the summer schools they wish to attend
  • Attend schools/colleges with a low overall A level point score (typically below the national average) and/or low progression to HE
  • Live in neighbourhoods with low progression rates to HE and/or high rates of socio-economic deprivation.

Participants must attend a UK state-funded school or college, so those attending independent schools are ineligible, even if they have moved subsequently into a state sixth form. Priority is given to children who are, or were formerly, looked after or in care.

Cambridge’s website says:

‘We look at a combination of the contextual priority criteria met and GCSE grades (or equivalent) in subjects relevant to the course for which you have applied. In 2014, the majority of our 550 summer school participants met two or more of these criteria.’

In answer to the question ‘does attending a summer school increase my chances of getting a place at Cambridge, the University says:

‘Applications to the University are completely separate from the Summer Schools and use different criteria to those of the Summer School.  Admissions Tutors will not know whether an applicant has attended a Summer School, unless you choose to mention it in your personal statement…Equally, being unsuccessful in a summer school application does not correlate to the likelihood of being accepted to Cambridge as an undergraduate: we use very different criteria and it is in no way a statement about your academic record or potential.’

. 

Oxford: UNIQ summer schools

The UNIQ summer schools website describes a very similar animal. It is also targeted at Year 12 students in state schools and colleges. The courses are also one-week, subject-specific residential experiences undertaken during July and August. All costs are covered.

According to the access agreements Oxford planned to increase the number of places available to 1,000 in 2014 and achievement of this outcome is confirmed in the published statistics, which add that there were 4,327 applications and that 507 ‘near miss applicants’ were invited to undertake other outreach activities.

Interestingly though, the number of places available in 2015 fell back substantially, to 850. The number of courses was 35, unchanged from 2014, suggesting a drop in the average number of students per course from 29 to 24.

Courses are categorised according to whether they are in Humanities, Medical Sciences, Mathematical, Physical and Life Sciences or Social Sciences. Sixteen of the 35 are in Humanities subjects.

The eligibility criteria are also similar to those for Sutton trust summer schools, but  those relating to disadvantage are not described with any degree of specificity . They include:

  • The number of A* GCSE grades achieved compared with the average for the applicant’s school when they took GCSEs. (Applicants are only permitted to have completed one A level.)
  • Academic attainment and history of progression to Oxford at the school or college where the applicant is taking A levels
  • ACORN postcode data
  • POLAR 3 data and
  • The quality of a personal statement

Applications from looked after children are considered ‘on an individual basis’.

A referee, normally a teacher, needs to confirm the details of their application.

Students who complete a UNIQ summer school fulfil the requirements for the ASDAN Universities Award.

The website adds that from 2015, Oxford is ‘running a virtual learning programme for selected applicants’.

The answer given to the question ‘Will attending a UNIQ summer school make it more likely that I will get a place at Oxford University says:

‘Students who attend UNIQ and decide to apply to Oxford University do not receive any preferential treatment at the application stage.

Admissions tutors who make decisions about undergraduate offers select entirely on academic merit. Unless students mention on their UCAS Personal Statement that they have attended the UNIQ Summer School, admissions tutors will not know, as we do not provide them with separate information.’

Cambridge: Insight 

Insight is described in the guide for teachers as:

‘an [sic] multidisciplinary programme which aims develop [sic] and broaden students’ academic interests and tackle the barriers many students face when applying to university. We hope to achieve this through inspiring subject days, discussions with current university students and academics and sessions about university.’

Eligible students are in Year 9, attract the Pupil Premium, can travel to and from Cambridge in a day and are ‘on track to achieve Level 7 English, maths and science but [sic] the end of Key Stage 3’.

The programme is predominantly focused on six London boroughs, but applications are also invited from non-selective state schools elsewhere with ‘above average eligibility for free school meals’.

There is a series of Saturday and holiday events, including:

  • Core sessions, including an introductory event in the Spring term of Year 9 and ‘Subject Matters’ – events to support A level choices – in the Autumn Term of Year 11.
  • Additional subject days provided throughout Years 10 and 11
  • A one-night residential at the end of Year 10 and a four-night residential at the end of Year 11 for ‘those who have shown enthusiasm and commitment to the programme’.
  • A regular email newsletter during Years 12 and 13 providing information about open days, masterclasses, residentials and competitions.

The programme is free of charge.

I could find no evaluation of the impact of this programme, which is not mentioned in Cambridge’s ‘Raising Aspirations’ brochure, even though it seems to be their only substantial long term programme targeting disadvantaged students outside the local area

.

Oxford: Pathways Programme 

The website describes Pathways as an initiative co-ordinated by Oxford’s colleges with support from the Sutton Trust.

‘The programme aims to provide information, advice and guidance on higher education and Oxford to academically able students, and staff members, in non-selective state schools with little history of student progression to Oxford.’

The components are:

  • Year 10 taster days which provide sessions on higher education and student finance. Applications are made by schools, which need to be in the state sector, ‘usually without sixth forms’ and with little or any history of sending students to Oxford.
  • Year 11 investigating options events, focused on the significance of GCSE results and post-16 choices. These are aimed at students who have undertaken a taster event who attend schools fitting the description above. Schools are encouraged to bring up to ten students. There are also two subject-focused days, one devoted to Medicine, the other to Humanities.
  • Year 12 study days providing a taste of subject-specific university-level study. This involves two taster sessions undertaken in small groups, two talks from admissions tutors and a college tour. There are twenty-one subjects offered. Participants are from non-selective state schools and colleges. They are normally expected to have at least 5 GCSE A* grades (7 for medicine) and be predicted to achieve at least 3 A grades at A level, or equivalent.
  • A Year 13 application information day, providing advice on personal statements, tests and interviews. These cover seven broad subject areas. Participants are again drawn from non-selective state schools and colleges.

Although not confined to students from disadvantaged backgrounds, teachers are advised that:

‘When selecting participants for the Year 12 and 13 events, we also take into account socio-economic data, such as parental HE participation and eligibility for benefits or free schools meals.’

The Sutton Trust explains that Pathways involved almost 3,000 students and 400 teachers in its first year. The Trust is funding the further development of the Year 12 and 13 components.

I could find no separate evaluation of the effectiveness of Pathways.

Strengths and weaknesses of Oxbridge provision

.

Summer schools 

Both Oxford and Cambridge place extensive reliance on the effectiveness of summer schools as an instrument for improving access, with summer school provision forming the centrepiece of their respective strategies.

The evidence base in support of this strategy appears relatively slim. Both appear to be relying principally on evaluation of the Sutton Trust’s programme.

The Sutton Trust appears to publish an annual Targeting and Progression Report, but the 2014 edition has all the institution-specific data stripped out, which is not entirely helpful.

However, it does reveal that, amongst applicants for summer schools in all ten locations, only:

  • 59.5% were from the first generation of their family with experience of HE.
  • 54.8% came from schools and colleges with below average A level point scores and/or low progression rates to HE.
  • 29.9% were in Polar 2 quintiles 1 or 2.

There is no reference to the FSM eligibility criterion, so presumably that was not in place last year.

There is limited information about the status of those accepted onto courses. Between them, the document and a parallel powerpoint presentation tell us that:

  • The majority of attendees met two or three of the eligibility criteria
  • 77% met three of the criteria, but we don’t know which three
  • 85% met the ‘first generation’ criterion
  • 74% ‘came from schools with low attainment’
  • 49% ‘lived in areas with the lowest level of progression to university’ (presumably Polar quintiles 1 and 2).

Given the focus of this post, the last outcome is particularly disappointing, since it means that over half were not disadvantaged on the Trust’s only measure. Perhaps the additional FSM criterion has been introduced in an effort to secure a larger majority of applicants from disadvantaged backgrounds.

The presentation also reveals that the Trust specifically targeted 900 ‘hard to reach schools’ which eventually supplied 257 attendees, 88% of them meeting three or more of the eligibility criteria.

The implication must be that, if such an exercise had not taken place, the proportion of attendees from disadvantaged backgrounds would have been significantly lower.

The Report also reveals that, of the 2012 Sutton Trust summer school cohort, 58% of university applicants took up a place at a Russell Group university. A total of 125 students (10% of the cohort) accepted a place at the institution that hosted their summer school.

Oxford publishes information about its summer schools in its access agreements.

The target is for 60% of participants to apply and for 30% of applicants to receive an offer. The University also aims that summer school participants will have the same success rate in securing an offer as the average for all applicants from the state sector.

Each agreement provides detail about the number of participants who apply to Oxford, the number receiving offers and the proportion of those from ACORN groups 4 and 5.

These are summarised in Graph 4, below, which illustrates that the impact on recruitment of students from ACORN 4 and 5 postcodes is not fully commensurate with the increase in the number of participants.

Oxbridge graph 3

Graph 4: Impact of UNIQ summer schools, 2010-2013

.

Oxford also provides details of the proportion of summer school participants from Polar quintiles 1 and 2 receiving an admission offer, for 2011 (19.5%), 2012 (15%) and 2013 (20.3%). In 2013, the comparable ‘success rate’ for all applicants to the University was 20.1%.

The evaluation evidence cited by Oxbridge is captured in a Sutton Trust Summer School Impact Report, dating from 2011. This is based on analysis of the 2008 and 2009 summer school intakes, when course were located at Bristol, Nottingham and St Andrews, as well as at Oxford and Cambridge.

It concludes that:

  • Summer schools successfully select students who fit the eligibility criteria (though that is not entirely borne out by the more recent outcomes above).
  • Amongst the disadvantaged cohort, less disadvantaged students are more likely to take up places than their more disadvantaged peers.
  • However, attending a summer school closes the gap between the success rates – in terms of obtaining admission offers – of more and less disadvantaged students. Exactly why this happens is unclear.
  • There are significant differences between universities. Cambridge exhibits ‘relatively poor conversion of attendees into applications (not least when compared to the equivalent performance of Oxford)’

The overall conclusion is that summer schools do have a positive impact, compared with control groups, but the study does not offer recommendations for how they might work better, or consider value for money.

The closing section notes that:

‘They achieve this by raising two of the three ‘As’ of the WP canon – student awareness and student aspirations. It may not directly enhance the third – student attainment – though summer schools can support students’ study skills – but the growing adoption of a ‘contextual data’ approach to the treatment of university admissions should be to the further benefit of the sorts of students who pass through summer schools.’

Overall then, summer schools have a positive impact, but if we are judging their efficiency as a mechanism for improving the intake of students from disadvantaged backgrounds, it is clear that there is extensive deadweight. They might be better targeted on the most disadvantaged students.

If this is true of summer schools it is almost certainly true of other elements of Oxbridges’s access programmes.

.

Other more general issues 

  • A smorgasbord of provision: It is evident that both Oxford and Cambridge are engaged in multiple overlapping initiatives designed to improve access, both to their own institutions and to selective HE more generally. At Offa’s behest, they are targeting several sub-populations. The 2016-17 guidance on completing access agreements invites them to consider a variety of under-represented groups: minority ethnic students, disabled students, care leavers and students in care, part-time students, mature students, medical students, PGCE students. There seems to be a tendency to invent a series of small targeted initiatives for each subgroup, rather than focusing principally on two or three substantial programmes that would make a real difference to core target groups. 
  • Too many priorities too vaguely expressed: Both universities identify core priorities through the targets they have selected. In Oxford’s case those involve increasing representation from: schools and colleges with limited progression to Oxford; postcodes associated with significant socio-economic disadvantage; postcodes associated with low HE participation; and disabled students. However the first three overlap to some extent and recent access agreements do not indicate the relative priority attached to each. In Cambridge’s case only two targets relate to admissions, one focused on increasing representation from state schools, the other from low participation postcodes. In older agreements, the former has clear priority over the latter but it is unclear whether this remains the case. Offa’s framework requires simplification so that both universities have no option but to prioritise admissions from disadvantaged learners educated in state-funded institutions. It should be much clearer exactly which activities are dedicated to this end and what funding is allocated for this purpose. 
  • A plethora of measures: The Offa system permits Oxbridge and other universities too much leeway in defining the populations whose access they seek to promote and in determining how they measure success. This makes it harder to compare universities’ records and more complex to harmonise with the measures most often applied in schools and colleges. If universities refuse to foreground eligibility for the pupil premium and for FSM, they should at the very least publish annual data about the proportion of their intake falling within these categories, and without the present two year time lag.
  • Limited transparency: There is too much variability in the degree of transparency permitted by the Offa framework. Oxford provides much more data in its access agreement than does Cambridge, but the range of data published in support of fair access is limited across the board. Within the bounds of data protection legislation, it should be possible for the university to state each year, without a two-year timelag, what proportion of their intake fall within certain specified categories, how those vary between subjects and the range of attainment demonstrated in each case. The publication of such material would go a long way towards removing any sense that Oxbridge is overly defensive about these issues. 
  • Limited investment in long term collaborative programmes: Summer schools are valuable but they do not impact early enough, nor do they raise attainment. The Insight and Pathways programmes demonstrate growing recognition of the potential value of establishing long-term relationships with prospective students that begin as early as primary school and certainly before the end of KS3. Such programmes require schools, colleges and universities to preserve continuity for each eligible student through to the point of university entry. Existing programmes are insufficiently intensive and reach too few students. Scalability is an obvious issue. 
  • Negligible involvement in attainment-raising work: Both Oxford and Cambridge state frequently that the principal obstacle to recruiting more disadvantaged students is the scarcity of sufficiently high attainment within the target group. Yet rarely, if ever, do they invest in long-term activities designed to raise these students’ attainment, seeming to believe that this is entirely a matter for schools and colleges. The precedent offered by university involvement in academy sponsorship and A level reform would suggest that there is no fundamental obstacle to much closer engagement in such activities.

.

Tackling the core problem

The proposed solution is a framework that supports a coherent long-term programme for all high-attaining disadvantaged students attending state-funded institutions in England, stretching from Year 7 to Year 13. These might be defined as all those eligible for pupil premium. An additional high attainment criterion, based on achievement in end of KS2 tests, could be introduced if necessary.

Such a programme could be extended to the other home countries and additional populations subject to the availability of funding.

The framework would position the school/college as the co-ordinator, facilitator and quality assurer of each eligible student’s learning experience (with handover as appropriate as and when a learner transfers school or into a post-16 setting).

It would stretch across the full range of competence required for admission to selective HE, including high attainment, personal and learning skills, strong yet realistic aspirations, cultural capital, access to tailored IAG etc.

On the demand side, the framework would be used to identify each student’s strengths and areas for development, and monitor progress again challenging but realistic personal targets.

From Years 7-9 the programme would be light-touch and open access for all eligible disadvantaged students. Emphasis would be placed on awareness-raising and the initial cultivation of relevant skills.

Entry to the programme from Year 10 would be conditional on the achievement of an appropriate nigh attainment threshold at the end of KS3. From this point, provision would be tailored to the individual and more intensive.

Continuation in subsequent years would be dependent on the student achieving appropriate high attainment thresholds and challenging interim targets.

Schools’ and colleges’ performance would be monitored through destinations data and Ofsted inspection.

On the supply side the framework would be used to identify, organise and catalogue all opportunities to develop the full range of competence required for admission to selective HE, whether provided by the student’s own school or college, other education providers in the school, college and HE sectors or reputable private and third sector providers.

Opportunities offered by external providers, whether at national or regional level, would be catalogued and mapped against the framework in a searchable national database. Schools and colleges would be responsible for mapping their own provision and other local provision against the framework.

Each student would have a personal budget supplied from a central fund. Personal budgets would be administered by the school/college and used to purchase suitable learning opportunities with a cost attached. The fund would be fed by an annual £50m topslice from the pupil premium. This would cover the full cost of personal budgets.

The annual budget of £50m per year might be divided between:

  • Light-touch open access activities in Years 7-9 – £10m
  • Intensive programme in Years 10-13 – £10m per year group.

The latter would be sufficient to support 5,000 eligible students to the tune of £2,000 per student per year, or 4,000 to the tune of £2,500.

By comparison, DfE’s destination indicators suggest that, in 2012/13, ‘top third’ universities admitted 2,650 FSM-eligible students; some 1,520 of these were admitted to Russell Group universities and, of those, just 50 were admitted to Oxbridge.

Selective universities would make a small contribution, the sum adjusted to reflect their comparative performance against fair access targets. These contributions would be used to meet the administrative costs associated with the programme. Total annual running costs have not been estimated but are unlikely to be more than £2.5m per year.

Universities might choose to invest additional funding, covered by their annual Offa access agreements, in developing free-to-access products and services that sit within the supply side of the framework. Attainment-raising activities might be a particular priority, especially for Oxbridge.

Philanthropic contributions might also be channelled towards filling gaps in the supply of products and services where, for whatever reason, the market failed to respond.

Selective universities would have access to information about the progress and performance of participating students. Students would apply for higher education via UCAS as normal, but strong performers would expect to receive unconditional offers from their preferred universities, on the strength of their achievement within the programme to date.

Participation in the programme would be a condition of funding for all selective universities. All processes and outcomes would be transparent, unless data protection legislation prevented this. The programme would be independently evaluated.

Optionally, universities might be further incentivised to make unconditional offers and provide the necessary support during undergraduate study. The Government might pay the receiving university a fee supplement, 50% above the going rate, for every student on the programme admitted unconditionally (so up to £22.5m per cohort per year assuming a supplement of £4,500 and 100% recruitment). This supplement would not be provided for conditional offers.

The Government would also claw back the full fee plus the supplement for every student on the programme – whether admitted conditionally or unconditionally – who failed to graduate with a good degree (so £40,500 per student assuming a 3-year degree and a £9,000 fee).

GP

March 2015

Digging Beneath the Destination Measures


This post takes as its starting point the higher education destination data published by the Department for Education (DfE) in June 2014.

turner-oxford-high-stIt explores:

  • The gaps between progression rates for students from disadvantaged backgrounds (defined in terms of eligibility for free school meals) and those of their more advantaged peers.
  • How these rates vary according to whether the students come from schools or colleges and the selectivity of the higher education to which they progress.
  • Regional differences, with a particular focus on Inner and Outer London.

Although these are officially classified as experimental statistics, they supply a valuable alternative perspective on national progress towards fair access for disadvantaged learners to selective universities.

Securing such progress is integral to the Government’s education and social mobility strategy, since it is embedded in DfE’s Impact Indicators, in BIS Performance Indicators and the Social Mobility Indicators. The DfE indicators depend on these destination measures.

The final section discusses the optimal policy response to the position revealed by this analysis. It:

  • Discusses the limitations of a free market solution combined with institutional autonomy, structural reform – especially the introduction of specialist post-16 providers – and the expected incorporation of these measures into the post-16 accountability framework.
  • Sets out the advantages of introducing a framework to support the market on both the demand and supply sides. This would secure a coherent and consistent menu of opportunities that might be targeted directly at the learners most likely to benefit. This might be undertaken at national or at regional level, including in London.
  • Suggests that – given the abundant evidence of stalled progress – the latter approach is most likely to bring about more immediate, significant and sustained improvement without excessive deadweight cost.

I am publishing this on the eve of The Brilliant Club’s Inaugural Conference, which asks the question

‘How can universities and schools help pupils from low participation backgrounds secure places and succeed at highly competitive universities?’

The organisers and participants are cordially invited to admit this second personal contribution to this debate, for I have already written extensively about the particular problem of fair access to Oxbridge for disadvantaged learners.

That post exposed some rather shaky statistical interpretation by the universities concerned and proposed a series of policy steps to address the worryingly low progression rates to these two universities. I will refer to it occasionally below, keeping repetition to a minimum. I commend it to you as a companion piece to this.


The Destination Data

DfE published SFR 19/2014: ‘Destinations of key stage 4 and key stage 5 pupils: 2011 to 2012’ on 26 June 2014.

These are described as ‘experimental statistics…as data are still being evaluated and remain subject to further testing in terms of their reliability and ability to meet customer needs’.

Nevertheless, subject to possible further refinement, DfE plans to incorporate KS5 destination measures into the new post-16 accountability arrangements to be introduced from 2016.  They are set to become increasingly significant for school sixth forms and post-16 providers alike.

The measures are based on student activity in the year immediately following the completion of A level or other Level 3 qualifications.

Students are included if:

  • They are aged 16, 17 or 18 and entered for at least one A level or other L3 qualification. (Those entered for AS level only are therefore excluded.)
  • They ‘show sustained participation…in all of the first two terms of the year after…’ ie from October 2011 to March 2012. (Dropouts are excluded but there is provision to pick up students transferring from one provider to another.)

The time lag is caused by the need to match data from the national pupil database (NPD) and the Higher Education Statistics Agency (HESA). The most recent matchable dataset combines the HESA data for academic year 2011/12 with the KS5 performance data for academic year 2010/11.

The 2011/12 destination data includes partial coverage of independent schools for the first time, alongside state-funded schools and colleges, but my analysis is confined to state-funded institutions.

The measure of disadvantage is eligibility for free school meals (FSM). Students are considered disadvantaged if they were eligible for and receiving FSM meals at any point in Year 11, so immediately prior to KS5. This post typically uses ‘FSM’ or ‘FSM-eligible’ to describe this group.

FSM is a narrower definition of disadvantage than the Pupil Premium, which is based on FSM eligibility at any point in the preceding six years. These two definitions continue to have most currency in the schools sector, but are frequently disregarded in the higher education sector where several alternatives are deployed.

All measures of disadvantage have upside and downside and, having explored this issue extensively in my previous post about Oxbridge, I do not propose to cover the same ground here.

I will only repeat the contention that, far too often, those facing criticism for their failure to improve fair access will criticise in turn the measures adopted, so producing a smokescreen to deflect attention from that failure.

The analysis that follows draws principally on tables included in the underlying data published alongside the SFR. The presentation of the data in these tables – used in all the published material – is important to bear in mind.

All totals are rounded to the nearest ten, while any single figure less than 6 is suppressed and replaced with ‘x’.

Hence a total of ‘10’ is an approximation which might represent any figure between 6 and 14.

It follows that a calculation involving several totals may be even more approximate. To take an important example, the sum of five totals, each given as ‘10’, may represent anything between 30 and 70.

This degree of imprecision is less than helpful when smaller cohorts – such as FSM-eligible students progressing to the most competitive universities – are under discussion.

A more detailed and sophisticated explanation of the methodology supporting the measures can be found in the Technical Note published alongside the SFR.


Nature of the Total Population

Table 1, below, shows how the national population is distributed between state-funded schools and colleges – and between FSM and non-FSM students from each of those settings.


Table 1: Distribution of national KS5 population and numbers progressing to a sustained education destination 2011/12

State-funded schools State-funded colleges Total
FSM Non-FSM Total FSM Non-FSM Total FSM Non-FSM Total
No of students 11,100 153,480 164,580 17,680 153,230 170,910 28,770 306,720 335,490
Sustained education destination 8,020 114,470 122,490 10,430 90,830 101,260 18,450 205,300 223,760


Key points include:

  • Of the total KS5 student population of 335,490, only some 8.6% are FSM-eligible. Hence the analysis below is derived from a sample of 28,770 students.
  • Some 49% of this population attend mainstream state-funded schools compared with 51% at state-funded colleges. Total numbers are therefore distributed fairly evenly between the two sectors.
  • The FSM-eligible population attending schools is 6.7% of the total population attending schools and over 38% of the total FSM population. The former percentage is significantly lower than the proportion of FSM-eligible students aged 11-15 in the national secondary school population, which stood at around 16% in 2012.
  • The FSM-eligible population attending colleges is 10.3% of the total population attending colleges and over 61% of the total FSM population.

Hence the overall population is spread fairly evenly between schools and colleges, but a significant majority of the FSM-eligible population is located in the latter.

Furthermore:

  • The proportion of KS5 students progressing to a sustained education destination (as opposed to not progressing to any destination, or progressing to employment or training) is almost 67%, but amongst FSM-eligible learners this falls slightly, to 64%.
  • Amongst those attending schools, the proportion of FSM-eligible students progressing to a sustained education destination is approximately 72%; amongst those attending colleges it is much lower – some 59%.

The analysis below uses the total population as a base, rather than the proportion that progresses to a sustained educational destination.

The incidence of FSM-eligible students also varies considerably by region. Chart 1 below shows the percentage of FSM and other students in each region’s overall KS5 cohort.


Chart 1: Percentages of FSM and non-FSM in KS5 cohort by region 2010/11

Destinations chart 1


The percentage of FSM-eligible students ranges from as low as 4.3% in the South East up to 30.3% in Inner London – a vast differential.

Inner London has comfortably more than twice the incidence of FSM students in Outer London, the next highest, and some seven times the rate in the South East.

The sizes of these cohorts are also extremely variable. There are over 4,000 students in the FSM populations for each of Inner and Outer London, compared with as few as 1,400 in the South West region. Taken together, Inner and Outer London account for slightly over 30% of the total English FSM-eligible population.

However, the total KS5 population is far bigger in the South East (58,260) than in any other region, while Inner London (14,030) is the smallest population. The South East alone accounts for over 17% of the total KS5 cohort.

These variations – particularly the high incidence of FSM students within a relatively small overall KS5 population in Inner London – are bound to have a profound effect on progression to higher education.

The concentration in Inner London is such that it will almost certainly be a relatively easy task to prioritise FSM students’ needs and also achieve economies of scale through provision across multiple schools.

There will be heavy concentrations of FSM-eligible students in many secondary schools, as well as in post-16 provision in both schools and colleges. Significantly fewer institutions – secondary or post-16 – will have negligible FSM-eligible populations.

There will be a similar effect in Outer London, though patchier and not so profound.


Progression to a UK Higher Education Institution

Table 2: National breakdown of numbers progressing to a UK Higher education institution, 2011/12

State-funded schools State-funded colleges Total
FSM Non-FSM Total FSM Non-FSM Total FSM Non-FSM Total
No of students 11,100 153,480 164,580 17,680 153,230 170,910 28,770 306,720 335,490
UK HEI destination 6,250 95,880 102,130 7,290 67,130 74,420 13,540 163,010 176,550


Table 2, above, shows that:

  • The overall proportion progressing to a UK higher education institution is almost 53%, but this falls to 47% for FSM-eligible students.
  • The proportion of FSM students attending schools that progresses to a UK HEI is 56% whereas the comparable proportion for those attending FE colleges is 41% – a significant difference of 15 percentage points.
  • The number of FSM students progressing from colleges (7,290) remains larger than that progressing from schools (6,250).
  • There is a six percentage point variation between the progression rates for FSM and non-FSM students attending schools (56% versus 62%). In colleges the variation is only three percentage points (41% versus 44%).

Chart 2, below, shows the percentage of the KS5 FSM cohort in each region progressing to a UK higher education institution, compared with the percentage of the KS5 non-FSM cohort doing so.

The overall progression rate for FSM-eligible students is very nearly twice as high in each of Inner and Outer London as it is in the South West, the lowest performing region.

Incredibly, in Inner London, the progression rate for FSM-eligible students slightly exceeds the rate for non-FSM students – and these two rates are also very close in Outer London


Chart 2: Percentages of FSM and non-FSM progressing to UK HE by region 2011/12

Destinations chart 2


There is relatively little disparity between the regional progression rates for non-FSM students – only 16 percentage points variation between the highest and lowest performing regions (63% in Outer London versus 47% in the South West), compared with a 30 percentage point variation for FSM students (63% in Inner London versus 33% in South West England).

Outside London, the regions with the smallest variation between progression rates for FSM and non-FSM respectively are the West Midlands (nine percentage points) and Yorkshire and Humberside (eleven percentage points). The largest variation is in the North East (seventeen percentage points).

It is worth labouring the point by noting that FSM-eligible students located in London are almost twice as likely to progress to some form of UK higher education as those in the South West and the South East, and more likely to progress than non-FSM students in every other region, with the sole exception of Outer London

London is clearly an outstanding success in these terms, so bearing out all the recent publicity given to London’s relative success in securing high levels of attainment while simultaneously closing FSM gaps.

Some other regions need to work much harder than others to close this widening participation gap.


Progression to Selective UK Higher Education

But does this marked disparity between London and other English regions extend to progression to selective universities?

The destinations data incorporates several different measures of selectivity, each a subset of its predecessor:

  • Top third: the top 33% of HEIs, as measured by their mean UCAS tariff score, based on the best three A level grades of students admitted (other qualifications are excluded). The subset of institutions within this group changes annually, although 88% of those represented in 2011/12 had been included for six consecutive years, from 2006/07 onwards. (The technical note includes a full list at Annex 1.)
  • Russell Group: institutions belonging to the self-selecting Russell Group,all of which are represented within the top third.
  • Oxbridge: comprising Oxford and Cambridge, two particularly prominent members of the Russell Group which, rightly or wrongly, are perceived to be the pinnacle of selectivity in UK higher education (an assumption discussed in my Oxbridge post).

The last two of these feature in DfE’s Impact Indicators, alongside the percentage of FSM-eligible learners progressing to any university. The first is utilised in the Social Mobility Indicators (number 13), but to compare progression from state and independent institutions respectively.

The sections that follow look at each of these in order of selectivity, beginning with a national level comparison between progression rates for schools and colleges and proceeding to examine regional disparities for schools and colleges together.


Progression to the Top Third

Table 3 compares numbers of FSM-eligible and non-FSM learners progressing to top third institutions from state-funded schools and colleges respectively.


Table 3: National numbers progressing to UK HEIs and ‘Top Third’ HEIs in 2011/12

State-funded schools State-funded colleges Total
FSM Non-FSM Total FSM Non-FSM Total FSM Non-FSM Total
No of students 11,100 153,480 164,580 17,680 153,230 170,910 28,770 306,720 335,490
UK HEI destination 6,250 95,880 102,130 7,290 67,130 74,420 13,540 163,010 176,550
Top Third destination 1,300 35,410 36,710 920 15,000 15,920 2,210 50,410 52,620


The numbers reveal that:

  • The overall progression rate for KS5 students to top third institutions is 15.7%, but this masks a difference of almost nine percentage points between non-FSM students (16.4%) and their FSM peers (7.7%). Hence non-FSM students are more than twice as likely to gain a place at a top third institution.
  • School-based students are much more likely to reach top third institutions than those at colleges (22.3% versus 9.3%). The same is true amongst the FSM population – the FSM-eligible progression rate from schools is 11.7%, compared with just 5.2% from colleges. This is a substantively larger differential than applies in respect of all UK higher education.
  • Whereas the raw number of FSM learners progressing to any UK HE destination is higher in colleges, the reverse is true when it comes to the top third.
  • Overall, almost 30% of KS5 students progressing to a UK HE institution make it to one in the top third. But whereas roughly one in three (31%) of non-FSM students do so, only one in six (16.3%) of FSM students manage this.
  • When it comes to FSM students from schools and colleges respectively, approximately one in five (20.8%) of FSM students from schools who progress to a UK HE institution make it to a top third institution, whereas this is true of around one in eight of those from colleges (12.6%).

In sum, there are very significant gaps at national level between FSM-eligible progression rates to all UK higher education on one hand and top third institutions on the other. There are equally significant gaps in the FSM progression rates to top third institutions from schools and colleges respectively.

Chart 3, below, compares FSM and non-FSM progressions to top third higher education institutions in different regions.


Chart 3: Percentages of FSM and non-FSM students in the overall KS5 cohort who progressed to ‘top third’ HEIs in 2011/12

Destinations chart 3

One can see that:

  • The highest rate for non-FSM students is 24% in Outer London. Inner London rates only fourth on this measure, having dropped behind the Eastern and South Eastern regions. It is only one percentage point above the national average.
  • The highest rate for FSM-eligible students is 12%, again in Outer London, with Inner London just behind at 11%. These are significantly higher than the next highest rates (7%) in the West Midlands and the South East.
  • The non-FSM rates exceed the FSM rates in every region. In the East and South West, the non-FSM rate is three times higher than the FSM rate and, even in Inner London, the gap is six percentage points in favour of non-FSM.

The huge differences between regional success rates for progression to all UK higher education and top third institutions respectively are illustrated by Chart 4.


Chart 4: Comparison of regional progression to all UK HE and ‘top third institutions, comparing FSM and non-FSM, 2011/12

Destinations chart 4

It is immediately clear that the top third progression rates are invariably much lower than for progression to all UK higher education institutions, for both FSM-eligible and non-FSM students.

  • The gap at national level between non-FSM students progressing to all institutions and top third institutions is 37 percentage points (53% versus 16%). The comparable gap for FSM students is 39 percentage points (47% versus 8%). So whereas almost half of FSM students progress to any UK higher education institution, fewer than one in ten progress to ‘top third’ institutions.
  • Whereas Inner London recorded 63% of FSM students progressing to all institutions and Outer London wasn’t far behind at 62%, their comparable percentages for FSM progression to ‘top third’ institutions are 11% and 12% respectively. Both these gaps – standing at 50 percentage points or so – are huge, and significantly larger than the national average of 39 percentage points. The smallest gap between these two progression rates for FSM students is 27 percentage points in the South East. So the gap in London is almost twice the size of the gap in the South East. Moreover, the gap between these two rates is larger for non-FSM than FSM students in every region outside London, where the reverse is true.
  • On the other hand, whereas nationally there is a ratio of around 6:1 between FSM progression rates to UK higher education and top third institutions respectively, this falls to around 5:1 in both Inner and Outer London. Conversely it reaches 9:1 in the North East

Overall, it is clear that London leads the way on both measures of FSM progression. But the huge lead London has established in terms of progression to all UK higher education only serves to emphasise their rather more limited progress against the more demanding benchmark. That said, London is still achieving close to twice the rate of the next best region on the more demanding measure.


Russell Group

We might expect a broadly similar pattern in respect of progression rates to Russell Group universities, but it should also be instructive to compare performance on these two selective measures, even though cohorts are now small enough for the impact of rounding to be felt.


Table 4: National numbers progressing to all UK HE institutions and Russell Group Universities in 2011/12

State-funded schools State-funded colleges Total
FSM Non-FSM Total FSM Non-FSM Total FSM Non-FSM Total
No of students 11,100 153,480 164,580 17,680 153,230 170,910 28,770 306,720 335,490
UK HEI destination 6,250 95,880 102,130 7,290 67,130 74,420 13,540 163,010 176,550
Top third destination 1,300 35,410 36,710 920 15,000 15,920 2,210 50,410 52,620
Russell Group destination 740 24,180 24,920 510 9,790 10,300 1,240 33,970 35,220


Table 4 reveals that:

  • The overall national progression rate for KS5 students to Russell Group universities is 10.5%, compared with 15.7% for the top third. There is again a marked difference between the non-FSM rate (11.1%, compared with 16.4% for the top third) and the FSM rate (4.3%, compared with 7.7% for the top third). Whereas one in every nine non-FSM students progress to a Russell Group university, the corresponding odds for FSM are closer to one in 23. The ratio between FSM and non-FSM progression rates is larger at this higher level of selectivity.
  • The progression rate for all school-based students to Russell Group universities is 15.1% (compared with 22.3% for the top third), whereas the progression rate from colleges is much lower, at 6% (compared with 9.3% for the top third).
  • On the schools side, the FSM-eligible progression rate stands at 6.7% (against 11.7% for the top third), while in colleges it is as low as 2.9% (compared with 5.2% for the top third). The non-FSM rates are 15.8% for schools and 6.4% for colleges, so a higher proportion of FSM-eligible students from schools are successful than non-FSM students from colleges.
  • Almost 20% of all students who progress to a UK higher education institution go to a Russell Group university (compared with 30% going to a top third institution) but, for FSM-eligible learners, this falls to 9.2% (compared with 16.3% going to the top third). Whereas the FSM success rate for the top third was slightly more than half the non-FSM success rate, it is slightly less than half the non-FSM rate for Russell Group progression. The comparable percentages for schools and colleges are 11.8% and 7% respectively.
  • Overall, 66.9% of students reaching a ‘top third’ university are attending a Russell Group institution. But this overall ‘top third/RSG conversion rate’ for FSM-eligible students is only 56.1%, almost eleven percentage points lower than the rate for all students. (There is only a small difference between schools and colleges in this respect.) Hence the chances of FSM-eligible students attending Russell Group institutions within the ‘top third’ are significantly lower than those of their more advantaged peers.
  • It is also instructive to compare the different size of these cohorts. The overall non-FSM cohort progressing to Russell Group universities is 27 times the size of the FSM cohort doing so. Put another way, the overall FSM cohort is just 3.5% of the total population progressing to Russell Group institutions. (Interestingly, this falls to 3% for those attending schools whereas the comparable percentage for those attending colleges is higher at 5%.) The total number of FSM-eligible students going on to all Russell Group institutions is about half the number of non-FSM students progressing to Oxbridge alone.

Chart 5, immediately below, provides a region-by-region comparison of FSM-eligible and non-FSM progression rates to Russell Group universities.


Chart 5: Percentage of KS5 cohort – fsm and non-fsm – progressing to Russell Group universities by region, 2011/12

Destinations chart 5


This shows that:

  • Outer London is leading the way in terms of progression by FSM-eligible and non-FSM students alike. On the non-FSM side it is comfortably ahead of the North West, followed by the rest of the pack. Inner London brings up the rear, a full five percentage points behind the outer boroughs.
  • When it comes to FSM-eligible students there is little to choose between the regions, since they are all clustered between 3% and 6%. But it is much harder to establish real distinctions when percentages are so low. Inner London seems to be in the middle of the pack for FSM progression, suggesting it is performing respectably but not outstandingly on this measure.
  • The numbers – see Table 5 below – indicate that outer London contributes one in five of the FSM cohort progressing to Russell Group institutions, while Inner and Outer London together account for more than a third. (This is an important fact to bear in mind when contemplating the case for a separate London-wide strategy to improve FSM progression rates.) Numbers contributed by the North East, East Midlands and South West regions are markedly low by comparison.


Table 5: Percentage of FSM-eligible students progressing to Russell Group universities from each region 2011/12

NE NW YH EM WM EE IL OL SE SW Eng
Numbers progressing to RG universities 50 240 110 50 160 60 190 260 80 50 1240
%age of total 4% 19% 9% 4% 13% 5% 15% 21% 6% 4% 100%


Oxbridge

Table 6 below shows national progression rates to Oxbridge by sector, differentiating FSM-eligible and non-FSM. It reveals that:

  • The overall progression rate for all students to Oxbridge is 0.72%, so roughly one in every 140 KS5 students goes to Oxbridge. If we focus only on those progressing to UK higher education, this rate halves to around one in every 70. Of those progressing to Russell Group universities, 6.9% are headed to Oxbridge, equivalent to almost one in every 15.
  • But, when it comes to FSM students, theses rates are much, much lower. Of those progressing to Russell Group institutions, only one in 25 are destined for Oxbridge. Roughly one in every 270 FSM students progressing to UK higher education will attend these two universities.


Table 6: National numbers progressing to all UK HE institutions, top third, Russell Group and Oxbridge 2011/12

State-funded schools State-funded colleges Total
FSM Non-FSM Total FSM Non-FSM Total FSM Non-FSM Total
No of students 11,100 153,480 164,580 17,680 153,230 170,910 28,770 306,720 335,490
UK HEI destination 6,250 95,880 102,130 7,290 67,130 74,420 13,540 163,010 176,550
Top third destination 1,300 35,410 36,710 920 15,000 15,920 2,210 50,410 52,620
Russell Group destination 740 24,180 24,920 510 9,790 10,300 1,240 33,970 35,220
Oxbridge destination 40 1,850 1,890 10 520 530 50 2,370 2,420


  • If Oxbridge were to accept the same proportion of FSM students that attend Russell Group universities, they would together take in some 85 students rather than the 50 recorded here.

But, for all we know they are doing so, since we are at the very limits of the usefulness of these statistics.

The totals in the data above are rounded to the nearest 10, so the number of FSM students progressing to Oxbridge could be as low as 40 (35 from schools + 5 from colleges) or as high as 58 (44 from schools + 14 from colleges).

This degree of possible variance rather calls into question the wisdom of using this data to support a national impact indicator.

It also reinforces the case for Oxford and Cambridge to publish accurate annual data on the actual numbers of formerly FSM-eligible students they admit, ensuring that they define that term in exactly the same manner as these destination measures.

A figure at the lower end of this distribution would be broadly consistent with other data and suggest continuing long-term failure to shift this figure upwards.

BIS has provided figures over the years in answer to various Parliamentary Questions. These are derived by matching the NPD, HESA Student Record and Individual Learners Record (ILR). They are rounded to the nearest five, rather than the nearest ten, and together supply annual outcomes from 2005/06 to 2010/11.


Table 7: FSM-eligible progression to Oxbridge 2005-2011 sourced  from BIS replies to PQs

2005/06 2006/07 2007/08 2008/09 2009/10 2010/11
Oxford 25 20 20 25 15 15
Cambridge 20 25 20 20 25 25
TOTAL 45 45 40 45 40 40


My educated guess is that this number remained at or below 45 in 2011/12 and is unlikely to rise significantly for the foreseeable future.

But we should not be satisfied even if it doubles between 2010/11 and 2015/16, reaching 80-90 over that five year period. The desperately low base should not be used to justify such poverty of ambition.

I note in passing that the approach to rounding in the regional destination data is markedly unhelpful. Remember that all figures in the data are rounded to the nearest 10 and x indicates a number between 1 and 5. Table 8 shows the possible impact on figures for FSM progression to Oxbridge by region.


Table 7: Potential variance in numbers of FSM-eligible students progressing to Oxbridge by region 2001/12

Region Given Min Max Mean
NE X 1 5 3
NW 10 6 14 10
YH X 1 5 3
EM X 1 5 3
WM 10 6 14 10
EE 10 6 14 10
IL 10 6 14 10
OL 10 6 14 10
SE X 1 5 3
SW X 1 5 3
Eng 50 35 95 65


The obvious point is that the given total of 50 students could stand proxy for any figure between 35 and 95 (though one assumes that the real total must lie between 40 and 58, as indicated by the national figures in Table 6).


Putting it all Together

What are the headlines from the preceding analysis, as far as the progression of FSM-eligible students is concerned?

  • The destinations data generates a national population of almost 29,000 FSM-eligible students who constitute 8.6% of the total cohort. Over 60% of these are located in colleges, the remainder in schools. These national figures mask substantial regional variations: the FSM-eligible population ranges from 4.3% of the total (South East) to 30.3% (Inner London). The size of these regional FSM cohorts is also extremely variable. Inner and Outer London combined account for over 30% of the national FSM-eligible population.
  • At national level, some 64% of FSM-eligible KS5 learners progress to a sustained educational destination (as opposed to no sustained destination or else employment/training) but this rate is 72% amongst those who attended schools compared with 59% amongst those who attended colleges.
  • Over half (53%) of all KS5 students progress to a UK higher education institution, but the progression rate for FSM-eligible students is six percentage points lower at 47%.
  • About one in six of all KS5 students progress to a ‘top third’ institution, but only about one in 13 FSM-eligible students do so. About one in ten of all KS5 students attend Russell Group institutions, but this falls to one in 23 for FSM-eligible students.
  • There are significant differences between progression rates from schools and colleges respectively. From schools, the FSM-eligible progression rate to all UK higher education is 56%, to top third institutions it is 11.7% and to Russell Group Institutions it is 6.7%. The comparable percentages for colleges are consistently lower at 41%, 5.2% and 2.9% respectively. Whereas the number progressing to UK higher education is higher in colleges, the majority of those progressing to top third institutions are from schools. Almost 60% of those progressing to Russell Group universities are located in schools.
  • In regional terms, the FSM progression rate to all UK higher education ranges from 33.6% in the South West to 63.1% in Inner London, a huge 30 percentage point variation. Outer London is only one point behind at 61.9%. Exceptionally, the FSM progression rate in Inner London exceeds the non-FSM progression rate. Elsewhere, the non-FSM rate exceeds the FSM rate by between nine and 17 percentage points.
  • FSM progression rates to top third institutions are much lower, ranging from 4.4% (North East) to 12.4% (Outer London), which outscores Inner London at 10.6%. Both are well ahead of the national average at 7.7%. The non-FSM progression rates significantly exceed the FSM-eligible rates in every region. The gap is smallest in Inner London at 6.6 percentage points.
  • The gaps in London between FSM-eligible progression rates to all UK HE and the top third institutions reach 50 percentage points, significantly higher than the 39 percentage point national average. The smallest gap is 27 percentage points in the South East. Although London is leading the way on both these measures, its conspicuous success on the less demanding measure throws into sharper relief the limited progress made against the other.
  • A similar pattern is revealed when it comes to Russell Group universities, though the differences are more severe. The FSM progression rate ranges from 2.9% in Eastern England to 5.9% in Outer London, with Inner London only very slightly above the national average at 4.5%. Inner London also falls behind the North West on this measure. There are again significant differences between the rates for FSM and non-FSM. This gap is smallest in Inner London at 4.8 percentage points.
  • Chart 6, below, compares FSM and non-FSM progression rates by region to all UK higher education, the top third and Russell Group institutions respectively. The data is shown rounded to a single decimal place. This shows that the gaps between Russell Group and top third progression rates for FSM students are far bigger in London than anywhere else – 6.1 percentage points in Inner London and 6.5 percentage points in Outer London compared with a national average of 3.4 percentage points. FSM progression to Russell Group universities seems to be the point at which the celebrated London effect has stalled.


Chart 6: FSM and non-FSM progression by region to all UK HE, ‘top third’ and Russell Group institutions 2011/12

Destinations chart 6


  • As far as FSM progression to Oxbridge is concerned, the data is too limited and approximate to tell us anything substantial, other than to confirm that national FSM progression rates are scandalously low. There might have been a slight improvement – we can’t tell for certain – but from a horrifically low base. Five regions sent a maximum of 5 FSM-eligible learners to Oxbridge in 2012 while the other five each managed between 6 and 14.


What limits FSM progression to selective higher education?

Selective universities frequently argue that the main obstacle preventing the admission of more disadvantaged students is that far too few of them achieve the highest attainment levels necessary to secure admission.

Much is made in particular of the comparatively low number of FSM eligible students achieving AAA+ grades at A level – though a PQ reply confirmed (Col 35W) that 546 students achieved this in 2011 and, as we have seen, the data above shows 1,240 FSM students progressing to Russell Group universities in 2012, so well over 50% had lower grades than this. Some courses require slightly lower grades and contexualised admissions practice is almost certainly more widespread than many are prepared to admit.

Unfortunately though, there is very little published data defining excellence gaps – the difference in performance at high attainment levels between advantaged and disadvantaged students – so it is much more difficult than it should be to find hard evidence of this relationship and how it varies by region.

There seems to be broad consensus in the research literature that, although attainment is not the only contributory factor, it is the most significant cause of under-representation, not least because the effect is much more limited when controls for high attainment are introduced.

But it also recognised that a variety of other factors are in play, including:

  • Personal, peer and community aspirations
  • Motivation and resilience
  • Acquisition of social and cultural capital
  • Subject choice (often discussed in terms of ‘facilitating subjects’)
  • Access to and quality of information, advice and guidance
  • Aversion to student debt
  • Whether educators demonstrate consistently high expectations and are favourably disposed towards the most selective universities.

Of course it is overly simplistic to regard such factors as distinct from high attainment, since several of them contribute indirectly towards it.

It is also important to bear in mind that the most demanding and highest tariff courses in particular disciplines are not necessarily located at the most prestigious universities, so – even allowing for screening effects – schools and colleges may be acting in many students’ best interests by pointing them in other directions.

And it is open to question whether disadvantaged students should be persuaded to attend higher education institutions that do not suit them personally, even if the future flow of economic benefits suggests this is the most rational decision. There is a trade-off between present happiness and future income and potential students – as adults – should arguably be able to exercise some freedom of choice. There is also the risk of drop-out to consider.

These factors will impact on different students with different intensities in different combinations and in very different ways: there can be no ‘one size fits all’ solution.

All this aside, it seems that – for the disadvantaged student cohort as a whole – the cumulative impact of such factors is much less significant than the impact of attainment.

So it would be a reasonable hypothesis that regions whose FSM (and non-FSM) students are under-represented at Russell Group universities demonstrate relatively lower levels of high attainment at GCSE and A level.

Could this help to explain why Inner London, so successful in terms of progression to UK higher education institutions, is far less so where Russell Group universities are concerned? The remainder of this section struggles to test this hypothesis with the very limited data available.

Taking A level first, Chart 7, below, compares top grade A level performance in 2013, the most recent year for which this data is available, while Chart 8 compares achievement of AAB A level grades or higher in 2011 and 2012 with FSM-eligible and non-FSM progression rates in 2012 drawn from the destinations data. (Note that the 2011 data does not supply separate AAB+ outcomes for Inner and Outer London).


Chart 7: Top A level performance by region 2012/13

Destinations chart 7

Chart 8: Regional achievement of AAB+ grades at A level in 2011 and 2012 compared with 2012 FSM and non-FSM progression rates to RG universities

Destinations chart 8


Chart 7 shows that Inner London returns the lowest rates of top-grade A level attainment, while Outer London is at the top of the range. This suggests that top grade A level attainment is depressed in Inner London, which might well be attributable to the exceptionally high incidence of relatively lower attaining FSM-eligible students.

Chart 8 again shows Outer London performing strongly – on both top grade A level attainment and Russell Group progression, while Inner London is lagging behind.

A straightforward bilateral comparison between Inner and Outer London suggests a clear correlation between these two variables, although correlation does not amount to causation.

Moreover, the picture becomes somewhat more complex when other regions are factored in. Outer London has similar top grade A level attainment to the South East, but performs significantly better on Russell Group progression, even with a significantly higher proportion of FSM students.

Meanwhile Inner London, clearly the laggard in terms of top grade A level performance, is also the backmarker for non-FSM Russell Group progression. However, it still seems to perform comparatively well in terms of FSM progression, especially when compared with the South East.

This could be explainable by the fact that relatively more FSM students in Inner London achieve the highest grades, or perhaps they are disproportionately the beneficiaries of contexualised admissions practice. Other factors could also be in play, not least the geographical proximity of several Russell Group institutions.

There is some evidence – published by the Social Mobility and Child Poverty Commission (SMCPC) and recently taken up in CfBT’s research on the ‘London effect’ – that disadvantaged students across London as a whole are relatively strong performers in higher grade GCSEs.

The SMCPC’s 2013 State of the Nation report (page 191) drew attention to overall London success on an 8+ A*-B GCSE including English and Maths (and excluding equivalents) measure – albeit distinguishing between those attracting Pupil Premium funding and their peers.


destinations capture 1


This table was converted into a chart in a recent CfBT research report on London.


destinations capture 2


Unfortunately, we cannot see the data for Inner and Outer London separately, so the ‘London effect’ may be disproportionately attributable to the Outer boroughs.

So where does this leave us?

The balance of probabilities suggests that the incidence of high attainment at GCSE and post-16 will impact strongly on progression to selective higher education and so provide the root cause for regional differences in progression rates.

Regions wishing to improve their performance need to look first at increasing high attainment, taking full account of disparities between the performance of FSM and non-FSM students.

There is some evidence to suggest that the celebrated ‘London effect’ has not translated into achievement of the highest attainment levels at A level in Inner London, especially compared with Outer London. This is impacting negatively on progression rates for FSM students but, ironically, progression rates for non-FSM students seem to be taking a bigger hit, perhaps because they do not benefit so significantly from contexualised admissions.

Any London-wide regional strategy to improve progression to the most selective universities would need to focus strongly on closing the gaps between FSM and non-FSM progression rates in Inner and Outer London respectively.


The policy response to poor FSM progression

The current policy response is multi-faceted but focused primarily on system-wide improvement, rather than organising and targeting support directly at the students most likely to benefit.

This is partly a function of a market-driven political philosophy, fundamental aversion to centrally organised programmes and commitment to a distributed model in which institutions enjoy substantial autonomy, subject to a strong accountability regime which focuses primarily (but not exclusively) on outcomes, including via the introduction of the destination measures discussed in this post.

By strengthening the system as a whole, it is anticipated that standards will rise across the board. A more rigorous national curriculum and more demanding qualifications will raise performance thresholds, ensuring that all learners are better prepared for progression, regardless of their destination. Some examinations are being revised to remove ceilings on the performance of the highest attainers.

Reporting of performance is adjusted to ensure that schools focus on improving attainment and progress of all learners, regardless of their starting point. Inspection includes checks that high attainers are not underachieving.

A series of interventions has been introduced to strengthen attainment and progression in maths and across other STEM subjects.

There have been efforts to strengthen the role of the Office for Fair Access (OFFA) and to introduce a co-ordinated ‘National Strategy for Access and Student Success’ involving collaboration between OFFA and HEFCE. Meanwhile HE student number controls have been relaxed enabling institutions to expand their intakes of suitably qualified students.

Some degree of localised intervention is taking place through the free schools programme as a first tranche of selective 16-19 institutions has been established, often with an explicit mission to increase the flow of disadvantaged students to selective higher education.

Financial support has been targeted towards disadvantaged learners through the Pupil Premium, ensuring that schools receive extra funding for each disadvantaged learner they admit up to and including Year 11. Academies – including many selective schools – are permitted to prioritise admission of these learners when oversubscribed.

There are issues with aspects of this agenda, for example:

  • The introduction of universal end of KS2 tests may reduce their capacity to differentiate the performance of the highest attainers, so recently enhanced through the adoption of Level 6 tests. There is an associated risk that schools’ internal assessment systems will impose artificially low ceilings restricting high attainers’ progress.
  • Ofsted’s welcome focus on the most able in schools gives insufficient emphasis to those attracting the Pupil Premium and is not backed up by explicit guidance. Nor does it apply to the separate inspection of post-16 settings, undertaken under a different inspection framework.
  • OFFA and HEFCE cannot readily alter the behaviour of independent higher education institutions that make too little progress with fair access, or which improve too slowly. There are too few carrots and sticks and widespread resistance to the imposition of robust targets, even though the SMCPC has called for this repeatedly. Efforts at strengthening institutional collaboration are equally constrained.
  • As yet there are too few selective 16-19 institutions to make a real difference. They are too little focused on supporting improvements in neighbouring institutions and, even within their own intakes, do not always give sufficient priority to the most disadvantaged students.
  • The Pupil Premium stops at age 16 and schools are largely free to use it as they wish – there is no guarantee that each learner attracting the Premium will benefit commensurately and some risk that high attainers are amongst the most vulnerable in this respect.
  • One wonders whether the destination indicators, when introduced into the accountability regime in 2016, will be influential enough to change institutional behaviour. The simultaneous deployment of several different measures of selectivity may dilute their impact. On the other hand, a single measure would be too blunt an instrument.

But these are second order issues. Overall, the current education reform programme can be expected to bring about some improvement in FSM progression rates to selective higher education.

However:

  • It will take a comparatively long time.
  • There is significant deadweight.
  • Fault lines between higher education and schools policy remain problematic.
  • Nothing is holding these disparate policy elements together, so ensuring that ‘the whole is greater than the sum of the parts’.


Solving the Policy Design Problem

Given the context of wider government policy, what additional policy dimension should be introduced to secure significant improvements in progression rates for disadvantaged learners to selective higher education?

The missing component – which might be introduced nationally or piloted at regional level and subsequently rolled out – is a light touch framework that will supply the essential minimum scaffolding necessary to support effective market operation on the demand and supply sides simultaneously.

This is by no means equivalent to a rigid, centralised top-down programme, but it does recognise that, left to its own devices, the free market will not create the conditions necessary for success. Some limited intervention is essential.

The centrepiece of the framework would be a structured typology or curriculum comprising the full range of knowledge, skills and understanding required by disadvantaged students to equip them for progression to selective higher education

  • On the demand side this would enable educational settings to adopt a consistent approach to needs identification across the 11-19 age range. Provision from 11-14 might be open to any disadvantaged learner wishing it to access it, but provision from 14 onwards would depend on continued success against challenging attainment targets.
  • On the supply side this would enable the full range of providers – including students’ own educational settings – to adopt a consistent approach to defining which knowledge, skills and understanding their various programmes and services are designed to impart. They would be able to qualify their definitions according to the age, characteristics, selectivity of intended destination and/or geographical location of the students they serve.

With advice from their educational settings, students would periodically identify their learning needs, reviewing the progress they had made towards personal targets and adjusting their priorities accordingly. They would select the programmes and services best matched to their needs.

The supply side would use market intelligence to adjust the range of programmes and services to meet need from different constituencies and localities, acting swiftly to fill gaps in the market and eradicate over-supply.  Programmes and services attracting insufficient demand would close down, while popular programmes and services would expand to meet demand. Small providers with many competitors would discuss the benefits of collaboration to achieve economies of scale, so bringing down costs and increasing demand.

Each learner within the programme would have a personal budget dedicated to purchasing programmes and services with a cost attached. This would be fed from several sources including:

  • Their annual Pupil Premium allocation (currently £935 per year) up to Year 11.
  • A national fund fed by selective higher education institutions. This would collect a fixed minimum topslice from each institution’s outreach budget, supplemented by an annual levy on those failing to meet demanding new fair access targets. (Institutions would also be incentivised to offer programmes and services with no cost attached.)
  • Philanthropic support, bursaries, scholarships, sponsorships and in-kind support sourced from business, charities, higher education, independent schools and parents. Economic conditions permitting, the Government might offer to match any income generated from these sources.

This would be a more than adequate replacement for Aim Higher funding, the loss of which is still felt keenly according to this recent DfE research report.

A solution of this kind would be largely self-regulating, requiring only minimal co-ordination and a small administrative budget. It would have several conspicuous advantages in terms of securing much greater coherence and consistency:

  • Across the age range, securing continuity and progression for all participating learners throughout secondary education up to the point of entry into higher education.
  • Between educational settings, especially at the key transition point between secondary and tertiary education at age 16, when half or more students might be expected to move to a different setting.
  • Regardless of geographical location, so that students are less disadvantaged by virtue of where they live, able to draw on high quality blended and online provision in locations where face-to-face provision is unviable.
  • Incorporating the contribution of national, regional and local centres of excellence – including for example new selective 16-19 institutions such as the London Academy for Excellence and the Harris Westminster Sixth Form – providing them with a platform to share and spread excellent practice and supply outreach of their own.
  • Providing a nexus for cross-sectoral partnership and collaboration, including collaborative efforts in the higher education sector recently launched by OFFA and HEFCE.
  • Supplying a context in which selective higher education institutions can be more transparent about their contextual admission offers and other fair access policies, enabling students to make proper comparisons when selecting their preferred institutions.
  • Accommodating and complementing the reform package I have already proposed to improve fair access to Oxbridge.

The first of these dimensions is particularly important given recent research, published by the Social Mobility and Child Poverty Commission which finds that:

‘Of 7,853 children from the most deprived homes who achieve level 5 in English and maths at age 11 (8.5%…), only 906 (11.5%) make it to an elite university. If they had the same trajectory as a child from one of the least deprived families, then 3,066 of these children would be likely to go to an elite university (39.0%) – suggesting that 2,160 children are falling behind.’

The report concludes:

‘Poorer students have lower average achievement at each stage of their education and even those who start strongly with higher achievement at Key Stages 1 and 2 are more likely to fall off their high achievement trajectory than their wealthier peers. The achievement of students from poorer backgrounds is particularly likely to fall away between Key Stage 2 and Key Stage 4, making secondary school a potentially important area of intervention for policymakers interested in increasing participation at high-status universities amongst young people from more deprived backgrounds.’

Such an approach would be relatively inexpensive and fully scalable (I have not properly costed it, but a £50m topslice from the annual £2.5bn national Pupil Premium budget – for which there is precedent – would be more than enough to meet the full burden on the taxpayer.)

A regional pilot – perhaps in London, or perhaps elsewhere – would accommodate an EEF-funded randomised control trial, though this would need to be extended if incorporating a cohort undertaking the full cycle from Year 7 upwards.

The full benefits would not be realised until this first seven year cycle was completed, but one would anticipate significant positive impacts on attainment much sooner than that and, if students were allowed to participate from Year 10, or possibly even later, the impact on progression to selective universities would be felt within the lifetime of the next government.


Conclusion

There are strong equity and social mobility arguments for improving significantly the attainment of disadvantaged students and increasing their rates of progression to selective universities. This is also a sound investment in human capital, improving our national standing in the ‘global race’.

These progression rates have been stalled for a generation. Recent attempts to claim ‘green shoots of recovery’ relate only to the least selective top third measure. Even if they are realised, they are unlikely to wash through to Russell Group and Oxbridge admissions where the under-representation of FSM students is marked and, some would argue, a national scandal.

The publication of Destination Measures provides a valuable addition to our evidence base, though we know far too little about excellence gaps – between the performance of advantaged and disadvantaged learners on high attainment measures – so cannot readily explore the impact of these on progression rates.

Current education policy will likely bring about improvements, but only very slowly. Progression rates to the most selective institutions will be the hardest and slowest to shift. There are ongoing risks associated with cross-policy coherence and the fault lines between education policy for schools and higher education respectively (with the post-16 sector caught somewhere in between).

An additional policy strand is needed to secure vertical, horizontal and lateral coherence and deliver a whole greater than the sum of its parts. Potential design principles for this strand are set out above.  Substantial benefits would be realised during the lifetime of the next government.

Perfect Manifesto material!


GP

July 2014


A Summer of Love for English Gifted Education? Episode 3: Improving Fair Access to Oxbridge

.

This post is a critical examination of policy and progress on improving progression for the highest attainers from disadvantaged backgrounds to selective universities, especially Oxford and Cambridge.

.

.

It:

  • Uncovers evidence of shaky statistical interpretation by these universities and their representative body;
  • Identifies problems with the current light-touch regulatory and monitoring apparatus, including shortcomings in the publication of data and reporting of progress at national level;
  • Proposes a series of additional steps to address this long-standing shortcoming of our education system.

.

Background

summer of love 1967 by 0 fairy 0

summer of love 1967 by 0 fairy 0

Regular readers may recall that I have completed two parts of a trilogy of posts carrying the optimistic strapline ‘A Summer of Love for Gifted Education’.

The idea was to structure these posts around three key government publications.

  • This final part was supposed to analyse another DfE-commissioned research report, an ‘Investigation of school- and college- level strategies to raise the Aspirations of High-Achieving Disadvantaged Pupils to pursue higher education’.

We know from the published contract (see attachment in ‘Documents’ section) that this latter study was undertaken by TNS/BMRB and the Institute for Policy Studies in Education (IPSE) based at London Metropolitan University. The final signed off report should have been produced by 28 June 2013 and published within 12 weeks of approval, so by the end of September. As I write, it has still to appear, which would suggest that there is a problem with the quality and/or size of the evidence base.

In the five months since the appearance of Part Two I have published a series of posts developing the themes explored in the first two-thirds of my incomplete trilogy.

But what to do about the missing final episode of ‘A Summer of Love’, which was going to develop this latter fair access theme in more detail?

My initial idea was to survey and synthesise the large number of other recently published studies on the topic. But, as I reviewed the content of these publications, it struck me that such a post would be stuffed full of descriptive detail but lack any real bite – by which I mean substantial and serious engagement with the central problem.

I decided to cut to the chase.

I also decided to foreground material about the highest reaches of A level attainment and progression to Oxbridge, not because I see the issue solely in these stratospheric terms, but because:

  • The top end of fair access is important in its own right, especially for those with a gifted education perspective. Oxford and Cambridge consistently declare themselves a special case and I wanted to explore the substance of their position.
  • There is compelling evidence that Oxford and Cambridge are amongst the weakest performers when it comes to fair access for the highest attaining disadvantaged learners. There are reasons why the task may be comparatively more difficult for them but, equally, as our most prestigious universities, they should be at the forefront when it comes to developing and implementing effective strategies to tackle the problem.
  • The Government has itself made Oxbridge performance a litmus test of progress (or lack of progress) on fair access and on higher education’s wider contribution to social mobility.

The first part of the post briefly reviews the range of measures and regulatory apparatus devoted to improving fair access. This is to provide a frame from which to explore the available data and its shortcomings, rather than an in-depth analysis of relative strengths and weaknesses. Readers who are familiar with this background may prefer to skip it.

The mid-section concentrates on the limited data in the public domain and how it has been (mis)interpreted.

The final section reviews the criticisms made by the SMCPC and, while endorsing them thoroughly, offers a set of further proposals – many of them data-driven – for ratcheting up our collective national efforts to reverse the unsatisfactory progress made to date.

.

A Troubling Tale of Unnecessary Complexity and Weak Regulation

.

A Proliferation of Measures

There is little doubt that we have a problem in England when it comes to progression to selective, competitive higher education (however defined) by learners from disadvantaged backgrounds (however defined).

We may not be unique in that respect, but that does not alter the fact that the problem is longstanding and largely unresolved.

The recent ‘State of the Nation 2013’ Report from the SMPCPC says ‘there has been little change in the social profile of the most elite institutions for over a decade’, adding that ‘while some of the building blocks are in place to lift children off the bottom, opening up elites remains elusive.’

Part of the problem is that the debates about these respective definitions continue to receive disproportionate coverage. Such debates are sometimes deployed as a diversionary tactic, intentionally drawing us away from the unpalatable evidence that we are making decidedly poor headway in tackling the core issue.

The definitional complexities are such that they lend themselves to exploitation by those with a vested interest in preserving the status quo and defending themselves against what they regard as unwonted state intervention.

I shall resist the temptation to explore the comparative advantages and disadvantages of different measures, since that would risk falling into the trap I have just identified.

But I do need to introduce some of the more prominent – and pin down some subtle distinctions – if only for the benefit of readers in other countries.

One typically encounters four different categorisations of competitive, selective higher education here in the UK:

  • Oxbridge – a convenient shorthand reference to Oxford and Cambridge Universities. These two institutions are commonly understood to be qualitatively superior to other UK universities and, although that advantage does not apply universally, to every undergraduate course and subject, there is some academic support for treating them as a category in their own right.
  • Russell Group – The Russell Group was formed in 1994 and originally comprised 17 members. There are currently 24 members, 20 of them located in England, including Oxford and Cambridge. Four institutions – Durham, Exeter, Queen Mary’s and York – joined as recently as 2012 and membership is likely to increase as the parallel 1994 Group has just disbanded. DfE (as opposed to BIS) often uses Russell Group membership as its preferred proxy for selective, competitive higher education, although there are no objective criteria that apply exclusively to all members.
  • Sutton Trust 30The Sutton Trust originally identified a list of 13 universities, derived from ‘average newspaper league table rankings’. This list – Birmingham, Bristol, Cambridge, Durham, Edinburgh, Imperial, LSE, Nottingham, Oxford, St Andrews, UCL, Warwick and York – still appears occasionally in research commissioned by the Trust, although it was subsequently expanded to 30 institutions. In ‘Degrees of Success’, a July 2011 publication, they were described thus:

‘The Sutton Trust 30 grouping of highly selective universities comprises universities in Scotland, England and Wales with over 500 undergraduate entrants each year, where it was estimated that less than 10 per cent of places are attainable to pupils with 200 UCAS tariff points (equivalent to two D grades and a C grade at A-level) or less. These 30 universities also emerge as the 30 most selective according to the latest Times University Guide.’

The full list includes all but two of the Russell Group (Queen Mary’s and Queen’s Belfast) plus eight additional institutions.

‘The HEIs included in this group change every year; although 94% of HEIs remained in the top third for 5 consecutive years, from 2006/07 to 2010/11. The calculation is restricted to the top three A level attainment; pupils who study other qualifications at Key Stage 5 will be excluded. Institutions with a considerable proportion of entrants who studied a combination of A levels and other qualifications may appear to have low scores. As the analysis covers students from schools and colleges in England, some institutions in other UK countries have scores based on small numbers of students. As this measure uses matched data, all figures should be treated as estimates.’

This categorisation includes seven further mainstream universities (Aston, City, Dundee, East Anglia, Goldsmiths, Loughborough, Sussex) plus a range of specialist institutions.

Indicators of educational disadvantage are legion, but these are amongst the most frequently encountered:

  • Eligibility for free school meals (FSM): DfE’s preferred measure. The term is misleading since the measure only includes learners who meet the FSM eligibility criteria and for whom a claim is made, so eligibility of itself is insufficient. Free school meals are available for learners in state-funded secondary schools, including those in sixth forms. From September 2014, eligibility will be extended to all in Years R, 1 and 2 and to disadvantaged learners in further education and sixth form colleges. The phased introduction of Universal Credit will also impact on the eligibility criteria (children of families receiving Universal Credit between April 2013 and March 2014 are eligible for FSM, but the cost of extending FSM to all Universal Credit recipients once fully rolled out is likely to be prohibitive). We do not yet know whether these reforms will cause DfE to select an alternative preferred measure and, if so, what that will be. Eligibility for the Pupil Premium is one option, more liberal than FSM, though this currently applies only to age 16.
  • Residual Household Income below £16,000: This is broadly the income at which eligibility for free school meals becomes available. It is used by selective universities (Oxford included) because it can be applied universally, regardless of educational setting and whether or not free school meals have been claimed. Oxford explains that:

‘Residual income is based on gross household income (before tax and National Insurance) minus certain allowable deductions. These can include pension payments, which are eligible for certain specified tax relief, and allowances for other dependent children.’

The threshold is determined through the assessment conducted by Student Finance England, so is fully consistent with its guidance.

  • Low participation schools: This measure focuses on participation by school attended rather than where students live. It may be generic – perhaps derived from the Government’s experimental destinations statistics – or based on admissions records for a particular institution. As far as I can establish, there is no standard or recommended methodology: institutions decide for themselves the criteria they wish to apply.
  • POLAR (Participation Of Local Areas): HEFCE’s area-based classification of participation in higher education. Wards are categorised in five quintiles, with Quintile 1 denoting those with lowest participation. The current edition is POLAR 3.
  • Other geodemographic classifications: these include commercially developed systems such as ACORN and MOSAIC based on postcodes and Output Area Classification (OAC) based on census data. One might also include under this heading the Indices of Multiple Deprivation (IMD) and the associated sub-domain Income Deprivation Affecting Children Index (IDACI).
  • National Statistics Socio-Economic Classification (NS-SEC): an occupationally-based definition of socio-economic status applied via individuals to their households. There are typically eight classes:
  1. Higher managerial, administrative and professional
  2. Lower managerial, administrative and professional
  3. Intermediate
  4. Small employers and own account workers
  5. Lower supervisory and technical
  6. Semi routine
  7. Routine
  8. Never worked and long term unemployed

Data is often reported for NS-SEC 4-7.

Sitting alongside these measures of disadvantage is a slightly different animal – recruitment from state-funded schools and colleges compared with recruitment from the independent sector.

While this may be a useful social mobility indicator, it is a poor proxy for fair access.

Many learners attending independent schools are from comparatively disadvantaged backgrounds, and of course substantively more learners at state-maintained schools are comparatively advantaged.

The Office For Fair Access (OFFA) confirms that:

‘in most circumstances we would not approve an access agreement allowing an institution to measure the diversity of its student body solely on the basis of the numbers of state school pupils it recruits….it is conceivable that a university could improve its proportion of state school students without recruiting greater proportions of students from disadvantaged groups.’

Nevertheless, independent/state balance continues to features prominently in some access agreements drawn up by selective universities and approved by OFFA.

There is a risk that some institutions are permitted to give this indicator disproportionate attention, at the expense of their wider commitment to fair access.

 .

Securing National Improvement

Given the embarrassment of riches set out above, comparing progress between institutions is well-nigh impossible, let alone assessing the cumulative impact on fair access at national level.

When it came to determining their current strategy, the government of the day must have faced a choice between:

  • Imposing a standard set of measures on all institutions, ignoring complaints that those selected were inappropriate for some settings, particularly those that were somehow atypical;
  • Allowing institutions to choose their own measures, even though that had a negative impact on the rate of improvement against the Government’s own preferred national indicators; and
  •  A half-way house which insisted on universal adoption of one or two key measures while permitting institutions to choose from a menu of additional measures, so creating a basket more or less appropriate to their circumstances.

For reasons that are not entirely clear – but presumably owe something to vigorous lobbying from higher education interests – the weaker middle option was preferred and remains in place to this day.

The standard-setting and monitoring process is currently driven by OFFA, though we expect imminently the final version of a National Strategy for Access and Student Success, developed jointly with HEFCE.

A new joint process for overseeing OFFA’s access agreements (from 2015/16) and HEFCE’s widening participation strategic statements (from 2014-2017) will be introduced in early 2014.

There were tantalising suggestions that the status quo might be adjusted through work on the wider issue of evaluation.

An early letter referred to plans to:

‘Commission feasibility study to establish if possible to develop common evaluation measures that all institutions could adopt to assess the targeting and impact of their access and student success work’.

The report would be completed by Spring 2013.

Then an Interim Report on the Strategy said the study would be commissioned in ‘early 2013 to report in May 2013’ (Annex B).

It added:

‘Informal discussions with a range of institutional representatives have indicated that many institutions would welcome a much clearer indication of the kind of evidence and indicators that we would wish to see. Therefore a key strand within the strategy development will be work undertaken with the sector to develop an evaluation framework to guide them in their efforts to evidence the impact of their activity. Within this, we intend to test the feasibility of developing some common measures for the gathering of high-level evidence that might be aggregated to provide a national picture. We will also investigate what more can be done by national bodies including ourselves to make better use of national data sets in supporting institutions as they track the impact of their interventions on individual students.’

However, HEFCE’s webpage setting out research and stakeholder engagement in support of the National Strategy still says the study is ‘to be commissioned’ and that the publication date is ‘to be confirmed’.

I can find no explanation of the reasons for this delay.

For the time being, OFFA is solely responsible for issuing guidance to institutions on the content of their access agreements, approving the Agreements and monitoring progress against them.

OFFA’s website says:

‘Universities and colleges set their own targets based on where they need to improve and what their particular institution is trying to achieve under its access agreement…These targets must be agreed by OFFA. We require universities and colleges to set themselves at least one target around broadening their entrant pool. We also encourage (but do not require) them to set themselves further targets, particularly around their work on outreach and, where appropriate, retention. Most choose to do so. We normally expect universities and colleges to have a range of targets in order to measure their progress effectively. When considering whether targets are sufficiently ambitious, we consider whether they represent a balanced view of the institution’s performance, and whether they address areas where indicators suggest that the institution has furthest to go to improve access.

From 2012-13, in line with Ministerial guidance, we are placing a greater emphasis on progress against targets. We would not, however, impose a sanction solely on the basis of a university or college not meeting its targets or milestones.’

The interim report on a National Strategy suggests that – informally at least – many universities recognise that this degree of flexibility is not helpful to their prospects of improving fair access, either individually or collectively.

But the fact that the promised work has not been undertaken might imply a counterforce pushing in precisely the opposite direction.

The expectations placed on universities are further complicated by the rather unclear status of the annual performance indicators for widening participation of under-represented groups supplied by the Higher Education Statistics Agency (HESA).

HESA’s table for young full-time first degree entrants shows progress by each HEI against benchmarks for ‘from state schools or colleges’, ‘from NS-SEC classes 4, 5, 6 and 7’ and ‘from low participation neighbourhoods (based on POLAR3 methodology)’ respectively.

HESA describes its benchmarks thus:

‘Because there are such differences between institutions, the average values for the whole of the higher education sector are not necessarily helpful when comparing HEIs. A sector average has therefore been calculated which is then adjusted for each institution to take into account some of the factors which contribute to the differences between them. The factors allowed for are subject of study, qualifications on entry and age on entry (young or mature).’

HESA’s benchmarks are clearly influential in terms of the measures adopted in many access agreements (and much of the attention given to the state versus independent sector intake may be attributable to them).

On the other hand, the indicators receive rather cavalier treatment in the most recent access agreements from Oxford and Cambridge. Oxford applies the old POLAR2 methodology in place of the latest POLAR3, while Cambridge adjusts the POLAR3 benchmarks to reflect its own research.

The most recent 2011/12 HESA results for Oxford and Cambridge are as follows:

.

Institution       State schools        NS-SEC 4-7     LPN (POLAR3)
Benchmark Performance Benchmark Performance Benchmark Performance
Oxford 71.2% 57.7% 15.9% 11.0% 4.7% 3.1%
Cambridge 71.4% 57.9% 15.9% 10.3% 4.5% 2.5%

.

That probably explains why Oxbridge would prefer an alternative approach! But the reference to further work in the Interim Strategy perhaps also suggests that few see these benchmarks as the best way forward.

.

National Targets

The Government also appears in something of a bind with its preferred measures for monitoring national progress.

When it comes to fair access (as opposed to widening participation) the Social Mobility Indicators rely exclusively on the gap between state and independent school participation at the most selective HEIs, as defined by BIS.

As noted above, this has major shortcomings as a measure of fair access, though more validity as a social mobility measure.

The relevant indicator shows that the gap held between 37% and 39% between 2006 and 2010, but this has just been updated to reflect an unfortunate increase to 40% in 2010/11.

BIS uses the same measure as a Departmental Performance Indicator for its work on higher education.  The attachment on the relevant gov.uk page is currently the wrong one – which might indicate that BIS is less than comfortable with its lack of progress against the measure.

DfE takes a different approach declaring an ‘Outcome of Education’ indicator:

‘Outcome of education:

i)             Percentage of children on free school meals progressing to Oxford or Cambridge*.

ii)            Percentage of children on free school meals progressing to a Russell Group university*.

iii)           Percentage of children on free school meals progressing to any university*.

iv)           Participation in education and work based training at age 16 to 17

*Available June 2013’

But progress against this indicator is nowhere to be found in the relevant section of the DfE website or, as far I can establish, anywhere within the DfE pages on gov.uk.

.

.

Oxbridge Access Agreement Targets for 2014/15

Perhaps the best way to link this section with the next is by showing how Oxford and Cambridge have decided to frame the targets in their access agreements for 2014/15

Oxford has OFFA’s agreement to target:

  • Schools and colleges that secure limited progression to Oxford. They use ‘historic UCAS data’ to estimate that ‘in any one year up to 1,680…will have no students who achieve AAA grades but, over a three-year period they may produce a maximum of two AAA candidates’. They also prioritise an estimated 1,175 institutions which have larger numbers achieving AAA grades ‘but where the success rate for an application to Oxford is below 10%’. In 2010, 19.4% of Oxford admissions were from these two groups and it plans to increase the proportion to 25% by 2016-17;
  • UK undergraduates from disadvantaged socio-economic backgrounds, based on ‘ACORN postcodes 4 and 5’. Some 7.6% of admissions came from these postcodes in 2010/11 and Oxford proposes to reach 9.0% by 2016/17.
  • UK undergraduates from neighbourhoods with low participation in higher education, as revealed by POLAR2. It will focus on ‘students domiciled in POLAR quintiles 1 and 2’. In 2012, 10.6% are from this group and Oxford proposes to increase this to 13.0% by 2016-17.

In addition to a target for admitting disabled students, Oxford also says it will monitor and report on the state/independent school mix, despite evidence ‘that this measure is often misleading as an indicator of social diversity’. It notes that:

‘30% of 2012 entrants in receipt of the full Oxford Bursary (students with a household income of £16,000 or less) were educated in the independent sector…The University will continue to monitor the level of students from households with incomes of £16,000 or less. It is considered that these are the most financially disadvantaged in society, and it is below this threshold that some qualify for receipt of free schools meals, and the pupil premium. The University does not consider that identifying simply those students who have been in receipt of free school meals provides a suitably robust indicator of disadvantage as they are not available in every school or college with post-16 provision, nor does every eligible student choose to receive them.

There are no national statistics currently available on the number of students whose household income is £16,000 or less and who attain the required academic threshold to make a competitive application to Oxford. In 2011-12, around one in ten of the University’s UK undergraduate intake was admitted from a household with this level of declared income.’

Meanwhile, Cambridge proposes only two relevant targets, one of them focused on the independent/state divide:

  • Increase the proportion of UK resident students admitted from UK state sector schools and colleges to between 61% and 63%. This is underpinned by the University’s research finding that ‘the proportion of students nationally educated at state schools securing examination grades in subject combinations that reflect our entrance requirements and the achievement level of students admitted to Cambridge stands at around 62%’.
  • Increase the proportion of UK resident students from low participation neighbourhoods to approximately 4% by 2016. It argues:

‘Currently HESA performance indicators and other national datasets relating to socio-economic background do not take adequate account of the entry requirements of individual institutions. Whilst they take some account of attainment, they do not do so in sufficient detail for highly selective institutions such as Cambridge where the average candidate admitted has 2.5 A* grades with specific subject entry requirements. For the present we have adjusted our HESA low participation neighbourhood benchmark in line with the results of our research in relation to state school entry and will use this as our target.’

Each of these approaches has good and bad points. Cambridge’s is more susceptible to the criticism that it is overly narrow. There is no real basis to compare the relative performance of the two institutions since there is negligible overlap between their preferred indicators. That may be more comfortable for them, but it is not in the best interests of their customers, or of those seeking to improve their performance.


Investigating the Data on High Attainment and Fair Access to Oxbridge

Those seeking statistics about high attainment amongst disadvantaged young people and their subsequent progression to Oxbridge are bound to be disappointed.

There is no real appreciation of the excellence gap in this country and this looks set to continue. The fact that gaps between advantaged and disadvantaged learners are typically wider at the top end of the attainment distribution seems to have acted as a brake on the publication of data that proves the point.

It is possible that the current round of accountability reforms will alter this state of affairs, but this has not yet been confirmed.

For the time being at least, almost all published statistics about high A level attainment amongst disadvantaged learners have come via answers to Parliamentary Questions. This material invariably measures disadvantage in terms of FSM eligibility.

Information about the admission of disadvantaged learners to Oxbridge is equally scant, but a picture of sorts can be built up from a mixture of PQ replies, university admission statistics and the DfE’s destination measures. The material supplied by the universities draws on measures other than FSM.

The following two sections set out what little we know, including the ever important statistical caveats.

.

High Attainment Data

  • In 2003, 94 students (1.9%) eligible for FSM achieved three or more A grades at A level. The figures relate to 16-18 year-olds in maintained schools only who were eligible for FSM at age 16. They do not include students in FE sector colleges (including sixth from colleges) who were previously eligible for FSM. Only students who entered at least one A level, applied A level or double award qualification are included. (Parliamentary Question, 6 April 2010, Hansard (Col 1346W))
  • In 2008, 160 students (3.5%) eligible for FSM achieved that outcome. The figures relate to 16-18 year-olds, in maintained schools only, who were eligible for FSM at age 16. They do not include students in FE sector colleges (including sixth from colleges) who were previously eligible for FSM. Only students who entered at least one A level, applied A level or double award qualification are included. (Parliamentary Question, 6 April 2010, Hansard (Col 1346W))
  • In 2008/09, 232 pupils at maintained mainstream schools eligible for FSM achieved three or more A grades at A level (including applied A level and double award), 179 of them attending comprehensive schools. The figures exclude students in FE and sixth form colleges previously eligible for FSM. (Parliamentary Question, 7 April 2010, Hansard (Col 1451W))
  • The number of Year 13 A level candidates eligible for FSM in Year 11 achieving 3 or more A grade levels (including applied A levels and double award) were: 2006 – 377; 2007 – 433; 2008 – 432; 2009 – 509. These figures include students in both the schools and FE sectors.(Parliamentary Question, 27 July 2010, Hansard (Col 1223W))

 .

To summarise, the total number of students who were FSM-eligible at age 16 and went on to achieve three or more GCE A levels at Grade A*/A – including those in maintained schools, sixth form and FE colleges – has been increasing significantly since 2006.

2006 2007 2008 2009 2010 2011
Number 377 433 432 509 ? 546

The overall increase between 2006 and 2011 is about 45%.

 .

Oxbridge Admission/Acceptance Data

  • The number of learners eligible for and claiming FSM at age 15 who progressed to Oxford or Cambridge by age 19 between 2005 and 2008 (rounded to the nearest five) were:
2005/06 2006/07 2007/08 2008/09
Oxford 25 20 20 25
Cambridge 20 25 20 20
TOTAL 45 45 40 45

Sources: Parliamentary Question, 13 December 2010, Hansard (Col 549W) and Parliamentary Question 21 February 2012, Hansard (Col 755W)

.

[Postscript (January 2014):

In January 2014, BIS answered a further PQ which provided equivalent figures for 2009/10 and 2010/11 – again rounded to the nearest five and derived from matching the National Pupil Database (NPD), HESA Student Record and the Individualised Learner Record (ILR) owned by the Skills Funding Agency.

The revised table is as follows:

  2005/06 2006/07 2007/08 2008/09 2009/10 2010/11
Oxford 25 20 20 25 15 15
Cambridge 20 25 20 20 25 25
TOTAL 45 45 40 45 40 40


Sources:

Parliamentary Question, 13 December 2010, Hansard (Col 549W)

Parliamentary Question 21 February 2012, Hansard (Col 755W)

Parliamentary Question 7 January 2014, Hansard (Col 191W)

Although the 2010/11 total is marginally more positive than the comparable figure derived from the Destination Indicators (see below) this confirms negligible change overall during the last six years for which data is available.  The slight improvement at Cambridge during the last two years of the sequence is matched by a corresponding decline at Oxford, from what is already a desperately low base.]

.

Number %age FSM Number FSM
UK HEIs 164,620 6% 10,080
Top third of HEIs 49,030 4% 2,000
Russell Group 28,620 3% 920
Oxbridge 2,290 1% 30

.

.

These are experimental statistics and all figures – including the 30 at Oxbridge – are rounded to the nearest 10. The introductory commentary explains that:

‘This statistical first release (experimental statistics) on destination measures shows the percentage of students progressing to further learning in a school, further education or sixth-form college, apprenticeship, higher education institution or moving into employment or training.’

It adds that:

‘To be included in the measure, young people have to show sustained participation in an education or employment destination in all of the first 2 terms of the year after they completed KS4 or took A level or other level 3 qualifications. The first 2 terms are defined as October to March.’

The Technical Notes published alongside the data also reveal that: It includes only learners aged 16-18 and those who have entered at least one A level or an equivalent L3 qualification;  the data collection process incorporates ‘an estimate of young people who have been accepted through the UCAS system for entry into the following academic year’ but ‘deferred acceptances are not reported as a distinct destination’; and FSM data for KS5 learners relates to those eligible for and claiming FSM in Year 11.

  • Cambridge’s 2012 intake ‘included 50+ students who had previously been in receipt of FSM’ (It is not stated whether all were eligible in Year 11, so it is most likely that this is the number of students who had received FSM at one time or another in their school careers.) This shows that Cambridge at least is collecting FSM data that it does not publish amongst its own admission statistics or use in its access agreement. (Cambridge University Statement, 26 September 2013)
  • In 2012, Cambridge had 418 applications from the most disadvantaged POLAR2 quintile (4.6% of all applicants) and, of those, 93 were accepted (3.6% of all acceptances) giving a 22.2% success rate.(Cambridge University Admission Statistics 2012 (page 23))

.

To summarise, the numbers of disadvantaged learners progressing to Oxbridge are very small; exceedingly so as far as those formerly receiving FSM are concerned.

Even allowing for methodological variations, the balance of evidence suggests that, at best, the numbers of FSM learners progressing to Oxbridge have remained broadly the same since 2005.

During that period, the concerted efforts of the system described above have had zero impact. The large sums invested in outreach and bursaries have made not one iota of difference.

This is true even though the proportion achieving the AAA A level benchmark has increased by about 45%. If Oxbridge admission was solely dependent on attainment, one would have expected a commensurate increase, to around 65 FSM entrants per year.

On the basis of the 2010/11 Destination Indicators, we can estimate that, whereas Oxbridge admits approximately 8% of all Russell Group students, it only admits slightly over 3% of Russell Group FSM students. If Oxbridge achieved the performance of its Russell Group peers, the numbers of formerly FSM admissions would be over 100 per year.

.

Misleading Use of This Data

To add insult to injury, this data is frequently misinterpreted and misused. Here are some examples, all of which draw selectively on the data set out above.

  • Of the 80,000 FSM-eligible students in the UK only 176 received three As at A level…more than one quarter of those students….ended up at either Oxford or Cambridge – Nicholson (Oxford Undergraduate Admissions Director, Letter to Guardian, 7 March 2011)
  • ‘Of the 80,000 children eligible for free school meals in the UK in 2007, only 176 received 3 As at A level. Of those 45 (more than a quarter) got places at Oxford or Cambridge’ (Undated Parliamentary Briefing ‘Access and admissions to Oxford University’ )
  • ‘The root causes of underrepresentation of students from poorer backgrounds at leading universities include underachievement in schools and a lack of good advice on subject choices. For example, in 2009 only 232 students who had been on free school meals (FSM) achieved 3As at A-level or the equivalent.  This was 4.1% of the total number of FSM students taking A-levels, and less than an estimated 0.3% of all those who had received free school meals when aged 15.’ (Russell Group Press release, 23 July 2013).
  • ‘Such data as is available suggests that less than 200 students per year who are recorded as being eligible for FSM secure grades of AAA or better at A level. The typical entrance requirement for Cambridge is A*AA, and so on that basis the University admits in excess of one quarter of all FSM students who attain the grades that would make them eligible for entry.’ (Cambridge University Statement, 26 September 2013)
  • ‘According to data produced by the Department for Children, Schools and Families, of the 4,516 FSM students who secured a pass grade at A Level in 2008 only 160 secured the grades then required for entry to the University of Cambridge (ie AAA). Students who were eligible for FSM therefore make up less than 1% of the highest achieving students nationally each year.

Assuming that all 160 of these students applied to Oxford or Cambridge in equal numbers (ie 80 students per institution) and 22 were successful in securing places at Cambridge (in line with the 2006-08 average) then this would represent a success rate of 27.5% – higher than the average success rate for all students applying to the University (25.6% over the last three years). In reality of course not every AAA student chooses to apply to Oxford or Cambridge, for instance because neither university offers the course they want to study, e.g. Dentistry.’ (Cambridge Briefing, January 2011 repeated in Cambridge University Statement, 26 September 2013)

.

.

To summarise, Oxford, Cambridge and the Russell Group are all guilty of implying that FSM-eligible learners in the schools sector are the only FSM-eligible learners progressing to selective universities.

They persist in using the school sector figures even though combined figures for the school and FE sectors have been available since 2010.

Oxbridge’s own admission statistics show that, in 2012:

  • 9.6% of acceptances at Cambridge (332 students) were extended to students attending sixth form, FE and tertiary colleges (UK figures)
  • 10.5% of UK domiciled acceptances at Oxford (283 students) were extended to students attending sixth form colleges and FE institutions of all types

We can rework Cambridge’s calculation using the figure of 546 students with three or more A*/A grades in 2011:

  • assuming that all applied to Oxford and Cambridge in equal numbers gives a figure of 273 per institution
  • assuming a success rate of 25.6% – the average over the last three years
  • the number of FSM students that would have been admitted to Cambridge is roughly 70.

Part of the reason high-attaining disadvantaged students do not apply to Oxbridge may be because they want to study the relatively few mainstream subjects, such as dentistry, which are not available.

But it is highly likely that other factors are at play, including the perception that Oxbridge is not doing all that it might to increase numbers of disadvantaged students from the state sector.

If this favourable trend in A level performance stalls, as a consequence of recent A level reforms, it will not be reasonable – in the light of the evidence presented above – for Oxbridge to argue that this is impacting negatively on the admission of FSM-eligible learners.

.

Building on the work of the SMCPC


‘Higher Education: The Fair Access Challenge’

There is no shortage of publications on fair access and related issues. In the last year alone, these have included:

Easily the most impressive has been the Social Mobility and Child Poverty Commission’s ‘Higher Education: The Fair Access Challenge’ (June 2013), though it does tend to rely a little too heavily on evidence of the imbalance between state and independent-educated students.

.

.

It examines the response of universities to recommendations first advanced in an earlier publication ‘University Challenge: How Higher Education Can Advance Social Mobility’ (2012) published by Alan Milburn, now Chair of the Commission, in his former role as Independent Reviewer on Social Mobility.

The analysis sets out key points from the earlier work:

  • Participation levels at the most selective universities by the least advantaged are unchanged since the mid-90s.
  • The most advantaged young people are seven times more likely to attend the most selective universities than the most disadvantaged.
  • The probability of a state secondary pupil eligible for FSM in Year 11 entering Oxbridge by 19 is almost 2000 to 1; for a privately educated pupil the probability is 20 to 1.

New research is presented to show that the intake of Russell Group universities has become less socially representative in the last few years:

  • The number of state school pupils entering Russell Group Universities has increased by an estimated 2.6% from 2002/03 to 2011/12, but the commensurate increase in privately educated entrants is 7.9%. The proportion of young full-time state-educated entrants has consequently fallen from 75.6% to 74.6% over this period. The worst performers on this measure are: Durham (-9.2%), Newcastle (-4.6%), Warwick (-4.5%) and Bristol (-3.9%). The best are: Edinburgh (+4.6%), UCL (+3.3%), LSE (+3.0%) and Southampton (2.9%). The Oxbridge figures are: Cambridge (+0.3%) and Oxford (+2.3%).
  • Similarly, the proportion of young full-time entrants from NS-SEC classes 4-7 has fallen from 19.9% in 2002/03 to 19.0% in 2011/12. A table (reproduced below) shows that the worst offenders on this measure are Queen’s Belfast (-4.6%), Liverpool (-3.2%), Cardiff (-2.9%) and Queen Mary’s (-2.7%). Conversely, the best performers are Nottingham (+2.2%), York (+0.9%), Warwick and LSE (+0.8%). The figures for Oxbridge are: Cambridge (-1.0%) and Oxford (0.0%).

.

NC-SEC Capture.

  • An estimated 3,700 state-educated learners have the necessary grades for admission to Russell Group universities but do not take up places. This calculation is based on the fact that, if all of the 20 Russell Group universities in England achieved their HESA widening participation benchmarks, they would have recruited an extra 3,662 students from state schools. (The benchmarks show how socially representative each intake would be if it were representative of all entrants with the grades required for entry – though see Cambridge’s reservations on this point, above.) Some universities would need to increase significantly the percentage of state students recruited – for example, Bristol and Durham (26.9%), Oxford (23.4%) and Cambridge (23.3%).
  • Using the same methodology to calculate the shortfall per university in NS-SEC 4-7 students results in the table below, showing the worst offenders to require percentage increases of 54.4% (Cambridge), 48.5% (Bristol), 45.5% (Oxford) and 42,2% (Durham). Conversely, Queen Mary’s, Queen’s Belfast, LSE and Kings College are over-recruiting from this population on this measure.

.

NS sec Capture 2.

  • Even if every Russell Group university met the self-imposed targets in its access agreement, the number of ‘missing’ state educated students would drop by only 25% by 2016/17, because the targets are insufficiently ambitious. (This is largely because only seven have provided such targets in their 2013/14 access agreements and there are, of course, no collective targets.)
  • Boliver’s research is cited to show that there is a gap in applications from state school pupils compared with those educated in the independent sector. But there is also evidence that a state school applicant needs, on average, one grade higher in their A levels (eg AAA rather than AAB) to be as likely to be admitted as an otherwise identical student from the independent sector.
  • A Financial Times analysis of 2011 applications to Oxford from those with very good GCSEs found that those from independent schools were 74% more likely to apply than those from the most disadvantaged state secondary schools. Amongst applicants, independently educated students were more than three times as likely to be admitted as their peers in disadvantaged state schools. They were also 20% more likely to be admitted than those at the 10% most advantaged state secondary schools. As shown by the table below, the probabilities involved varied considerably. The bottom line is that the total probability of a place at Oxford for an independent school student is 2.93%, whereas the comparable figure for a student at one of the 10% most disadvantaged state secondary schools is just 0.07%.

.

NS sec Capture 3

When it comes to the causes of the fair access gap, subject to controls for prior attainment, the report itemises several contributory factors, noting the limited evidence available to establish their relative importance and interaction:

  • low aspirations among students, parents and teachers
  • less knowledge of the applications process, problems in demonstrating potential through the admissions process and a tendency to apply to the most over-subscribed courses
  • not choosing the right  A-level subjects and teachers’ under-prediction of expected A level grades
  • a sense that selective universities ‘are socially exclusive and “not for the likes of them”’

The Report states unequivocally that:

‘The Social Mobility and Child Poverty Commission is deeply concerned about the lack of progress on fair access. The most selective universities need to be doing far more to ensure that they are recruiting from the widest possible pool of talent. The Commission will be looking for evidence of a step change in both intention and action in the years to come.’

It identifies several areas for further action, summarising universities’ responses to ‘University Challenge’:

  • Building links between universities and schools: The earlier report offered several recommendations, including that universities should have explicit objectives to help schools close attainment gaps. No evidence is given to suggest that such action is widespread, though many universities are strengthening their outreach activities and building stronger relationships with the schools sector. Several universities highlighted the difficulties inherent in co-ordinating their outreach activity given the demise of Aimhigher, but several retain involvement in a regional partnership.
  • Setting targets for fair access: The earlier report recommended that HE representative bodies should set statistical targets for progress on fair access over the next five years. This was not met positively:

‘Representative bodies in the Higher Education Sector did not feel this would be a useful step for them to take, saying that it was difficult to aggregate the different targets that individual institutions set themselves. There was also a feeling among some highly selective institutions that the report overestimated the number of students who have the potential to succeed at the most selective universities.’

Nevertheless, the Commission is insistent:

The Commission believes it is essential that the Russell Group signals its determination to make a real difference to outcomes by setting a clear collective statistical target for how much progress its members are aiming to make in closing the ‘fair access gap’. Not doing so risks a lack of sustained focus among the most selective universities’.

  • Using contextual admissions data: The report argues that ‘there is now a clear evidence base that supports the use of contextual data’. Recommendations from the earlier report were intended to universalise the use of contextual data, including commitment from the various representative bodies through a common statement of support and a collaborative guide to best practice. There is no sign of the former, although the Commission reports ‘widespread agreement that the use of contextual data during the admissions process should be mainstreamed’. However it notes that there is much more still to do. (The subsequent SPA publication should have helped to push forward this agenda.)
  • Reforming the National Scholarship Programme: The earlier report called on the Government to undertake a ‘strategic review of government funding for access’ to include the national Scholarship Programme (NSP). The suggestion that the imminent HEFCE/OFFA National Strategy should tackle the issue has been superseded by a Government decision to refocus the NSP on postgraduate education.
  • Postgraduate funding reform: The earlier report recommended work on a postgraduate loan scheme and further data collection to inform future decisions. The current report says that:

‘…the Government appears to have decided against commissioning an independent report looking at the issue of postgraduate access. This is very disappointing.’

and calls on it ‘to take heed’. However, this has again been superseded by the NSP announcement.

The SMCPC’s ‘State of the Nation 2013’ report reinforces its earlier publication, arguing that:

‘…despite progress, too much outreach work that aims to make access to university fairer and participation wider continues to rely on unproven methods or on work that is ad hoc, uncoordinated and duplicative… These are all issues that the higher education sector needs to address with greater intentionality if progress is to be made on breaking the link between social origin and university education.

The UK Government also needs to raise its game… much more needs to be done… to address the loss of coordination capacity in outreach work following the abolition of Aimhigher.’

It recommends that:

‘All Russell Group universities should agree five-year aims to close the fair access gap, all universities should adopt contextual admissions processes and evidence-based outreach programmes, and the Government should focus attention on increasing university applications from mature and part-time students.’

 .

What Else Might Be Done?

I set myself the challenge of drawing up a reform programme that would build on the SMCPC’s recommendations but would also foreground the key issues I have highlighted above, namely:

  • A significant improvement in the rate of progression for disadvantaged high-attaining learners to Oxbridge;
  • A more rigorous approach to defining, applying and monitoring improvement measures; and
  • The publication of more substantive and recent data

A determined administration that is prepared to take on the vested interests could do worse than pursue the following 10-point plan

  • 1. Develop a new approach to specifying universities’ fair access targets for young full-time undergraduate students. This would require all institutions meeting the BIS ‘most selective HEI’ criteria to pursue two universal measures and no more than two measures of their own devising, so creating a basket of no more than four measures. Independent versus state representation could be addressed as one of the two additional measures.
  • 2. The universal measures should relate explicitly to students achieving a specified A level threshold that has currency at these most selective HEIs. It could be pitched at the equivalent of ABB at A level, for example. The measures should comprise:
    • A progression measure for all learners eligible for the Pupil Premium in Year 11 of their secondary education (so a broader measure than FSM eligibility); and
    • A progression measure for all learners – whether or not formerly eligible for the Pupil Premium – attending a state-funded sixth form or college with a relatively poor historical record of securing places for their learners at such HEIs. This measure would be nationally defined and standardised across all institutions other than Oxbridge.
  • 3. In the case of Oxford and Cambridge the relevant A level tariff would be set higher, say at the equivalent of AAA grades at A level, and the nationally defined  ‘relatively poor historical record’ would reflect only Oxbridge admission.
  • 4. These two universal measures would be imposed on institutions through the new National Strategy for Access and Student Success. All institutions would be required to set challenging but realistic annual targets. There would be substantial financial incentives for institutions achieving their targets and significant financial penalties for institutions that fail to achieve them.
  • 5. The two universal measures would be embedded in the national Social Mobility Indicators and the KPIs of BIS and DfE respectively.
  • 6. Central Government would publish annually data setting out:
    • The number and percentage of formerly Pupil Premium-eligible learners achieving the specified A level thresholds for selective universities and Oxbridge respectively.
    • A ‘league table’ of the schools and colleges with relatively poor progression to selective universities and Oxbridge respectively.
    • A ‘league table’ of the universities with relatively poor records of recruitment from these schools and colleges.
    • A time series showing the numbers of students and percentage of their intake drawn from these two populations by selective universities and Oxbridge respectively each year. This should cover both applications and admissions.
  • 7. All parties would agree new protocols for data sharing and transparency, including tracking learners through unique identifiers across the boundaries between school and post-16 and school/college and higher education, so ensuring that the timelag in the publication of this data is minimal.
  • 8. Universities defend fiercely their right to determine their own undergraduate admissions without interference from the centre, meaning that the business of driving national improvement is much more difficult than it should be. But, given the signal lack of progress at the top end of the attainment distribution, there are strong grounds for common agreement to override this autonomy in the special case of high-achieving disadvantaged students.  A new National Scholarship Scheme should be introduced to support learners formerly in receipt of the Pupil Premium who go on to achieve the Oxbridge A Level tariff:
    • Oxford and Cambridge should set aside 5% additional places per year (ie on top of their existing complement) reserved exclusively for such students. On the basis of 2012 admissions figures, this would amount to almost exactly 250 places for England divided approximately equally between the two institutions (the scheme could be for England only or UK-wide). This would provide sufficient places for approximately 45% of those FSM learners currently achieving 3+ A*/A grades.
    • All eligible students with predicted grades at or above the tariff would be eligible to apply for one of these scholarship places. Admission decisions would be for the relevant university except that – should the full allocation not be taken up by those deemed suitable for admission who go on to achieve the requisite grades – the balance would be made available to the next best applicants until the quota of places at each university is filled.
    • The Government would pay a premium fee set 50% above the going rate (so £4,500 per student per annum currently) for each National Scholarship student admitted to Oxbridge. However, the relevant University would be penalised the full fee plus the premium (so £13,500 per student per year) should the student fail to complete their undergraduate degree with a 2.2 or better. Penalties would be offset against the costs of running the scheme. Assuming fees remain unchanged and 100% of students graduate with a 2.2 or better, this would cost the Government £1.125m pa.
  • 9. In addition, the Government would support the establishment of a National Framework Programme covering Years 9-13, along the lines set out in my November 2010 post on this topic with the explicit aim of increasing the number of Pupil Premium-eligible learners who achieve these tariffs. The budget could be drawn in broadly equal proportions from Pupil Premium/16-19 bursary, a matched topslice from universities’ outreach expenditure and a matched sum from the Government. If the programme supported 2,500 learners a year to the tune of £2,500 per year, the total steady state cost would be slightly over £30m, approximately £10m of which would be new money (though even this could be topsliced from the overall Pupil Premium budget).
  • 10. The impact of this plan would be carefully monitored and evaluated, and adjusted as appropriate to maximise the likelihood of success. It would be a condition of funding that all selective universities would continue to comply with the plan.

Do I honestly believe anything of this kind will ever happen?

.

flying pig capture

.

GP

November 2013