
.
This post examines recent developments in what I have termed ‘the economics of gifted education’.
It follows up a commitment I made to revisit the topic in The Gifted Phoenix Manifesto for Gifted Education which relies significantly on the economic case for investment in gifted education:
‘There is a strong economic focus because that is a current predilection – and because the economic arguments are too rarely advanced and often underplayed. They deserve to be paramount in our current financial predicament.’

Photo Credit: Leo Reynolds via Compfight cc
Discussion of the Manifesto shows that this view is not unanimous amongst the global gifted education community. Some believe that the economic arguments detract somehow from the educational case for meeting the needs of gifted learners, and results in them being perceived as nothing more than a convenient tool to generate economic growth.
Some are also wary of the economic arguments for education per se, because they are perceived to distort and over-ride the case for education as an end in itself, worth pursuing for its intrinsic benefit alone.
I believe neither of these things. I firmly uphold the educational case for supporting gifted learners and fully recognise the intrinsic benefits of education, but I believe that each can be complemented and enhanced by the economic case rather than being threatened or undermined by it.
It is this which drives me to understand the economic case, as encapsulated in recent research, to synthesise from various sources and to present the result for readers’ consideration. Advocates for gifted education are of course free to use these arguments or to ignore them, entirely as they wish.
.
I feel it incumbent on me to warn readers that this is a long and complex piece. The meat in the sandwich is academic research – barely digestible at the best of times – but I have tried to make the bread on each side as nourishing as possible. You should be able to get a good sense of the basic argument by consuming the bread alone.
The Gifted Phoenix Premiss
I want to begin by unpacking the basic premiss I advanced in the Manifesto. The case I am advancing has eight distinct steps and runs as follows:
- Effective gifted education involves maintaining a balance between excellence – raising standards for all – and equity – raising standards relatively faster for those from disadvantaged backgrounds.
- At national level, excellence might be measured by increasing the proportion of learners achieving the high achievers’ benchmarks in international comparisons studies such as PISA, TIMSS and PIRLS. This can be described as increasing the ‘smart fraction’.
- Similarly, at national level, equity might be measured through a country’s success in narrowing the excellence gap between the performance of high achievers from advantaged and disadvantaged backgrounds. This helps to increase the ‘smart fraction’ as more disadvantaged learners reach the high achievers’ benchmarks.
- Taken together, these two actions contribute significantly to national efforts to increase the supply of highly skilled human capital which has a significant positive impact on economic growth.
- Efforts to increase the ‘smart fraction’ and narrow the excellence gap must begin during – and be sustained throughout – compulsory schooling, through a dedicated and coherent national programme. This should link seamlessly with continuing efforts within the national higher education system, and beyond.
- The cost of this programme can be offset against the much greater benefits that will accrue through stronger economic growth, so justifying the initial investment, even during a period of austerity.
- This national investment will also generate several highly important spillover benefits, not least stronger social mobility as more learners from disadvantaged backgrounds compete on a level playing field with their advantaged peers. There are also cultural, sporting, political and ‘feel-good’ benefits. (These include improving the quality of political leadership which seems increasingly impoverished in many countries at this time, including my own.)
- It would be wrong to focus investment disproportionately in areas such as STEM and IT, partly because other fields can make a substantive contribution to economic growth, and partly because of the important spillover benefits outlined above.
I wanted to see whether I could find any research evidence to support this premiss since I last discussed the economics of gifted education in June 2010.
There is some evidence and I have drawn together a selection of material that goes some way towards supporting my argument.
But I can find no similar statement of the complete argument. There are bits and pieces here and there, but no perceptible effort to draw the different strands together.
Nor can I find any work that systematically analyses the costs and benefits of a national investment in gifted education, so serving as an exemplar of the Gifted Phoenix premiss.
The economics of gifted education is nascent merely, but still I find this profoundly disappointing. Gifted educators could make a much more convincing case to policy makers with such evidence at their fingertips.
Maybe there is such work and I have failed to find it. Perhaps it is written in languages other than English, possibly to persuade those who have invested so heavily in gifted education in some of the countries I have featured on this blog.
If so, it richly deserves to be translated and disseminated in the English-speaking world.
.
Flickerings of Interest Since June 2010 (and my own involvement)
I flatter myself that I know something about gifted education but I am certainly not an economist.
A quarter of a century ago I spent two years studying the economics of education as part of a postgraduate diploma at London’s Institute of Education. So I have some basic grounding but I am very rusty indeed.
Nevertheless, I like to think I invented the term ‘the economics of gifted education’. I recall using it in discussion from around 2008 or thereabouts.
If you Google the term most of the references are to my work, especially the two posts dating from June 2010 that appear on this Blog:
As far as I can establish, there is only one other contender writing in English, one Pam Clinkenbeard, Professor of Educational Foundations at the University of Wisconsin-Whitewater in the US.
A biography on the NAGC Website is attached to details of an event due to take place in April 2010, so before I wrote my posts. It says Clinkenbeard:
‘Is working on research projects related to the economics of gifted education and scientific reasoning in diverse gifted preschoolers’.
So maybe I didn’t invent the term after all.
Unfortunately I cannot find further details of Clinkenbeard’s research, though I am aware of a brief article she published in 2007 ‘Economic Arguments for Gifted Education’ which explains the concept of human capital and advances the economic arguments for investment in gifted education from a gifted educator’s perspective.
The article refers to a paper presented at the World Council Conference in 2007, but I can find no record of that online. Further searches on Google Scholar reveal no subsequent publications from Clinkenbeard in this field.
After I wrote my 2010 posts, there were signs of interest elsewhere. The IRATDE considered devoting an edition of its online journal to the topic and I was even offered the chance to serve as joint editor.
Unfortunately the call for manuscripts elicited little interest amongst the academic gifted education community. So I approached Eric Hanushek for some advice about how best to tap in to economics of education networks. He didn’t deign to reply. There will be more from Hanushek later in this post
The abortive IRATDE Conference scheduled for November 2011 in Saudi Arabia included amongst its themes ‘Research in the Economics of Education’, though none of the keynote speakers was scheduled to address the topic. I heard that Hanushek had been invited to speak, but presumably he turned down the opportunity. So did I.
I was originally slated as an ‘invited speaker’ – precise topic to be confirmed – but I took umbrage at my second class status, shared with just one other unfortunate. Moreover, the research I had undertaken to write a post on gifted education in Saudi Arabia led me to conclude that it was definitely not a place I wished to visit.
Also in 2011, the California Association for the Gifted subtitled one edition of its journal, Gifted Education Communicator ‘The Economics of Gifted Education’.
Unfortunately, this sits behind a paywall and, equally unfortunately, the contents list on Amazon is rather oblique, mentioning only:
‘The Most Economical Program for Gifted Learners Lanny Ebenstein… The Economy of Gifted Education U.S. Rep. Elton Gallegly (R-Simi Valley)… Economy of Giftedness Carolyn Kottmeyer’.
I have not been able to find out what these contributions add to our understanding of the issue.
Then in June 2012, the World Council’s Newsletter included a report from the outgoing President, which began:
‘During the last month, I was invited by Todd Lubart (Université Paris Descartes) to meet with a number of European scholars. This meeting aimed at discussing the role of creativity in developing business, in addition to the economics of education. This meeting motivated us to talk about the importance of gifted education, and to start working on a special issue of Gifted and Talented International (GTI) concerned with the Economics of Gifted Education.
Based on the outcomes of this discussion, the Editor-in-Chief has invited one of the top leaders in the field of economics of education to write the theoretical framework that will be the target paper. Consequently, a number of scholars will be invited to write their critiques and response articles.’
Needless to say I wasn’t one of those ‘European scholars’. But evidently the World Council had borrowed the idea of a dedicated volume from IRATDE.
I don’t know whether this production is still in the pipeline – there was only one edition of GTI in 2012, though it is supposed to appear twice a year.
The December 2012 newsletter made no reference to it, though it did explain that the outgoing President is himself ‘the Editor-in-Chief’ and it discusses his take on the development process for special issues of GTI in general terms:
‘The success of a special issue depends upon getting the right scholar to write the target paper and the concluding section at the right time, and on the right people to comment, critique, and edit. I will work with the editorial board to develop candidate themes for a number of special issues. We are open to ideas from the members of our community.’
Does this mean that the promised edition featuring the economics of gifted education will not materialise? Certainly I have not been troubled by an invitation to comment on a target article, but perhaps I’m not on the list.
.
Topicality and Relevance
This is not simply an arid theoretical matter. It strikes to the very heart of many countries’ strategies for extricating themselves from economic stagnation and recession.
Human capital arguments have long been part of the political rhetoric, though they seem to fade in and out of fashion and are often applied in very specific contexts and settings.
In the UK as I write, parts of the Government are beginning to make the case.
A year ago infrastructural investment seemed to be the only game in town (though the Government’s published ‘Plan for Growth’ was admittedly far broader), but now the rhetoric has shifted. There is overt support for human capital arguments:
‘Set out well by the LSE Growth Commission, that long-term growth involves a major and sustained commitment to skills, innovation and infrastructure investment.’
Unfortunately, the Growth Commission has a relatively narrow view of human capital investment.
They recognise that:
‘Improving the quality of compulsory education is the key to achieving these gains [in growth]’
and they cite evidence of the impact on growth of ‘increasing UK school standards’ to the level achieved by some competitors.
But their proposed solutions – while focused on the necessity of improving the quality of human capital – are entirely generic, insufficiently differentiated to support (potential) high achievers.
Their recipe for success consists of across-the-board solutions such as more semi-autonomous academy schools and improvements to teacher quality. Even when they make the case to ‘help to develop the talent of disadvantaged pupils’, their focus is on generic accountability measures and Pupil Premium funding. No sign here of any conception of the smart fraction or the excellence gap!
Yet when it comes to post-compulsory education they readily acknowledge the case for ‘improving the maths and language ability of…post-16 vocational students’ and the need ‘to attract the best students…from around the world’ into our higher education institutions since:
‘There are potential advantages to the UK from having the world’s leaders in economy, society and government educated here.’
English Education Ministers are also seized of the importance of human capital investment and sometime even couch this in differentiated terms. Witness this recent speech from Elizabeth Truss:
‘LiLanqing, the Vice Premier of China from 1993 to 2003…grasped the fact that every country, even if they are among the most powerful, is in a global race. His observation that “We are striving for modernization at the dawn of a knowledge economy and in the midst of intensifying global competition” could have been uttered by me or one of my ministerial colleagues…
…I have no idea what the jobs of the future will be – and nor does anyone else. But we do know that they will demand people with even greater powers of thought, innovation and skill. As the middle is squeezed from the hourglass economy, it will no longer be enough to be able to process – instead much more flexibility and greater cognitive skills will be required.
And along with this ability to think, the demand for specialist skills is rising, particularly for quantitative and mathematical skills and for effective communication skills – ideally in more than one language.’
The Government is advancing a series of actions to tackle this need – some system-wide and some focused specifically on mathematics – but they too stop short of systematic and concentrated effort to increase the supply of high-achieving learners through interventions targeted specifically at them.
.
The Economic Case for Supporting High Achievers in Maths
The flow of the argument causes me to introduce at this point some recent work by John Jerrim. He richly deserves his position at the top of the bill since he is probably the nearest thing we have to an economist of gifted education in England today.
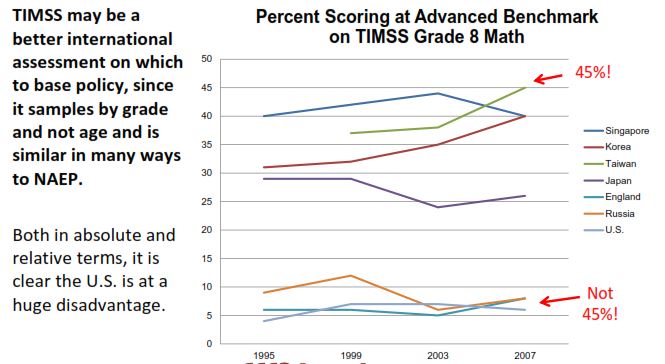
Jerrim recently published ‘The mathematical skills of school children: how does England compare to the high-performing East Asian countries’ (2013) which examines:
‘Whether the gap between the highest achieving children in England and highest achieving children in East Asia widens (or declines) during secondary school. This is a particularly prominent policy issue, as having a pool of very highly skilled individuals is vital for technological innovation and long-run economic growth.’
The study uses TIMSS and PISA maths test data to identify learners at the 90th percentile of the achievement distribution (so the top 10%) and compares their progress in different countries between the end of primary school and the end of secondary school.
The graph reproduced below compares the performance of this group in England with the same population in various Asian countries that perform particularly well on TIMSS and PISA maths assessments. The subsequent table gives test scores at the 90th percentile for a selection of other countries too (expressed in terms of standard deviations above the mean).
.
 .
.

.
So there is a tendency for the gap between the highest achieving pupils in England and the highest achieving children in the high-performing Asian countries to increase between the end of primary school and the end of secondary school.
The paper also examines the excellence gap, noting that:
‘No country has a significantly bigger socio-economic achievement gap than England at either age 13/14 or age 15/16.’
And the overall gap increases between ages 10 and 16. Jerrim argues that:
‘The most pressing issue is to ensure that the curriculum stretches the best young mathematicians enough, and that they are motivated (and incentivised) to fully develop their already accumulated academic skill. Evidence presented in this paper has suggested that the gap between the highest achieving children in England and the highest achieving children in East Asia widens between ages 10 and 16 (at least in mathematics). This is something that needs to be corrected as highly skilled individuals are likely to be important for the continuing success of certain major British industries (e.g. financial services) and to foster the technological innovation needed for long-run economic growth.’
The paper explores whether the East Asian predilection for private tuition helps explain the difference. But:
‘While a large proportion of East Asian families are willing to personally finance such activities through the private sector, the same is unlikely to hold true in the foreseeable future within England. Consequently, the state may need to intervene. Gifted and talented schemes, a shift of school and pupil incentives away from reaching floor targets (e.g. a C grade in GCSE mathematics) and enhanced tuition for children who excel in school are all possible policy responses.’
But there is a caveat – cultural change may also be needed:
‘Consequently, the implementation of some of the characteristics of the East Asian educational model may imply the need for a cultural shift towards greater belief in the value of education amongst all and the importance of a hard work ethic. Indeed, it is important for academics and policymakers to recognise that East Asian children vastly out-perform their English peers even when they have been through the English schooling system. This is perhaps the clearest indication that it is actually what happens outside of school that is driving these countries superior PISA and TIMSS math test performance.’
It is worth emphasising that a well-designed gifted education programme and effort to bring about cultural change need not be mutually exclusive. A gifted programme can be designed to improve the motivation, aspirations and attitudes of the learners who participate (and their immediate families) as well as improving their achievement.
Indeed, given the range and size of out-of-school effects on socio-economic achievement gaps, that is arguably an essential component of any effort to narrow the excellence gap.
.
Where Had We Got To In 2010? Defining Terms
.
The Economics of Gifted Education – The Smart Fraction
Before reviewing other key documents published in the last three years, I must briefly reprise the nub of the argument I advanced in 2010, through the two ‘economics of gifted education’ posts already referenced.
I shall also reference another relevant post called ‘The Transatlantic Excellence Gap: A Comparative Study of England and the UK’ published in August 2010.
In ‘The Economics of Gifted Education’, I confined myself to explaining:
- Human capital, which I described as ‘the collective term for the knowledge, skills, understanding and personal attributes that equip a person to generate economic value’, much of which is typically acquired through education.
- Endogenous growth theory, which suggests that ‘investment in human capital brings about innovation, improves the efficiency of production and results in better products and services. This generates increasing returns and so brings about continuous long-term improvement in economic growth.’
- The OECD’s categorisation of human capital as: know-what (knowledge), know-why (scientific knowledge), know-how (skills) and know-who (networks).
- The evolution of Knowledge-Based Economies (KBEs) in which ‘the generation, application and dissemination of knowledge is seen as the principal driver of economic growth. Education is key to the development of a successful KBE and most national plans focus heavily on strengthening the education sector.’
- Florida’s concept of the Creative Class ‘a socio-economic group, comprising some 40 million creative and knowledge-based workers in the US, destined to play a key role in future economic growth’.
In ‘The Economics of Gifted Education: Smart Fraction Theory, I outlined the development of this concept, beginning with a description of the impact of cognitive ability on economic growth.
This drew on two papers by the aforementioned Hanushek and his colleague Woessmann: ‘The Role of Cognitive Skills in Economic Development’ (2008) and ‘Do Better Schools Lead to More Growth: Cognitive Skills, Economic Outcomes and Causation’ (2009).
The first of these explained the benefits of setting aside the quantity of schooling as a measure of human capital in favour of a qualitative measure, ‘cognitive skill’, which takes into account environmental and genetic factors and may be demonstrated and measured by performance in international comparisons studies such as PISA.
It suggested that, were countries performing at the mean in PISA and TIMSS maths and science assessments to achieve the level of the highest performing countries, they would secure a 5% improvement in GDP over 20 years.
It also noted (my summary) that:
‘Improvements in top end performance and in average performance have separate and complementary effects on economic growth.’
The second study developed this point further (my summary again):
‘Were countries to secure an improvement of 10% in the proportion of students scoring at 400+ points and 600+ points respectively, each would have a positive impact on economic growth – and the intervention at the top end of the ability range would have 4 times greater impact than the intervention at average ability levels…
…Providing better basic education for all and also pushing significant numbers to very high achievement levels is the best policy for economic growth.’
I proceeded to give a brief account of the development of smart fraction theory, which has its origins in the correlation between national average IQ and per capita GDP.
I explained how these two research strands had been synthesised in a paper ‘The Impact of Smart Fractions, Cognitive Ability of Politicians and Average Competence of Peoples on Social Development’ by Rindermann, Sailer and Thompson (2009).
I summarised their argument:
- There are strong links between findings in the economic tradition (human capital) the educational tradition (literacy) and the psychological tradition (intelligence) suggesting they are measuring ‘the same underlying latent factor’ of cognitive ability.
- The smart fraction should be pitched similarly to Hanushek and Woessmann’s higher level, defined here as the 95th percentile on TIMSS, PISA and PIRLS tests of comparative academic performance, which is said to be equivalent to IQ125.
- There is a much stronger correlation between high national GDP and the smart fraction than high national GDP and average cognitive ability.
- The positive impact on GDP can be isolated mainly to STEM-related achievement as opposed to achievement outside the STEM fields, suggesting the former are the main drivers of national affluence.
Their ultimate conclusion: ‘our results emphasise the importance of nurturing the highly gifted’.
.
The Excellence Gap
I began a sequence of posts on the Excellence Gap in August 2010, with one reviewing evidence from the USA, drawing especially on ‘Mind The (Other) Gap: The Growing Excellence Gap in K-12 Education’ by Plucker et al (2010).
The authors applied the term to differences between the achievement of advantaged and disadvantaged students performing at the highest levels, in this case on NAEP reading and maths assessments for Grades 4 and 8 respectively.
They considered the impact of gender, ethnicity, socio-economic background and English language proficiency, recognising the complex interaction between these factors.
They found socio-economic gap between advantaged and disadvantaged high achievers had not been narrowed by NCLB, though there was no substantive evidence that NCLB’s focus on lower achievers had actually increased the gap.
They also concluded that federal involvement in reducing the excellence gap was negligible. The Javits Scheme – then in operation – did not bring about any substantive improvements.
Moreover:
‘In some cases where the excellence gap appears to be shrinking, this is attributable to a dip in performance at the higher level – rather than all achievers improving their performance, with lower achievers improving at a relatively faster rate.’
Plucker et al recommended that:
- The US Government should make closing the excellence gap a national and state-level priority – and should consider the effect of all new policies in addressing this priority.
- It should also determine the optimal blend of national, state and local interventions to narrow the gap; this would involve more research into effective strategies.
- There should be financial incentives to encourage states, districts and schools to tackle the excellence gap and realistic targets for them to aim at.
- High achievement ceilings should be built into the assessment processes supporting the Common Core Standards then under consideration.
I also made a connection between this study and an earlier report by McKinsey ‘The Economic Impact of the Achievement Gap in America’s Schools’ (2009) which defined two types of ‘top gap’, one based on ethnicity and the other on the gap between top performers/performance in the US and in other countries.
Unfortunately, McKinsey stopped short of quantifying the economic value of reducing either version of the ‘top gap’.
Part Two of this post examined the evidence for a corresponding excellence gap in England, while Part Three discussed the relationship between the excellence gap and fair access to higher education in the UK.
.
Progress Since 2010
So far as is possible in this paywall-restricted context, I want to explore how these different strands of thinking have evolved since 2010.
In order to make the post manageable I have confined myself principally to the writings of the four key protagonists we have already encountered, namely messrs Hanushek, Jerrim, Plucker and Rindermann (as well as their various co-authors).
I have been fortunate to find all the papers referenced below freely available online. I sincerely hope that they will remain so, because they deserve to be widely read.
As you proceed through the remainder of this post, imagine a dartboard. I will try to show where these leading thinkers have brought forward material that is relevant to the argument I have advanced above. Each paper contributes a score on the board by inserting a dart in one or more segments.
.

.
Extending the metaphor, imagine that a bullseye is a full economic justification for the investment in gifted education. How close do these contributors get?
If we piece their contributions together, how far away are we from achieving a bullseye-equalling score from the various darts that have hit the board? Which segments have our selected players failed to hit?
I will tally up the score at the end of the post.
We begin with the excellence gap, drawing principally on work from Plucker and Jerrim, before moving on to consider Hanushek’s more recent work on the impact of high cognitive skills on economic growth and Rindermann’s approach to cognitive competence.
The Excellence Gap
.
Work in the US
It seems that, in the USA at least, further work on the Excellence Gap since 2010 has been rather limited..
‘Mind the (Other) Gap’ said that:
‘A forthcoming report by CEEP will provide evidence that certain state education policies may have a small but positive relationship with shrinking excellence gaps.’
There is a complete set of ‘State profile reports’ but these are exclusively descriptive, failing to establish which state policies are most effective.
It seems that the forthcoming report must still be forthcoming (but meantime Plucker has moved from CEEP, based at the University of Indiana, to the University of Connecticut).
A 2012 publication: ‘Trends in education excellence gaps: a 12-year international perspective via the multilevel model for change’ by Rutkowski, Rutkowski and Plucker is hidden behind a paywall
The abstract suggests that the study uses TIMSS data to examine international trends in excellence gaps focusing particularly on the gender and immigrant status of learners:
‘Specifically, we found evidence of shrinking sex-based excellence gaps in both science and mathematics. With respect to immigrant status and excellence gaps, small gaps in the proportion of advanced achievers persist over time. In the context of large demographic changes worldwide, we argue that these findings are generally encouraging.’
A 2012 presentation by the same authors seems to cover much the same territory and suggests that the analysis utilises the TIMSS advanced international benchmark in maths and science. Conclusions relate to gender and immigrant status only: there is no treatment of socio-economic gaps.
Other presentations are also available at the link given above. One, by Burroughs and Cogan of Michigan State University, also refers to further work on ‘which (if any) state policies mitigate excellence gaps’.
The list it provides of ‘policies associated with smaller SES excellence gaps’ is unsurprising:
- Share of school districts with gifted education administrators
- Requirement of certification for gifted education teachers
- Dedicated gifted education funding
- State approval of district gifted education plans
Another presentation, by Plucker himself, uses the TIMSS Grade 8 maths data to highlight stark international comparisons.
.
.
Using NAEP data, Plucker examines excellence gap trends, concluding that:
‘At the present rate it would take decades (if ever) for the gaps to close’.
He highlights the fact that excellence gaps are distinct from more general achievement gaps:
‘Although achievement gaps are somewhat larger than excellence gaps, there [sic] are also closing more quickly and consistently’.
Moreover:
‘There is no evidence that ANY state has figured out a way to address Excellence Gaps, and many states have laughably low criteria for what constitutes an Advanced student.’
This presentation also references a range of further work:
- ‘Second edition of report in March 2012
- Special report on science excellence gaps in near future
- Special report on the experiences of gifted black males around August 2012
- Report on NAEP excellence gaps in major urban areas around this time next year [ie early 2013]’
Little if any of this seems to have materialised.
Interestingly, a final presentation from June 2012 fails to include the slide containing details of further work. The CEEP website at Plucker’s former University has no further information and Plucker’s page at UConn is similarly coy.
Meantime, the NAGC in the United States has published ‘Unlocking Emergent Talent: Supporting High Achievement of Low-Income High-Ability Students’ (2012). I will review this in more detail in a separate post. It draws on the excellence gap research above and identifies a research agenda for the future.
But conspicuously absent from this, as from all the research I have found, is any effort by economists of education to quantify the cost of the excellence gap and the savings that would accrue from reducing it. Since McKinsey apparently ducked that calculation in 2009, no-one else seems to have attempted it.
.
Important Work in the UK
In the UK Jerrim has also undertaken some work on the excellence gap. In March 2011 he and Vignoles published ‘The use (and misuse) of statistics in understanding social mobility: regression to the mean and the cognitive development of high ability children from disadvantaged homes’
This study revisits the contention that young able learners from disadvantaged backgrounds are subsequently overtaken by their more advantaged peers. The contention seems to originate in work by Feinstein.
He assessed children at 22 months, 42 months, 60 months and 120 months respectively. Learners with high ability were defined as those in the top quartile at the first assessment. Socio-economic background was defined on the basis of parental occupation. Feinstein then traces progress by learners from advantaged and disadvantaged backgrounds with high and low ability respectively, producing this now famous chart.
.

.
Though the high ability children begin at the same level, those from disadvantaged backgrounds subsequently fall behind their more advantaged peers, and appear to be overtaken by low ability learners from advantaged backgrounds somewhere between the third and fourth assessment.
Jerrim and Vignoles argue that this effect is attributable to regression towards the mean, which can be caused by selection:
‘Regression to the mean due to selection is a statistical phenomenon that occurs when taking repeated measures on the same individual(s) over time. Due to random error, those with a relatively high (or low) score on an initial examination are likely to receive a less extreme mark on subsequent tests. In the context of the results presented above, children defined as ―high ability‖ based on one single exam are not necessarily the most talented in the population. Rather assignment to this group is actually based on children‘s true ability and the “luck” that the child happened to have when sitting that particular assessment (i.e. random error).’
Such regression can also be attributable to lack of comparability between the tests Feinstein used at different ages.
The authors set out findings from their own studies before concluding:
‘There is currently an overwhelming view amongst academics and policymakers that highly able children from poor homes get overtaken by their affluent (but less able) peers before the end of primary school. Although this empirical finding is treated as a stylised fact, the methodology used to reach this conclusion is seriously flawed. After attempting to correct for the aforementioned statistical problem, we find little evidence that this is actually the case Hence we strongly recommend that any future work on high ability disadvantaged groups takes the problem of regression to the mean fully into account.’
One assumes that other work by Jerrim himself – and by Plucker and his associates – manages not to fall foul of this statistical bear-trap. I apologise if any of my selected pieces have been caught by that trap: it should be clear that I do not have the expertise to judge.
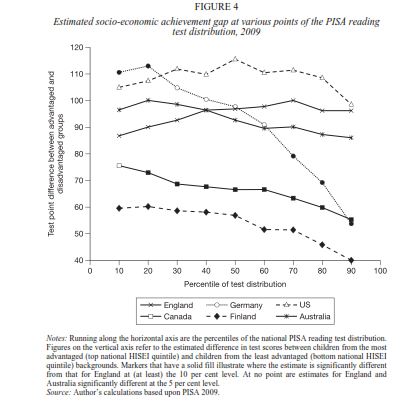
The following year, Jerrim published a further study ‘The socio-economic gradient in teenagers’ literacy skills: how does England compare to other countries?’ (2012).
This examines the strength of the relationship between socio-economic background (as measured by parents’ occupation) and reading skills at age 15, based on the PISA 2009 assessment of reading.
It considers the size of the socio-economic effect at different points of the achievement distribution, using nationally defined deciles. This means that the deciles are pitched at different levels in different countries, (but Jerrim notes that his findings would also hold had he used generic deciles instead).
Comparisons are made between the UK and five other countries: Australia, Canada, Finland, Germany and the US, with a view to exploring whether the most able children from disadvantaged backgrounds can match the performance of their advantaged peers. Jerrim explains the relevance of this in terms of social mobility:
‘This has important implications for those concerned with widening access to higher education (particularly to ‘elite’ institutions) and the top professions. In particular, socio-economic differences towards the top of the achievement distribution need to be sufficiently narrow to make such pathways a viable option for disadvantaged groups. If this is not accomplished, then England is unlikely to foster the ‘top-end’ social mobility that many see as a desirable goal.’
Jerrim begins by considering average differences between advantaged and disadvantaged learners in different countries on the basis of PISA 2009 reading test scores. He finds that:
‘By the final year of compulsory schooling, the reading skills of English children from disadvantaged backgrounds are (on average) two-and-a-half years behind those from the most affluent homes.’
But this difference is relatively similar to most other developed countries: England sits comfortably mid-table. This contrasts with the findings of earlier studies suggesting that the socio-economic gap is particularly large in England.
Jerrim next considers the achievement gap for different deciles of the achievement distribution. In the graph below, these deciles are plotted against the gap between the results of advantaged and disadvantaged learners in the six countries named above.
.
.
Jerrim draws out a particularly interesting comparison with Germany. The gradient is steeper in Germany than England at the bottom end of the distribution, representing the lowest achievers. However, the reverse is true in the case of the highest achievers.
In discussing the reasons for this, he suggests that it may be because policy in England is focused disproportionately on ‘the long tail of low achievement’ with comparatively less attention paid to the excellence gap. Another reason might be the relatively greater segregation in English schools, where more advantaged learners are concentrated disproportionately in the better schools. However, the differences in England remain large ‘if one also includes a school-level fixed effect’.
Jerrim next includes a table showing how the socio-economic gap impacts on different deciles of the achievement distribution in a wider range of countries.
.

.
He comments on the difference between the US – where the association between background and achievement is relatively strong across the achievement deciles – and Finland, where the association is comparatively weak.
In England there is a relatively strong link between socio-economic background and high achievement:
‘Socio-economic test score differences at the 80th percentile are greater here than in 18 out of the other 22 OECD countries considered (and significantly so on 11 occasions). The same is not true, however, at the bottom of the PISA reading test distribution, where England is actually ranked above the median, having smaller socioeconomic test score differences.’
Finally Jerrim considers whether the socio-economic gap has declined since 2000. He finds that, while the average gap has declined and that is repeated at the bottom end of the achievement distribution, this is not true at the top.
.

.
In discussing why this is the case Jerrim draws attention to the impact of the national literacy strategy and criticism that:
‘Initiatives targeting more able children in England (for example, the Gifted and Talented scheme) have, on the other hand, been criticised in the media for not reaching those from lower socio-economic groups.’
But this is somewhat simplistic since it assumes that the resources allocated to these two initiatives were broadly comparable when there was in fact a huge difference between their relative scale and reach.
Jerrim does not rule out the possibility that these changes can be attributed – at least in part – to a decline in academic standards He finds that the narrowing of the gap appears to have been driven by a relatively greater decline in achievement amongst those from advantaged backgrounds but:
‘Whereas the apparent decline in performance for the top SES quintile seems to have occurred quite evenly across the achievement distribution… the decline suffered by the most disadvantaged group is most apparent at the top end’
He ultimately fails to answer the question whether these differences are relatively more attributable to Government initiatives or to falling standards (which might in part be attributable to Government policy).
However, he concludes that improving the educational achievement of the most able learners from disadvantaged backgrounds should be a priority in England:
‘The key question for policymakers is, of course, ‘How do we reach this goal?’… schemes to raise academically able pupils’ aspirations during secondary school may be important if these have a causal influence on their later attainment. Alternatively, a targeted gifted and talented’ scheme could be introduced, where high-potential children from poor backgrounds are identified at the start of compulsory education and receive sustained investment throughout their time at school.
Much valuable research has suggested that it is most efficient to invest early, but also that inputs are complementary (i.e. that later investment is most effective when it builds on earlier investment). Disadvantaged children who have reached school age doing relatively well should thus be in a particularly strong position to benefit from a period of such sustained investment.
Schemes of this nature could be piloted in the most deprived parts of the country and undergo a thorough evaluation before being rolled out on a national scale. Despite the fiscal limitations that governments are acting under, such investment may be needed in order to reduce England’s comparatively strong association between family background and high achievement, and thus to make pathways to elite higher education institutions and the top professions a viable option for more children from disadvantaged homes.’
As I have said before, aspiration-raising and support for gifted learners need not be mutually exclusive activities.
.
Another (MoreTypical) Perspective
Before I leave this topic, I want to draw attention to the bias that still operates in this territory.
Also in 2012, the IPPR (a UK-based think-tank) published ‘A Long Division: Closing the Attainment Gap in England’s Secondary Schools’
This favourably references Hanushek and Woessmann’s argument that ‘concentrating on both lower level attainment and high performers is complementary in terms of raising skill levels and economic growth at a national level’. But, quite unaccountably this is glossed by the statement:
‘This evidence challenges the popular logic of ignoring those who are struggling for fear of holding back those at the top’
when surely the ‘popular logic’ involves focusing disproportionately on the lower achievers!
This report also examines the proportion of students at different PISA benchmarks in the 2009 reading assessment. The table below shows the percentage at each benchmark for the UK, compared with the OECD average and a set of named ‘key competitors’
.

The Report draws attention to the significant difference in the volume of pupils failing to achieve level 2, compared with the much smaller volume at the higher levels.
While acknowledging that the UK faces ‘a two-horned challenge’ at the top and bottom of the attainment distribution, it uses another calculation – the number of learners who would have to achieve one level for England to have the same distribution as its key competitors – to advance its arguments for concentrating disproportionately at the lower end.
.

.
The text says:
‘It is clear that the biggest challenge – both in terms of the proportion and absolute number of students that need to improve – is raising the achievement of lower performers. Over 80 per cent of the pupils who would need to improve by one level to ensure the UK matches competitor countries come from attainment levels 3 or below.’
But, as we have seen from Jerrim’s research, the story is markedly different when socio-economic background is factored into the equation. Contrary to the IPPR’s suggestion, the excellence gap is important!
Later on the Report goes some way towards acknowledging this:
‘The government is right to be concerned about the low proportion of FSM pupils achieving top grades at GCSE. Ensuring bright pupils from disadvantaged homes are stretched will be important for narrowing the achievement gap. This will require a number of these pupils to raise their performance by the equivalent of one grade in each of their subjects. We estimate that around half of the FSM pupils that currently achieve straight-As would need to achieve straight-A* grades in order eradicate the achievement gap at the very top of the distribution. ‘
But once more this is immediately undermined:
‘While raising achievement at the top is important, it is only a small part of the picture. It is apparent…that there is also a long tail of underachievement among FSM pupils that needs to be tackled.’
Jerrim published his paper in June 2012 while the IPPR report appeared in September. What a pity that the IPPR failed to take account of Jerrim’s critically important findings.
.
The Impact of High Cognitive Skills on Economic Growth
It is high time we shifted our attention from a comparatively narrow focus on the excellence gap to consider wider work by Hanushek and Woessmann on the relationship between high level cognitive skills and economic growth.
Following the trajectory in Hanushek’s own work is comparatively easy since he helpfully provides links to most of his publications (all of the papers below can be accessed from this page).
Back in 2007 in a World Bank publication ‘Education Quality and Economic Growth’, Hanushek and Woessmann asked the question ‘Education for all or rocket scientists – or both?’ or, in other words:
‘Does educational performance at different points in the distribution have separate effects on economic growth?’
Drawing on the now familiar evidence in international comparisons studies, they conclude that there are separate and significant effects:
‘Importantly, the relative size of the effects of performance at the bottom and at the top of the distribution depends on the specification, and further research is needed to yield more detailed predictions. Even so, the evidence strongly suggests that both dimensions of educational performance count for the growth potential of an economy…. In sum, different dimensions of the quality of education seem to have independent positive effects on economic growth. This is true both for basic and top dimensions of educational performance and for the math and science dimensions. Because of the thin country samples, however, one should trust the pattern of results more than the specific estimates’.
We have already seen from my previous posts – summarised above – how this thinking had developed by 2010, but what further progress has been made since then?
In a 2012 paper, a small additional gloss is added, which is nevertheless useful:
‘Many countries have focused on either basic skills or engineers and scientists. In terms of growth, our estimates suggest that developing basic skills and highly talented people reinforce each other. Moreover, achieving basic literacy for all may well be a precondition for identifying those who can reach “rocket scientist” status. In other words, tournaments among a large pool of students with basic skills may be an efficient way to obtain a large share of high-performers.’
Unfortunately, although Hanushek and Woessmann can readily quantify the economic impact of improvements in cognitive skills as measured by international comparisons studies, this is always in generic terms.
In an October 2010 study called ‘How Much Do Educational Outcomes Matter in OECD Countries?’ they use PISA test data and GDP data from the Penn World Tables to map the relationship between these two variables in 24 OECD countries.
They find that an increase of one standard deviation – equivalent to 100 points on the PISA scale – ‘yields an average annual growth rate over 40 years that is 1.86 percentage points higher’.
They go on to consider whether basic skills or ‘top skills’ are more significant for developed countries. They begin by discussing a theory attributed to Vandenbussche et al suggesting that countries should prefer to invest in high skills when ‘close to a technological frontier’ whereas the reverse should be true for countries some distance from such a frontier. However they are not convinced, suggesting that arguments for the opposite effect are at least as strong.
Two analyses are offered, one based on differences between those educated at school and higher education level respectively; the other on the distribution of cognitive skills as measured by PISA test scores of at least 400 and at least 600 (so replicating the earlier study mentioned in my 2010 post).
The commentary below refers to the second analysis which is encapsulated in this table
.

.
The associated commentary notes that:
‘Both skill dimensions enter the model significantly, but the point estimate on the top-skill dimension is substantially higher. A 10 percentage point increase in the basic-skill share is associated with 0.3 percentage points higher annual growth; a 10 percentage point increase in the top-skill share is associated with 1.3 percentage points higher annual growth.’
This is the familiar ‘four times as much from top skills’ conclusion.
But the authors warn that this should not necessarily be taken to signal the relative significance of top skills compared with basic skills, because one has to factor in the feasibility of securing such improvements. It may prove somewhat easier to increase the share of basic skills than the share of top skills. This is particularly likely to be true of countries that are already performing relatively well at the top end.
This may help to explain why these results are not replicated when the analysis is confined solely to OECD countries:
‘When estimating the same model on the OECD sample, though, the point estimate on the top-skill share is only a fourth of the one estimated in the full-country sample and loses statistical significance…By contrast, the point estimate on the basic-skill share is slightly larger than in the full-country sample, and remains highly significant. The…difference in the estimate on the top-skill share between OECD and non-OECD countries is statistically significant.’
But this otherwise surprising disparity is not further explored, as the authors move on to consider the economic value of different education reforms. None of the reforms involves targeted support for high-achieving learners. There is apparently no place for gifted education in the education production function.
Nor do they consider explicitly the economic value of increasing the number of learners who achieve the higher benchmarks on the international comparisons studies. Instead they use much less specific proxies including:
- improving average student performance by 0.25 of a standard deviation or 25 PISA points;
- bringing all countries to the level of the top performer in PISA (Finland); and
- improving all students to a minimum proficiency level – defined as the 400 point marker on the PISA scale.
None of these is directly relevant to our argument. The broad conclusion is that:
‘Independent of whether the underlying economic model is specified in endogenous-growth or neoclassical terms, improved educational achievement is projected to have a large impact on future economic well-being of OECD countries.’
The same methodology is applied in another study: ‘The Economic Benefit of Education Reform in the European Union’ (2012) which considers how GDP in the EU and its member states might increase as a consequence of improved educational achievement.
They estimate the impact of bringing each country to the average level achieved by students in Finland (556 points in PISA 2006). Assuming an endogenous growth model:
‘On average, annual EU growth rates would be about one percent higher, reflecting the fact that the average gap with Finland is slightly more than one-half standard deviation on the PISA tests. Across the whole EU, the present value of this educational reform would amount to Euros 95 trillion, or more than 7 times the current GDP of the EU and about 17 percent of the discounted future GDPs over the same time span.’
Alternatively, assuming a neoclassical growth model, the present value of such an improvement amounts to Euros 72 trillion.
The comparable figures for England only are Euros 10,961 billion (endogenous) and Euros 8,393 billion (neoclassical).
It is disappointing that Hanushek and Woessmann seem to have focused their attention on national efforts to reach average levels of high performance in PISA and other international comparisons studies, rather than pursuing their initial distinction between top skills and basic skills.
.
From Intelligence to Cognitive Capitalism
One further Hanushek and Woessmann publication provides a useful link between their work and the parallel efforts of Rindermann.
In 2011, in a Chapter of a Handbook of the Economics: Economics of Education called ‘The Economics of International Differences in Educational Achievement’ the authors draw on many of the findings from their earlier work, but they also include a commentary on parallel models, in the psychological tradition, which seek to explain variations in economic growth through national IQ differences.
These seem to me fundamentally flawed for three reasons. First, they assume a single measure of intelligence (g); second, they appear to rest on the assumption that intelligence is exclusively heritable; and third, there are issues with the data.
Hanushek and Woessmann deal with the second and third of these (though not, apparently, the first):
‘The potential difference from the preceding analysis is the common view that IQs are fixed and not subject to schooling or environmental influences…This fixed-factor view, often related to ideas of the high degree of heritability of IQs, of course is not the uniform view of researchers in the area. Indeed, in the economics literature, Goldberger and Manski (1995) and Heckman (1995) have clear analyses showing that families and schools have strong effects on measured IQ…
The real question with these analyses is what exactly is being measured. The underlying IQ scores by country come from an idiosyncratic collection of national data that relies on specialized samples for specific cohorts and subsets of the population. Thus the question that arises is how much measurement error there is in an underlying skill dimension….
The conclusion from the various models of the impact of national IQ scores on economic outcomes is that IQ provides another potential measure of cognitive skills…Nonetheless, most of the analyses would suggest that this measure is noticeably more error prone than the international test data stressed here.’
The penultimate sentence is perhaps a little more generous than the evidence warrants.
.
Tracing the Evolution of Cognitive Competence Through Rindermann’s Thinking
Before the Smart Fraction
Some of Rindermann’s early papers sought to get round this problem by insisting that achievement – as measured by PISA, TIMSS and PIRLS – and intelligence are fundamentally the same entity.
This is evident in a 2007 paper: ‘Relevance of education and intelligence at the national level for the economic welfare of people’.
This acknowledges that research about intelligence at national level faces problems over the quality of data (so agreeing with Hanushek above) but such issues do not apply to the international comparisons studies like TIMSS and PISA.
Since national IQ results:
‘correlate so highly with the results of international school assessments that the two types of tests appear to measure the same or at least a similar construct’.
Rindermann develops an argument that intelligence tests and international comparisons studies are ‘indicators of one common cognitive ability’.
- At national level the correlations between IQ tests and international comparisons studies are very high (r = 0.80-0.90)
- They both assess thinking and knowledge. Though there is a theoretical difference between these two concepts these ‘two intertwined ability components are difficult to separate. Knowledge is always required to solve the kinds of task that individuals are confronted with in everyday life or that are used in cognitive ability tests. And thinking ability helps to increase and use knowledge.’
- Therefore the two types of test ‘are alternative measures of an homogenous construct’ so one can reasonably generate a composite score from the two combined.
- This will provide a ‘concise measure of knowledge-reduced intelligence, of (as valuable and true estimated) knowledge and of thinking skills that are needed to make use of this knowledge’.
The paper proceeds to demonstrate the international distribution of such a composite score and its correlation with other variables, as well as the impact on GDP.
The average score is derived from a complex aggregation of Lynn and Vanhanen’s IQ database and a vast range of international comparisons studies (IEA reading, TIMSS, PIRLS and PISA for various years).
Rindermann points out close correlations between the results and the evidence of the quality of national education systems as well as various attributes of society. The correlation with GDP stands at (r = 0.63)
Another 2007 paper, ‘The g-Factor of International Cognitive Ability Comparisons: The Homogeneity of Results in PISA, TIMSS, PIRLS and IQ-Tests Across Nations’ makes a similar argument, acknowledging my first reservation above – that this position rests on an understanding that there is a single measure of cognitive ability – the g factor – which correlates with student achievement.
Rindermann discusses the term that should be used to describe these competences assessed through IQ tests and international comparisons studies alike:
‘The sum value of different student assessment scales or of student assessment and intelligence test scales represents a combination of intelligence and knowledge. Knowledge itself has to be assessed normatively by its truthfulness and relevance. Pure knowledge questions (about true and important content) are only indirect measures of intelligence. A term that encompasses both intelligence and knowledge could be general complex (individual and national) cognitive ability.
In a subsequent study dating from 2009 ‘Educational Policy and Country Outcomes in International Cognitive Competence Studies’, Rindermann and Ceci investigate the extent to which national differences in this composite ‘cognitive competence’ measure are explainable by different aspects of their education systems.
They explore six ‘paradigms’ to explain such differences:
- Culture – the support that different cultures give to ‘cognitively stimulating education, rationality in thinking and everyday behaviour, reading, diligence, and thinking oriented toward reasonable standards (vs. rote learning, authoritarianism and traditionalism)’.
- Genes – the controversial idea that there are genetic differences operating at national level (which is explored extensively elsewhere in the psychological research literature).
- Wealth – the notion that wealth originates in factors such as engagement in trade and colonialism and improves cognitive competence through improved health and nutrition. (Rindermann and Ceci clearly favour the argument that intelligence drives wealth rather than vice versa.)
- Politics – the impact of democracy, the rule of law, political liberty and suchlike.
- Geography – through the impact of genetic theories, or the transmission of effects between geographically proximate countries which ‘learn more often from their near and related neighbours than they do from those living in regions far away. They adapt their customs and they benefit from their neighbours’ progress in education and wealth by imitation, by migration, through investments, or by melding their cultures and peoples.’
- Education – ‘Not only is education an important source of within-country cognitive competence differences, it is probably also an important source of between-country differences. Although evidence for the importance of education on cognitive development does not rule out the importance of non- educational factors (culture, genes, wealth, politics, and geography) as determinants of cognitive development and the possibility of reciprocal causation… a focus on education allows researchers to formulate suggestions for the improvement of educational policy with the probability that they will result in higher cognitive competences that ultimately will contribute to increased wealth, democratization, and better health for society.’
The study examines 16 educational factors that research has associated with positive student outcomes and their correlation with Rindermann’s cognitive competence measure, derived from a blend of intelligence and international comparisons studies.
The overall finding is that:
‘Across the several analyses that we conducted, six important predictors of national competence emerge: (a) the general educational level of adults, (b) kindergarten attendance, (c) discipline (school appropriate behaviour), (d) amount of education of students in given age (including the amount of instruction per year, attendance at additional schools, and attendance of high grades at a young age), (e) use of high-stakes exit tests and central objective exams, and (f) early tracking. In addition, some evidence also points to beneficial effects of early school enrolment, small classes (including high teacher–pupil ratio), direct instruction, and a low rate of grade retention.’
The reference to early tracking (aka setting) is particularly interesting given that the OECD takes a contrary view in its analysis of PISA outcomes.
Rindermann and Ceci argue that:
‘Tracking appears to be valuable when it is oriented toward competences measured by objective exams and not used to limit one’s final possible educational degree at a young age, as seen in systems that stream students into pre-collegiate or vocational tracks at a young age. One benefit of early tracking systems could be meeting the special educational needs of intellectually gifted students… But if high-ability students are adequately challenged in non-tracked school systems (e.g., by streamed classes within schools, by acceleration or skipping classes, by maintenance of ambitious learning goals for all students, or by enrichment courses), tracking between schools would not be necessary.’
.
After the Smart Fraction
These studies predate the work I described in my previous post on the smart fraction, but where did Rindermann’s thinking move to following that study?
In 2011, Rindermann and Thompson published ‘Cognitive Capitalism: The Effect of Cognitive Ability on Wealth, as Mediated Through Scientific Achievement and Economic Freedom’
This discusses the various origins of an ‘Intellectual Class Hypothesis’ in a manner highly redolent of my own blog post:
‘The intellectual-class hypothesis posits that individuals who are cognitively highly competent should have a positive effect on affluence, politics, and culture in their society. Several authors have referred to this phenomenon implicitly or explicitly; for example, Florida (2002) refers to the “creative class,” Hanushek and Woessmann (2009) speak of “rocket scientists,” Pritchett and Viarengo (2009) refer to “global performers,” and La Griffe du Lion (2002) calls the intellectual class the “smart fraction” of the population (see also Gelade, 2008; Weiss, 2009). Unlike with other forms of capital, there are no diminishing returns for cognitive ability: The higher the cognitive ability and the more persons at higher cognitive levels, the better. Performing research at the level of individual differences, Park, Lubinski, and Benbow (2008) found that even among the top 1% of cognitively competent persons, the upper quartile (rank 99.75) unambiguously outperformed the lower quartile (rank 99.25) in scientific and technological fields, as measured by science, technology, engineering, and math (STEM) publications and patents.’
Different definitions of the smart fraction are discussed – those exceeding an IQ or student assessment threshold, and those defined in statistical terms, eg at the 90th, 95th or 99th percentile. The authors select the latter option.
They discuss limitations of the Hanushek and Woessmann approach and of Rindermann’s own 2009 paper.
The latter fell short because: it used GDP as an indicator of wealth rather than ‘log GDP’ which would give relatively more value to increased wealth at lower levels than at higher levels; 42 of 90 countries were missing from the analysis; the three cognitive ability levels deployed were highly correlated with each other, so exposing them to ‘unstable path coefficients and suppressor effects’; it failed to explore the impact of other possible determinants of wealth; and, finally, it did not explore ‘the hypothesis that the development and functionality of economic institutions themselves could depend on cognitive ability, especially on the cognitive ability of an intellectual class.’
On this occasion the authors compare three ability levels – the mean, 95th and 5th percentiles. TIMSS, PISA and PIRLS data is used to calculate ‘mean ability values’ for 90 countries. The results are aggregated and standardised on a common scale with UK at 100. (This they call the ‘Greenwich IQ’).
The three ability levels are correlated with several different variables:
- Scientific and technological excellence measured through patent rates, Nobel prizes in science, number of scientists, and high technology exports, with all results adjusted for population size.
- Economic freedom, including ‘property rights, rule of law, low customs, taxes, government-spending ratio and trade restrictions’.
- The education level of society, a composite derived from adult literacy rates, graduation from secondary school and years of school attendance.
- Excellence in science, maths and technology from 800BC to 1950 ‘as measured by the eminence and number of important scientists in a country’.
The results are presented in the charts below. The first uses Rindermann’s percentiles; the second adopts Hanushek and Woessmann’s approach of utilising PISA scores of 400+ and 600+ respectively.
.

.
 .
.
The study concludes:
‘In modern society, the cognitive level of the intellectual class and its relative size are more important for economic development than are the mean cognitive level or the cognitive level and relative size of lower-ability groups. STEM achievements depend on the level of cognitive ability of the intellectual class; additionally, the intellectual class’s ability level positively influences wealth by increasing economic freedom. We confirmed this result using different measures of the ability and percentage of intellectual classes, different country samples, different time intervals and historical periods, and different statistical methods. The results underscore the relevance of human capital for the wealth of nations, more particularly, the relevance of the intellectual classes, as mediated by high accomplishment in STEM and by economic freedom.
In concrete numbers, an increase of 1 IQ point in the intellectual class raises the average GDP by $468 U.S., whereas an increase of 1 IQ point in the cognitive ability of the mean raises average GDP by $229 U.S….
… Wealth in modern times is the result of cognitive capitalism. Cognitive capitalism refers to the idea that the cognitive ability of society as a whole, and of its cognitive elite in particular, is the prerequisite for the development of technological progress, for the historic development of modern society with its increasing cognitive demands and complexity, and for the wealth furthering norms and institutions that form the core of the capitalist system (economic freedom, free markets, rule of law, property rights). In effect, cognitive ability is crucial in creating and sustaining a high-achievement milieu leading not only to economic growth and wealth, but also to a democratic and free society.’
The concept of cognitive capitalism is further developed in a 2012 study called ‘Intellectual classes, technological progress and economic development: The rise of cognitive capitalism.’
This considers whether intelligence leads to wealth or vice versa, whether other factors are involved and, assuming that intelligence produces wealth, how that is achieved.
Unsurprisingly, Rindermann concludes that intelligence does indeed produce wealth. There are reciprocal effects but these are relatively weaker. He suggests that:
‘Each IQ point increase in the nineteen sixties has raised wealth in 2000 by US $279. Each $1000 GDP increase in 1970 has increased cognitive competence in2000 by 0.23 IQ points.’
He proceeds to advance a more refined theory of cognitive competence to explain how this happens. It is partly attributable to the aggregated effect of the relationship between individuals’ intelligence and their performance at work, but there are several more significant national effects in play:
- The cognitive ability of the political class, which is critical to the competence of government;
- The quality of various national institutions – government and administration, courts, companies, police, armed services, schools and universities.
- Social factors – ‘as cognitive development benefits from the intelligence level of one’s social environment…intelligence of others is important for nurturing individuals’ intelligence. During youth the intelligence of parents, teachers and classmates is important, in adulthood that of colleagues and neighbors, at the level of society the competence of politicians, entrepreneurs, scientists, and intellectuals’.
- Impact on the political orientations and behaviour of individuals – ‘Intelligence contributes to a general pattern of cognitive rationality including the formation of more reasonable worldviews.’ Intelligence also helps to shape culture and impact on the development of ‘democracy, political liberty and rule of law’
Perhaps aware that some of this sounds a little grandiose – a touch hyperbolic – Rindermann offers an important health warning:
‘However, cognitive ability is not the single determinant of all these outcomes. There are additional factors behind and beneath ability, and between ability and the positive outcomes. And of course, intelligence has no deterministic effect, in the sense that intelligence always leads to the aforementioned results. Intelligence only increases the probability of these outcomes.’
Then he factors the smart fraction into his argument, however that might be defined:
‘Highly able intellectual classes are necessary to manage growing complexity in technology, economy and everyday life. Especially in modern times, wealth depends mainly on technological progress…and this depends on cognitive ability – in particular of the smartest members within a society. Hanushek and Woessmann…found that the level of ‘‘rocket scientists’’ is more important for growth than the mean level of a society or the percentage of people above a low threshold (around IQ 85). But ‘‘rocket scientists’’ as category would be too narrow because for a functioning society not only exceptional scientists and engineers are necessary, but also ‘‘normal’’ scientists and engineers maintaining daily business, also officials, politicians, teachers, and – as Schumpeter (1939) mentioned – entrepreneurs and their primarily cognitively based abilities of economic process innovations and economically successful use of inventions shifting the conventional ways of production, trade and consumption.’
Intriguingly, he begins to expose a new dimension which suggests that this is not simply a matter of individual cognitive competence: there is also a ‘network dimension’:
‘Here it is less the individual’s cognitive competence which is relevant, but more the cognitive competence of social networks, institutions and societies in their interplay (engineers and entrepreneurs, scientists and engineers, politicians and officials, consumers and producers, scientists and editors, universities and companies…Cognitive competence increases with use, and becomes the main capital in the modern production process…’
He then presents a reanalysis using data from Hanushek and Woessmann’s previous study, though the results seem somewhat less convincing than one might have hoped.
.

.
Nevertheless Rindermann draws the conclusion that:
‘Scientific-technological excellence and economic freedom depend more on the size of a smart fraction. Wealth depends more on scientific-technological excellence than on economic freedom…. Economic freedom, the rules and institutions enabling a free economy, depends also on an intellectual class. It seems that not only wealth, but even capitalism depends on the size and cognitive level of a high ability group within society. Capitalism in modernity is a cognitive one!’
.
Reviewing the Dartboard
We come to the end of a lengthy and intellectually demanding review of a body of research from several different sources, each of which contributes something to our emerging understanding of the economics of gifted education.
It is not straightforward to sum up the key points in a set of bullet points, but here is my best effort. I’ve set out the points in the order they appear above. Imagine each bullet as a dart somewhere in my imaginary dartboard:
- The pool of high achievers in schools feeds the human capital pipeline which provides the critical mass of highly-skilled employees in the workforce necessary to drive innovation and economic growth.
- There is a gap between the supply of high achievers we produce in England and the supply of high achievers generated by the Asian countries that dominate international comparisons studies. The gap tends to increase between the end of primary school and the end of secondary school.
- Even if this is attributable to cultural factors (such as willingness to invest in private tuition and devote extra time to learning) that cannot be replicated here, the Government may need to develop suitable education policy responses.
- In the US, although excellence gaps are smaller than achievement gaps, they are closing more slowly and less consistently. There is no evidence that any state has identified a solution to its excellence gap.
- In England, some of the evidence that high ability learners from disadvantaged backgrounds are subsequently overtaken by lower ability learners from advantaged backgrounds is undermined by the statistical effect of regression to the mean.
- On the evidence of PISA test scores in reading, socio-economic achievement gaps in England are higher than comparator countries at the top end of the ability distribution, whereas the overall gap is broadly similar and, at the bottom, England has a gap smaller than the median. This may be because attention is focused disproportionately on the ‘long tail of low achievement’.
- While the average gap in England has declined since 2000, as has the gap at the low end of the achievement distribution, the opposite is true at the top end where the gap is widening. This may again be attributable to the relative reach, scale and effectiveness of different policy interventions. It may also be attributable to a decline in standards which, at the top end, has impacted disproportionately on those from disadvantaged backgrounds.
- A targeted gifted and talented programme is one appropriate policy intervention to address the excellence gap which could be piloted locally and rolled out nationally. Such investment may be necessary despite the fiscal limitations that currently apply
- There are separate and significant effects on economic growth from the bottom and the top of the achievement distribution. Developing basic skills and highly talented people are mutually reinforcing (and the latter probably depends on the former). There is evidence that improvements at the top end have a bigger impact on growth, though these may be harder to secure.
- There is a significant research literature suggesting that national IQ differences have a significant impact on economic growth, but this is undermined by the assumptions upon which that research depends.
- Attempts have been made to suggest that intelligence tests and international comparisons studies are essentially measuring the same ‘cognitive competence’. There is certainly a strong correlation between them (but this is not quite the same thing as seeing them as fundamentally the same construct).
- Some educational factors are more associated with ‘cognitive competence than others’, yet no work has been found that positions gifted education programmes within the education production function, either generally or for the top end of the achievement distribution.
- There is evidence to suggest that the cognitive level of the smart fraction and its size are more important for economic growth than the mean cognitive level or the cognitive level and size of low-achieving groups.
- Growth is the product of cognitive capitalism which is vested disproportionately in the smart fraction. This also impacts positively on the political class and a wide range of national institutions. Countries need ‘rocket scientists’ but the level below this is even more significant. There may be a network dimension to cognitive capitalism, where the value is derived from groups working collaboratively, rather than solely from the individuals.
When it comes to mapping those conclusions against my initial premiss, which of the elements have been addressed and so how close are we to the ultimate objective I proposed?
It seems to me that:
- This evidence base reflects the balance between excellence and equity in gifted education.
- It incorporates the smart fraction and the excellence gap, though none of the studies links the two concepts and looks systematically at the relationship between them.
- That said, there is abundant evidence that each of these concepts contributes to the supply of human capital and impacts positively on economic growth.
- There is recognition that both must be tackled systematically during schooling and some support for doing so through a dedicated programme that would be rolled out nationally.
- The evidence base is confined to reading, maths and science – the focus of the leading international comparisons studies – and there is particularly strong emphasis on STEM. There is no reference within this evidence base to the benefits accruing from talent in, say, arts and sports.
- There is some focus on additional benefits from the smart fraction in areas such as political leadership, governance and national institutions and on the positive impact on social mobility from reducing the excellence gap. However, wider spillover benefits are not addressed.
- Finally, there is no attempt within this evidence base to calculate the costs and benefits of a national gifted education programme, so demonstrating that the flow of benefits substantively exceeds the cost.
All of which suggests that there remains a huge agenda to address in this emerging field I have called the economics of gifted education.
There is still a pressing need to bring economists of education and gifted educators together to explore this territory, even though it would appear that some of the initial advances from gifted educators have been spurned.
We really need a champion in the economics of education to act as a conduit on that side of the fence. Step forward volunteers!
.
Final Thoughts (and the Gifted Phoenix Equation!)
Having regaled you recently with a Gifted Phoenix Manifesto and a Gifted Phoenix Premiss, I feel compelled to inflict on an unsuspecting world the third leg of a self-promotional hat-trick: the Gifted Phoenix Equation!
This applies only to the criterion-referenced method of determining the smart fraction, as opposed to the norm-referenced method which assumes that the fraction is a fixed proportion. (The former incorporates a quantitative as well as a qualitative dimension, whereas the latter is confined to the qualitative. That is a significant distinction which is not discussed extensively in the papers I have reviewed.)
Is it the case that:
Minimising the Excellence Gap [Equity]
plus
Maximising the Smart Fraction (the size of the fraction and its average level of achievement) [Excellence]
equals
Maximum impact from high achievers on National Economic Growth?
.
Min EG + Max SF (Number + Av score) = Max EG impact?
.
Is Rindermann right when he says there are no diminishing returns on investment in high level human capital, or can a country have too much of a good thing?
Isn’t it possible to generate too large a smart fraction, creating an over-supply of under-employed highly-skilled labour that might then find occupation in dissent, or even crime?
In which case, is there an optimal size for the smart fraction that should be incorporated into the Gifted Phoenix Equation?
Assuming there is not already an answer to that question, I hereby lay down the Gifted Phoenix Challenge – to find one!
.
GP
March 2013

Thanks for this extensive report.
~Terry
Illinois Association for Gifted Children, USA
http://www.iagcgifted.org
It is great to have this so succinctly reviewed. Thank you for your time and effort. I guess it is the meat in the sandwich to satisfy what our gut feelings have told us all along. Now may it reach the digestion chamber of our parliament and be stirred by the digestive juices of all those dart players calling themselves our education ministry. Our gifted children’s well being is the target.
Thank you